This series will focus on topics taken directly from customer interactions, community discussion and practical, real-world use of Anchore Engine deployments. The goal will hopefully be to provide lessons learned from real-world deployments of Anchore.
Part 1: Concepts and Metrics
In the first set of posts in this series, I will walk through how to evaluate and tune your Anchore deployment for better image analysis performance. To do so, we'll discuss the actions Anchore Engine takes to pull, analyze and evaluate images and how that is affected by configuration and deployment architecture. We'll also point out how you can get metrics on each of these functions to determine what you can do to improve the performance of your deployment.
Firstly, I want to take a moment and thank the Anchore Community Slack and also the Anchore Engineering team for helping me delve very deeply into this. They've been fantastic, and if you haven't done so yet make sure you join our slack community to keep up to date with the project and product, as well as exchange ideas with the rest of the community.
One thing to understand about Anchore's approach is that the acts of image analysis (downloading and analyzing the image contents) and of image scanning (for vulnerabilities) are separate steps. Image analysis only needs to happen once for any given image digest. The image digest is a unique ID for a given image content set, and Anchore is capable of watching an image tag in an upstream repository and detect when a new version of the content of that image (the digest) has been associated with a tag.
Vulnerability scans and policy evaluations are performed against any image (digest) that has been analyzed. When updates happen to either a vulnerability feed or a policy bundle, Anchore can re-scan an image to produce the latest vulnerability report or policy evaluation report for any given digest without the need to re-analyze the image (digest).
Put simply, our discovery of the contents of an image digest is separate from our evaluation of the vulnerabilities or policy compliance of the same said image digest. Image analysis (ie: the downloading, unpacking and discovery of contents of an image digest) is a far more expensive operation from an I/O perspective than image scanning (ie: the scanning said image digest analysis data for vulnerabilities or policy evaluation.)
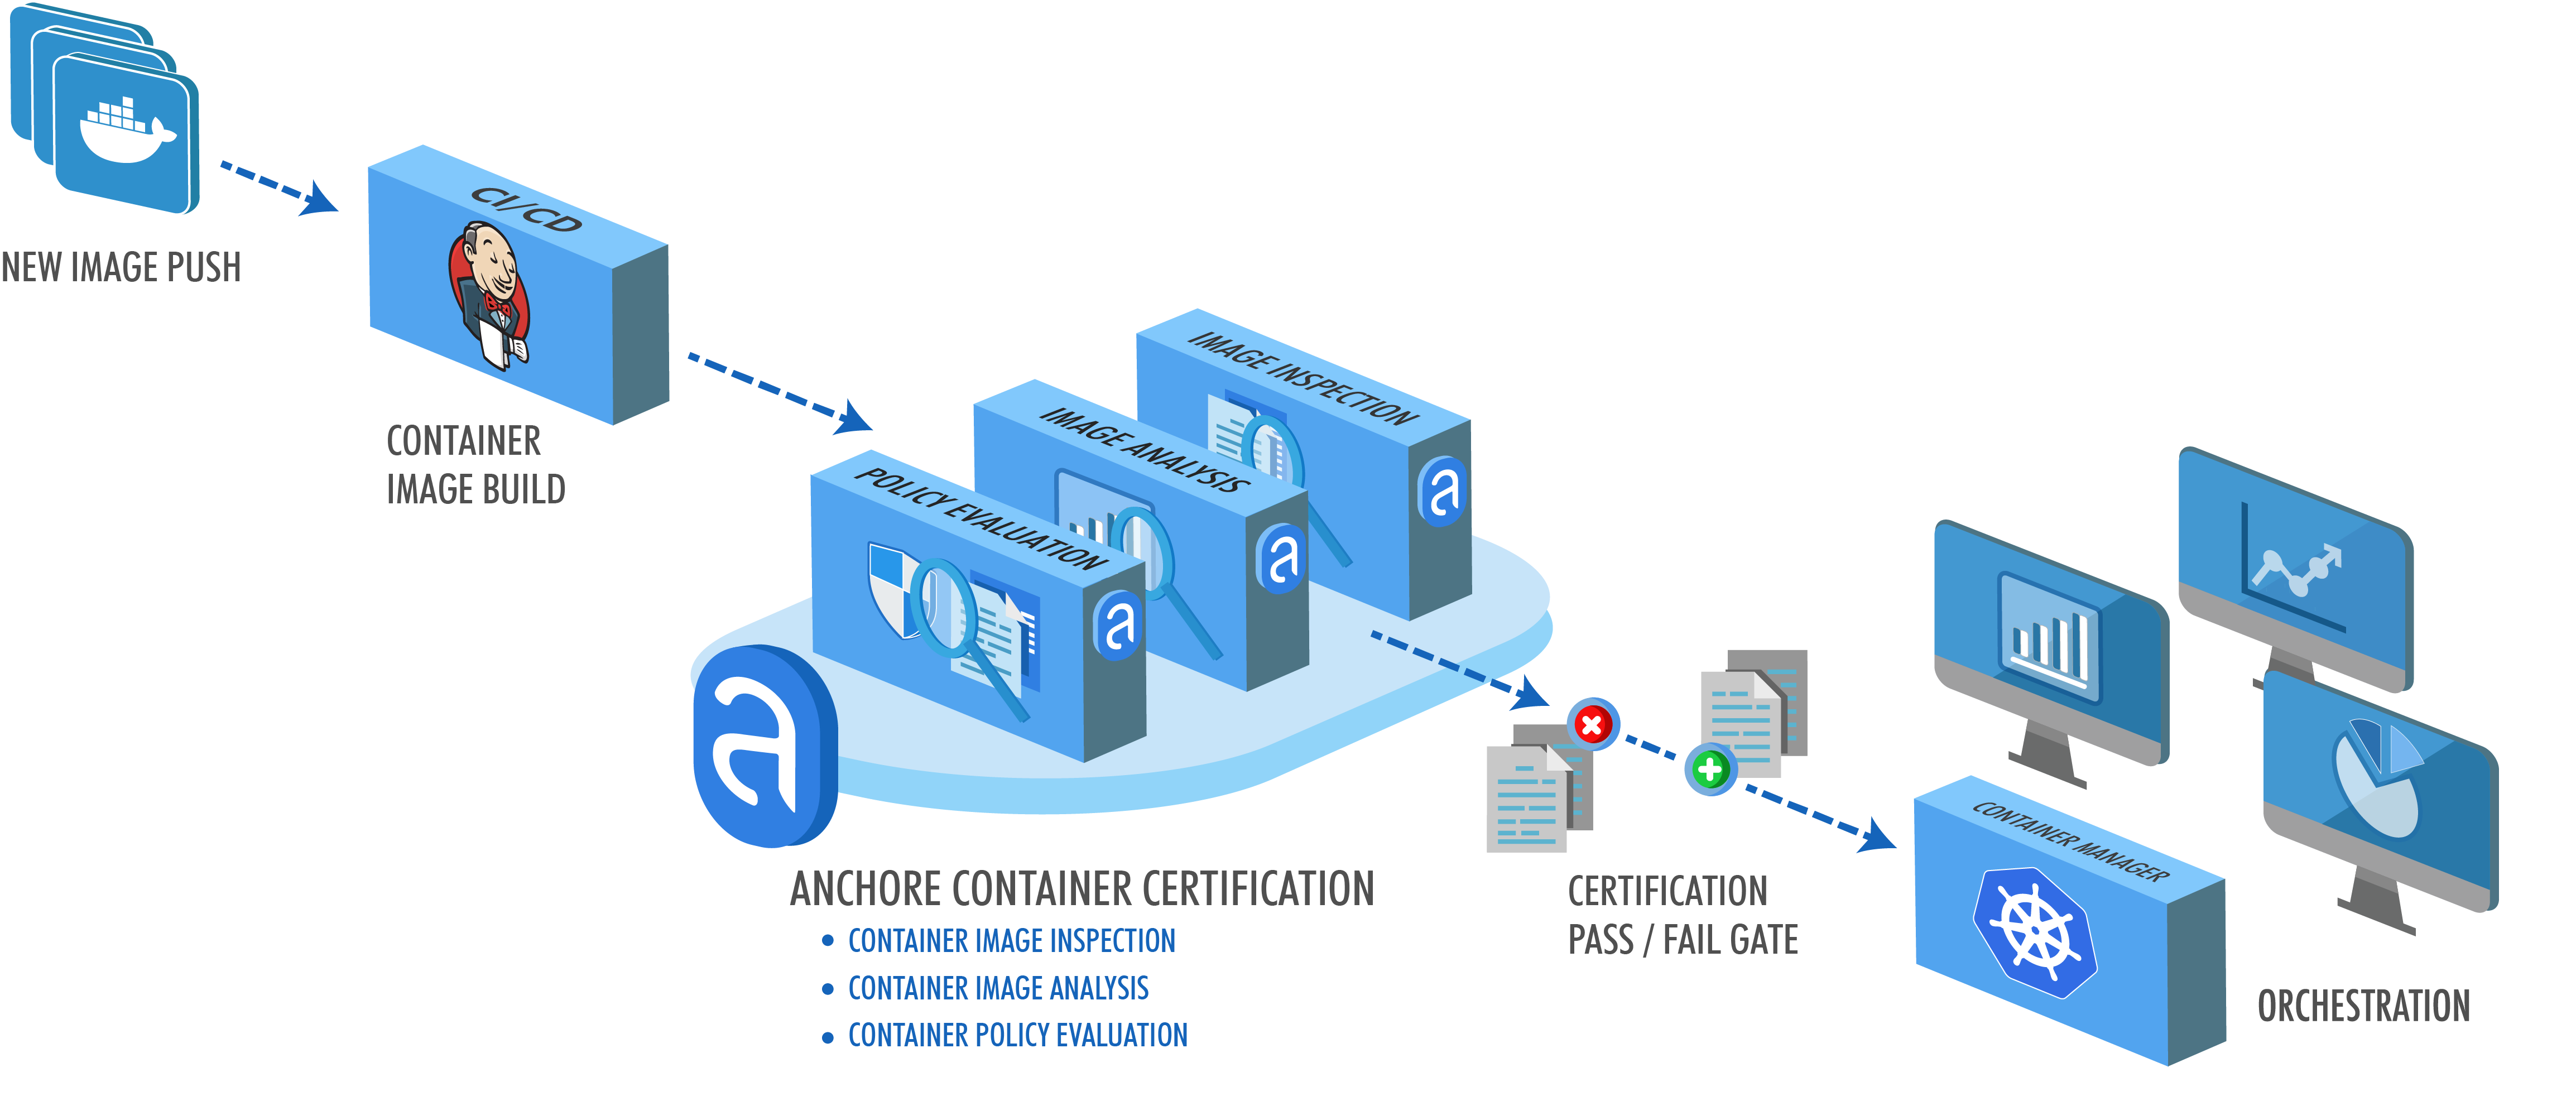
Let's review what actually happens to a container image (digest) as Anchore Engine consumes and analyzes it:
1) The Image is downloaded.
2) The Image is unpacked.
3) The Image is analyzed locally.
4) The result of the analysis is uploaded to core services.
5) The analysis data that was uploaded to core services is then evaluated during a vulnerability scan or policy evaluation.
The first four steps are what we call image analysis. That last step is image evaluation. Each of those actions has specific performance implications in your deployment.
Most importantly is to know what parts of your deployment require changes to improve performance and to do that we need information. Let's start by enabling metrics on our Anchore Engine deployment.
To enable the metrics option in Anchore Engine, look to set the following in your Anchore Engine configuration file config.yaml:
metrics:
  enabled: True
Once that is enabled and the services brought up a /metrics route will be exposed on all individual Anchore services that are listening on a network interface and require authentication. You can then configure Prometheus to scrape data from each Anchore service. These are those services:
1) apiext: Running on port 8228 this is the External API service.
2) catalog: Running on port 8082 this is the internal catalog service.
3) simplequeue: Running on port 8083 this is the internal queuing service
4) analyzer: Running on port 8084 this is the service that analyzes the containers pulled into Anchore.
5) policy_engine: Running on port 8087 this is the internal service that provides the policy engine for evaluation and action on the analyzed containers.
Only the external API service is typically enabled for external access. All other services are used only by the Anchore Engine. Prometheus should have network access to each service to be scraped and the Prometheus service should be configured with credentials to access the engine. Here's an example:
global:
  scrape_interval: 15s
  scrape_timeout: 10s
  evaluation_interval: 15s
alerting:
  alertmanagers:
  - static_configs:
    - targets: []
    scheme: http
    timeout: 10s
scrape_configs:
- job_name: anchore-api
  scrape_interval: 15s
  scrape_timeout: 10s
  metrics_path: /metrics
  scheme: http
  static_configs:
  - targets:
    - anchore-engine:8228
  basic_auth:
    username: admin
    password: foobar

- job_name: anchore-catalog
  scrape_interval: 15s
  scrape_timeout: 10s
  metrics_path: /metrics
  scheme: http
  static_configs:
  - targets:
    - anchore-engine:8082
  basic_auth:
    username: admin
    password: foobar

- job_name: anchore-simplequeue
  scrape_interval: 15s
  scrape_timeout: 10s
  metrics_path: /metrics
  scheme: http
  static_configs:
  - targets:
    - anchore-engine:8083
  basic_auth:
    username: admin
    password: foobar

- job_name: anchore-analyzer
  scrape_interval: 15s
  scrape_timeout: 10s
  metrics_path: /metrics
  scheme: http
  static_configs:
  - targets:
    - anchore-engine:8084
  basic_auth:
    username: admin
    password: foobar

- job_name: anchore-policy-engine
  scrape_interval: 15s
  scrape_timeout: 10s
  metrics_path: /metrics
  scheme: http
  static_configs:
  - targets:
    - anchore-engine:8087
  basic_auth:
    username: admin
    password: foobar
This config file would go into the anchore-prometheus.yaml file created as part of the docker-compose or helm deployment.
The last bit of information you'll want is metrics on the performance of your postgres service. For Anchore specifically, we want to know mostly about connection statistics and I/O timing. This can be discovered with the execution of something like "select * from pg_stat_activity;" within your DB container. If you need help exploring your postgres instance inside of Docker, here's a good post to use as reference: https://markheath.net/post/exploring-postgresql-with-docker
Knowing how long it takes your Anchore deployment to scan your images, how the other services are receiving and sending data, and having metrics on the postgres database performance is key to knowing where you can help tune your system.
If you would like to see the metrics from Prometheus you need only hit the API endpoint for the service you want metrics on using an authenticated call. For example, using a docker-compose exec command, it would look like this:
docker-compose exec anchore-engine curl http://admin:foobar@localhost:8087/metrics
That's a call to get metrics on the policy engine. Refer to the config YAML above to hit the port needed for the service you would require metrics from.
In Part 2 of this series we will go in-depth to break down the functional steps described above to match them with the gathered metrics, and then evaluate how to tune our configuration and deployment accordingly.