As with any application, after deploying Anchore you may run into some common issues. In this post, we’ll walk through troubleshooting Anchore’s more common issues we’ve seen to provide you with a better understanding of their cause and how to solve them.
Verifying Services and System Health
When troubleshooting in Anchore, your first step should start with viewing the event log, then the health of Anchore services and lastly looking into the logs.
The event log subsystem provides users with a mechanism to inspect asynchronous events occurring across various Anchore services. Anchore events include periodically triggered activities such as vulnerability data feed sync in the policy_engine service, image analysis failures originating from the analyzer service and other informational or system fault events. The catalog service may also generate events for any repositories or image tags that are being watched, when Anchore Engine encounters connectivity, authentication, authorization or other errors in the process of checking for updates.
The event log is aimed at troubleshooting the most common failure scenarios (especially those that happen during asynchronous operations), and to pinpoint the reasons for failures that can be used subsequently to help with corrective actions. To view the event log using the Anchore-CLI:
`anchore-cli event list`You can get more details about an event with:
`anchore-cli event get `Each Anchore service has a health check and reports its status after it’s been successfully registered. To view Anchore system status using the Anchore-CLI:
`anchore-cli system status`The output will give you a status for each Anchore service to verify that they’re up and running.
One of the most helpful tools in troubleshooting issues in Anchore is to view the logs for the respective service. Anchore services produce detailed logs that contain information about user interactions, internal processes, warnings and errors. The verbosity of the logs is controlled using the log_level setting in config.yaml (for manual installations) or the corresponding ANCHORE_LOG_LEVEL environment variable (for Docker ompose or Helm installations) for each service. The log levels are DEBUG, INFO, WARN, ERROR and FATAL, where the default is INFO. Most of the time, the default level is sufficient as the logs will contain warn, error and fatal messages as well. However, for deep troubleshooting, increasing the log level is recommended to DEBUG in order to ensure the availability of the maximum amount of information.
Anchore logs can be accessed by inspecting the Docker logs for any Anchore service container using the regular Docker logging mechanisms, which typically default to displaying to the stdout/stderr of the containers themselves, or by the standard Kubernetes logging mechanisms for pods. The logs themselves are also persisted as log files inside the Anchore service containers. You will find the service log files by executing a shell into any Anchore service container and navigating to /var/log/anchore.
For more information on where to begin with troubleshooting, take a look at our Trouble Shooting Guide.
Feed Sync
When Anchore is first deployed, it synchronizes vulnerability feed data with upstream feeds. During this process, vulnerability records are stored in the database for Anchore to use for image analysis. The initial sync can take several hours as there are hundreds of thousands of feed records, but subsequent syncs typically don’t take as long. While the feeds are syncing, it’s best to let the process completely finish before doing anything else as restarting services may interrupt the sync process, requiring it to be re-run. This is a good time to familiarize yourself with Anchore policies, the Anchore-CLI subsystem and other feature usages.
The time it takes to successfully sync feeds is largely dependent upon environmental variables such as memory and CPU allocation, disk space and network bandwidth. The policy engine logs have information regarding the feed sync, including task start and completion, records inserted into the DB or information around a failed sync. The status of the feed sync can be viewed by using the Anchore-CLI system feeds subsystem:
`anchore-cli system feeds list`Should the sync be interrupted or one of the feeds fail to sync after all other feeds have completed a manual sync can be triggered:
`anchore-cli system feeds sync`Feed data is a vital component for Anchore. Ensuring the data is synchronized and up-to-date is the best place to start in order to have a fully functional and accurate Anchore deployment.
Analysis Result Questions or Analysis Failing
Once your Anchore deployment is up and running, performing image analysis can sometimes lead to an image failing to analyze or questions about the analysis output around false positives. When these occur, the best place to begin is by viewing the logs. Analysis happens in the analyzer pod or container (depending on deployment method), and the logs from the API and analyzer will shed light on the root cause of a failure to analyze an image. Typically, analysis failures can be caused by invalid access credentials, timeouts on image pulls or not enough disk space (scratch space). In any case, the logs will identify the root cause.
Occasionally image analyses will contain vulnerability matches on a package that may not seem to be valid, such as a false positive. False positives are typically caused by two things:
- Package names reused across package managers (e.g. a gem and npm package with the same name). Many data sources, like NVD, don’t provide sufficient specification of the ecosystem a package lives in and thus Anchore may match the right name against the wrong type. This is most commonly seen in non-OS (Java, Python, Node, etc.) packages.
- Distro package managers installing non-distro packages using the application package format and not updating the version number when backports are added. This can cause a match of the package against the application-package vulnerability data instead of the distro data.
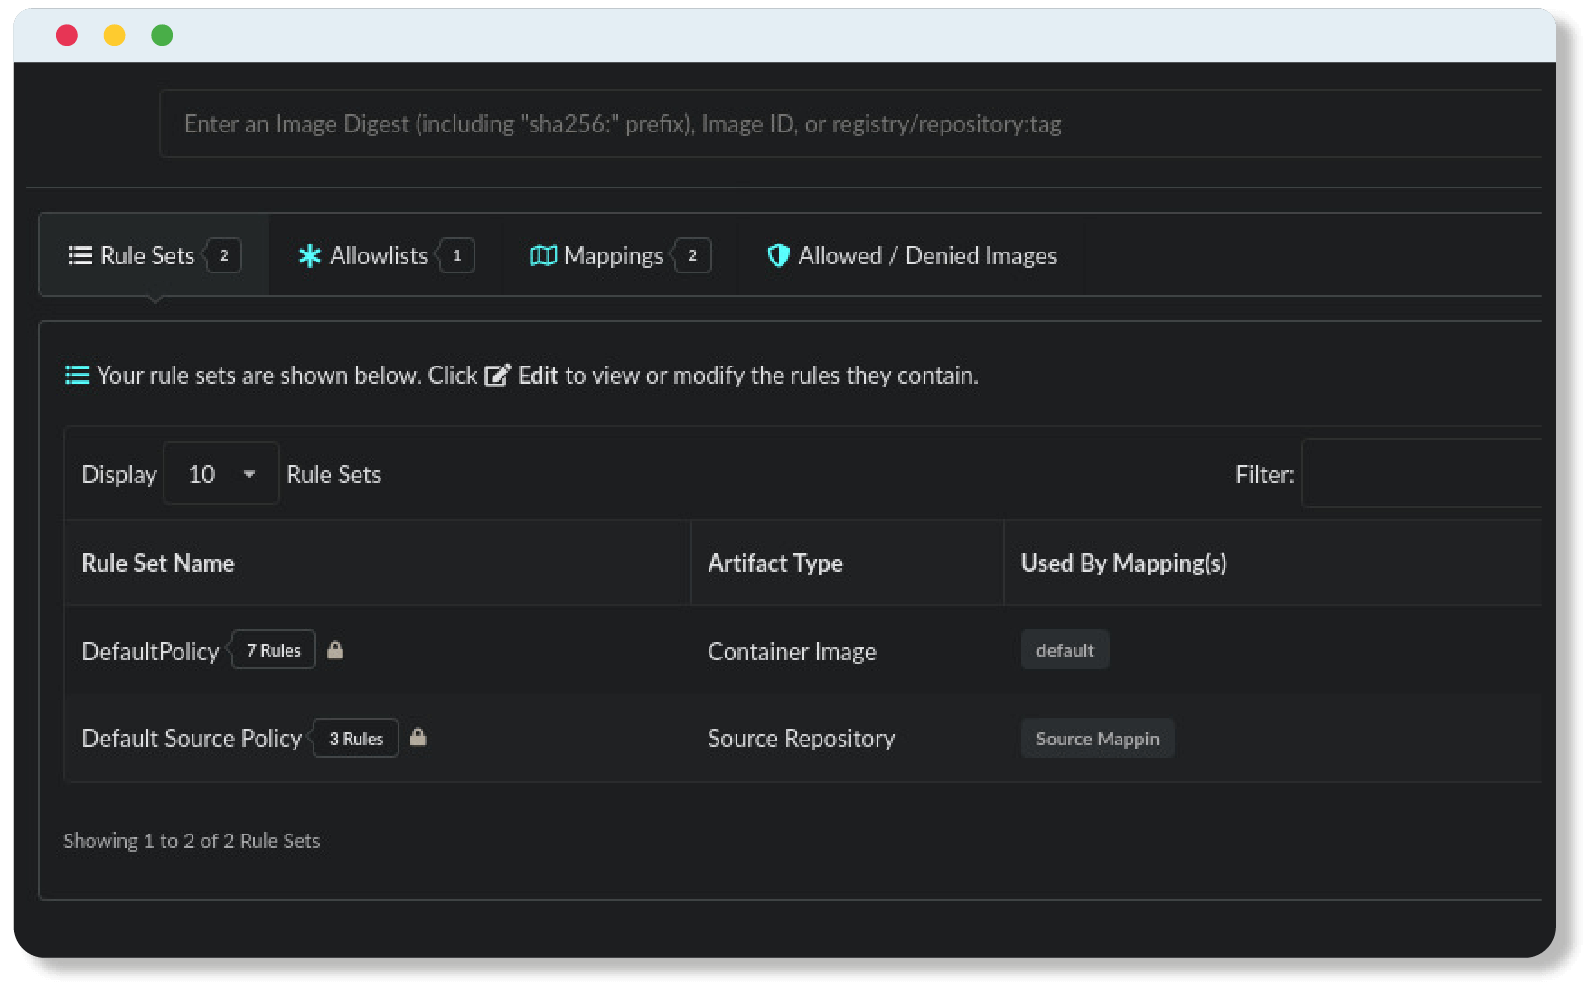
The most immediate way to respond to a false positive is to create a rule in the Anchore policy engine by adding it to a whitelist. For more information on working with policy bundles and whitelists, check out our Policy Bundles and Evaluation documentation.
Pods/Containers Restarting or Exiting
Perhaps the most common issue we see at Anchore is the Anchore service pods or containers restarting, exiting or failing to start. There are multiple reasons that this may occur, typically all related to the deployment environment or configuration of Anchore. As with any troubleshooting in Anchore, the best place to start is by looking at the logs, describing the pod or by looking at the output from the Docker daemon when trying to start services with Docker Compose.
One common issue that causes a pod or container to fail to start has to do with volume mounts or missing secrets. For Anchore Enterprise, each service must have a license.yaml mounted as a volume for Docker Compose deployments and a secret containing the license.yaml for Kubernetes deployments. For Anchore Engine, the license is not necessary, however mounting configuration files and other files such as SSL/TLS certificates may result in invalid mounts.
One of the most common errors that we see when deploying Anchore has to do with memory and CPU resource allocation. Anchore will typically operate at a steady-state using less than 2 GB of memory. However, under load and during large feed synchronization operations (such as the initial feed sync), memory usage may burst above 4GB. Anchore recommends a minimum of 8GB for each service, for production deployments.
Be sure to review our requirements before deploying Anchore to confirm there are enough available resources for Anchore to operate without a hitch.
Conclusion
For more information, take a look at our documentation and FAQ’s. We hope that these issues aren’t ones you encounter but with a little planning and troubleshooting Anchore know-how, you’ll be up and analyzing in no time.


