If you last tried Grype a year ago and haven’t checked back recently, you’re in for some pleasant surprises. The past twelve months have significantly improved the accuracy and performance of our open source vulnerability scanner. Whether you’re dealing with false positives, slow database updates, or wanting deeper insights into your vulnerability data, Grype has evolved considerably.
Let’s dive into the highlights that make now a perfect time to give Grype another look.
Dramatically Fewer False Positives
One of the most common complaints we’ve heard over the years was about false positives – vulnerabilities being incorrectly flagged where they didn’t actually exist. This problem was particularly acute when scanning Java applications, where a Python package named “redis” might trigger vulnerabilities meant for the Redis database server, or where different ecosystems would cross-contaminate results.
The root cause was our reliance on CPE (Common Platform Enumeration) matching from the National Vulnerability Database. While comprehensive, CPE matching often lacked the ecosystem-specific context needed for accurate results.
The solution? We’ve fundamentally shifted our approach to prioritize the GitHub Advisory Database, which provides ecosystem-specific vulnerability data. The results speak for themselves:
- Up to 80% reduction in false positives across some ecosystems
- More accurate matching that respects package ecosystem boundaries
- Cleaner, more actionable scan results
 # Before: Multiple false positives for "redis"
 $ grype redis:latest
 ...
 CVE-2022-0543    redis    pkg:gem/[email protected]

 # After: Only legitimate vulnerabilities reported
 $ grype redis:latest
 # Clean results focused on actual Redis server vulnerabilities
Don’t worry if you still need CPE matching for specific use cases – it’s still available and configurable. But for most users, the new defaults provide dramatically better accuracy.
So, while not completely solved, we’re another step closer to nirvana.
Database Revolution: Faster, Smaller, Smarter
Behind the scenes, we’ve completely reimagined how Grype stores and accesses vulnerability data with our move from database schema v5 to v6. This isn’t just a version bump – it’s a fundamental architectural improvement.
The numbers tell the story:
| Metric | Schema v5 | Schema v6 | Improvement |
| Download Size | 210 MB | ↓ 65 MB | ↓ 69% smaller |
| On-disk DB Size | 1.6 GB | ↓ 900 MB | ↓ 44% smaller |
For your day-to-day workflow, this means:
- Faster CI/CD pipelines with quicker database updates
- Reduced bandwidth costs especially important for air-gapped environments
- Better performance on resource-constrained systems
But the improvements go beyond just size. The new schema is built around OSV (Open Source Vulnerability) standards and includes powerful new datasets:
Enhanced Intelligence with CISA KEV and EPSS
Grype now includes CISA’s Known Exploited Vulnerabilities (KEV) database and EPSS (Exploit Prediction Scoring System) data. This means you can now prioritize vulnerabilities actively exploited in the wild or have a high probability of exploitation.

This contextual information helps security teams focus their remediation efforts on the most important vulnerabilities.
The KEV and EPSS data and a vulnerability’s severity are now used to calculate a “Risk” value, presented in the Grype tabular output.

The tabular output from Grype is now sorted by the calculated “Risk” column by default.
Database Search: Your New Best Friend
One of the most powerful additions to Grype is the enhanced database search functionality. Previously, investigating vulnerability data meant manually searching through multiple sources. Now, you can query the Grype database directly to understand what’s in there and why certain matches occur.
This is best illustrated with a few examples:
Find all vulnerabilities affecting log4j

Search for specific vulnerability details

Search for vulns in a specific package/library and ecosystem

This transparency helps with:
- Debugging unexpected results – understand exactly why a match occurred
- Security research – explore vulnerability patterns across ecosystems
- Compliance reporting – validate that your scanning covers relevant vulnerability sources
A Cast of Thousands (Well, Five): The Ecosystem Advantage
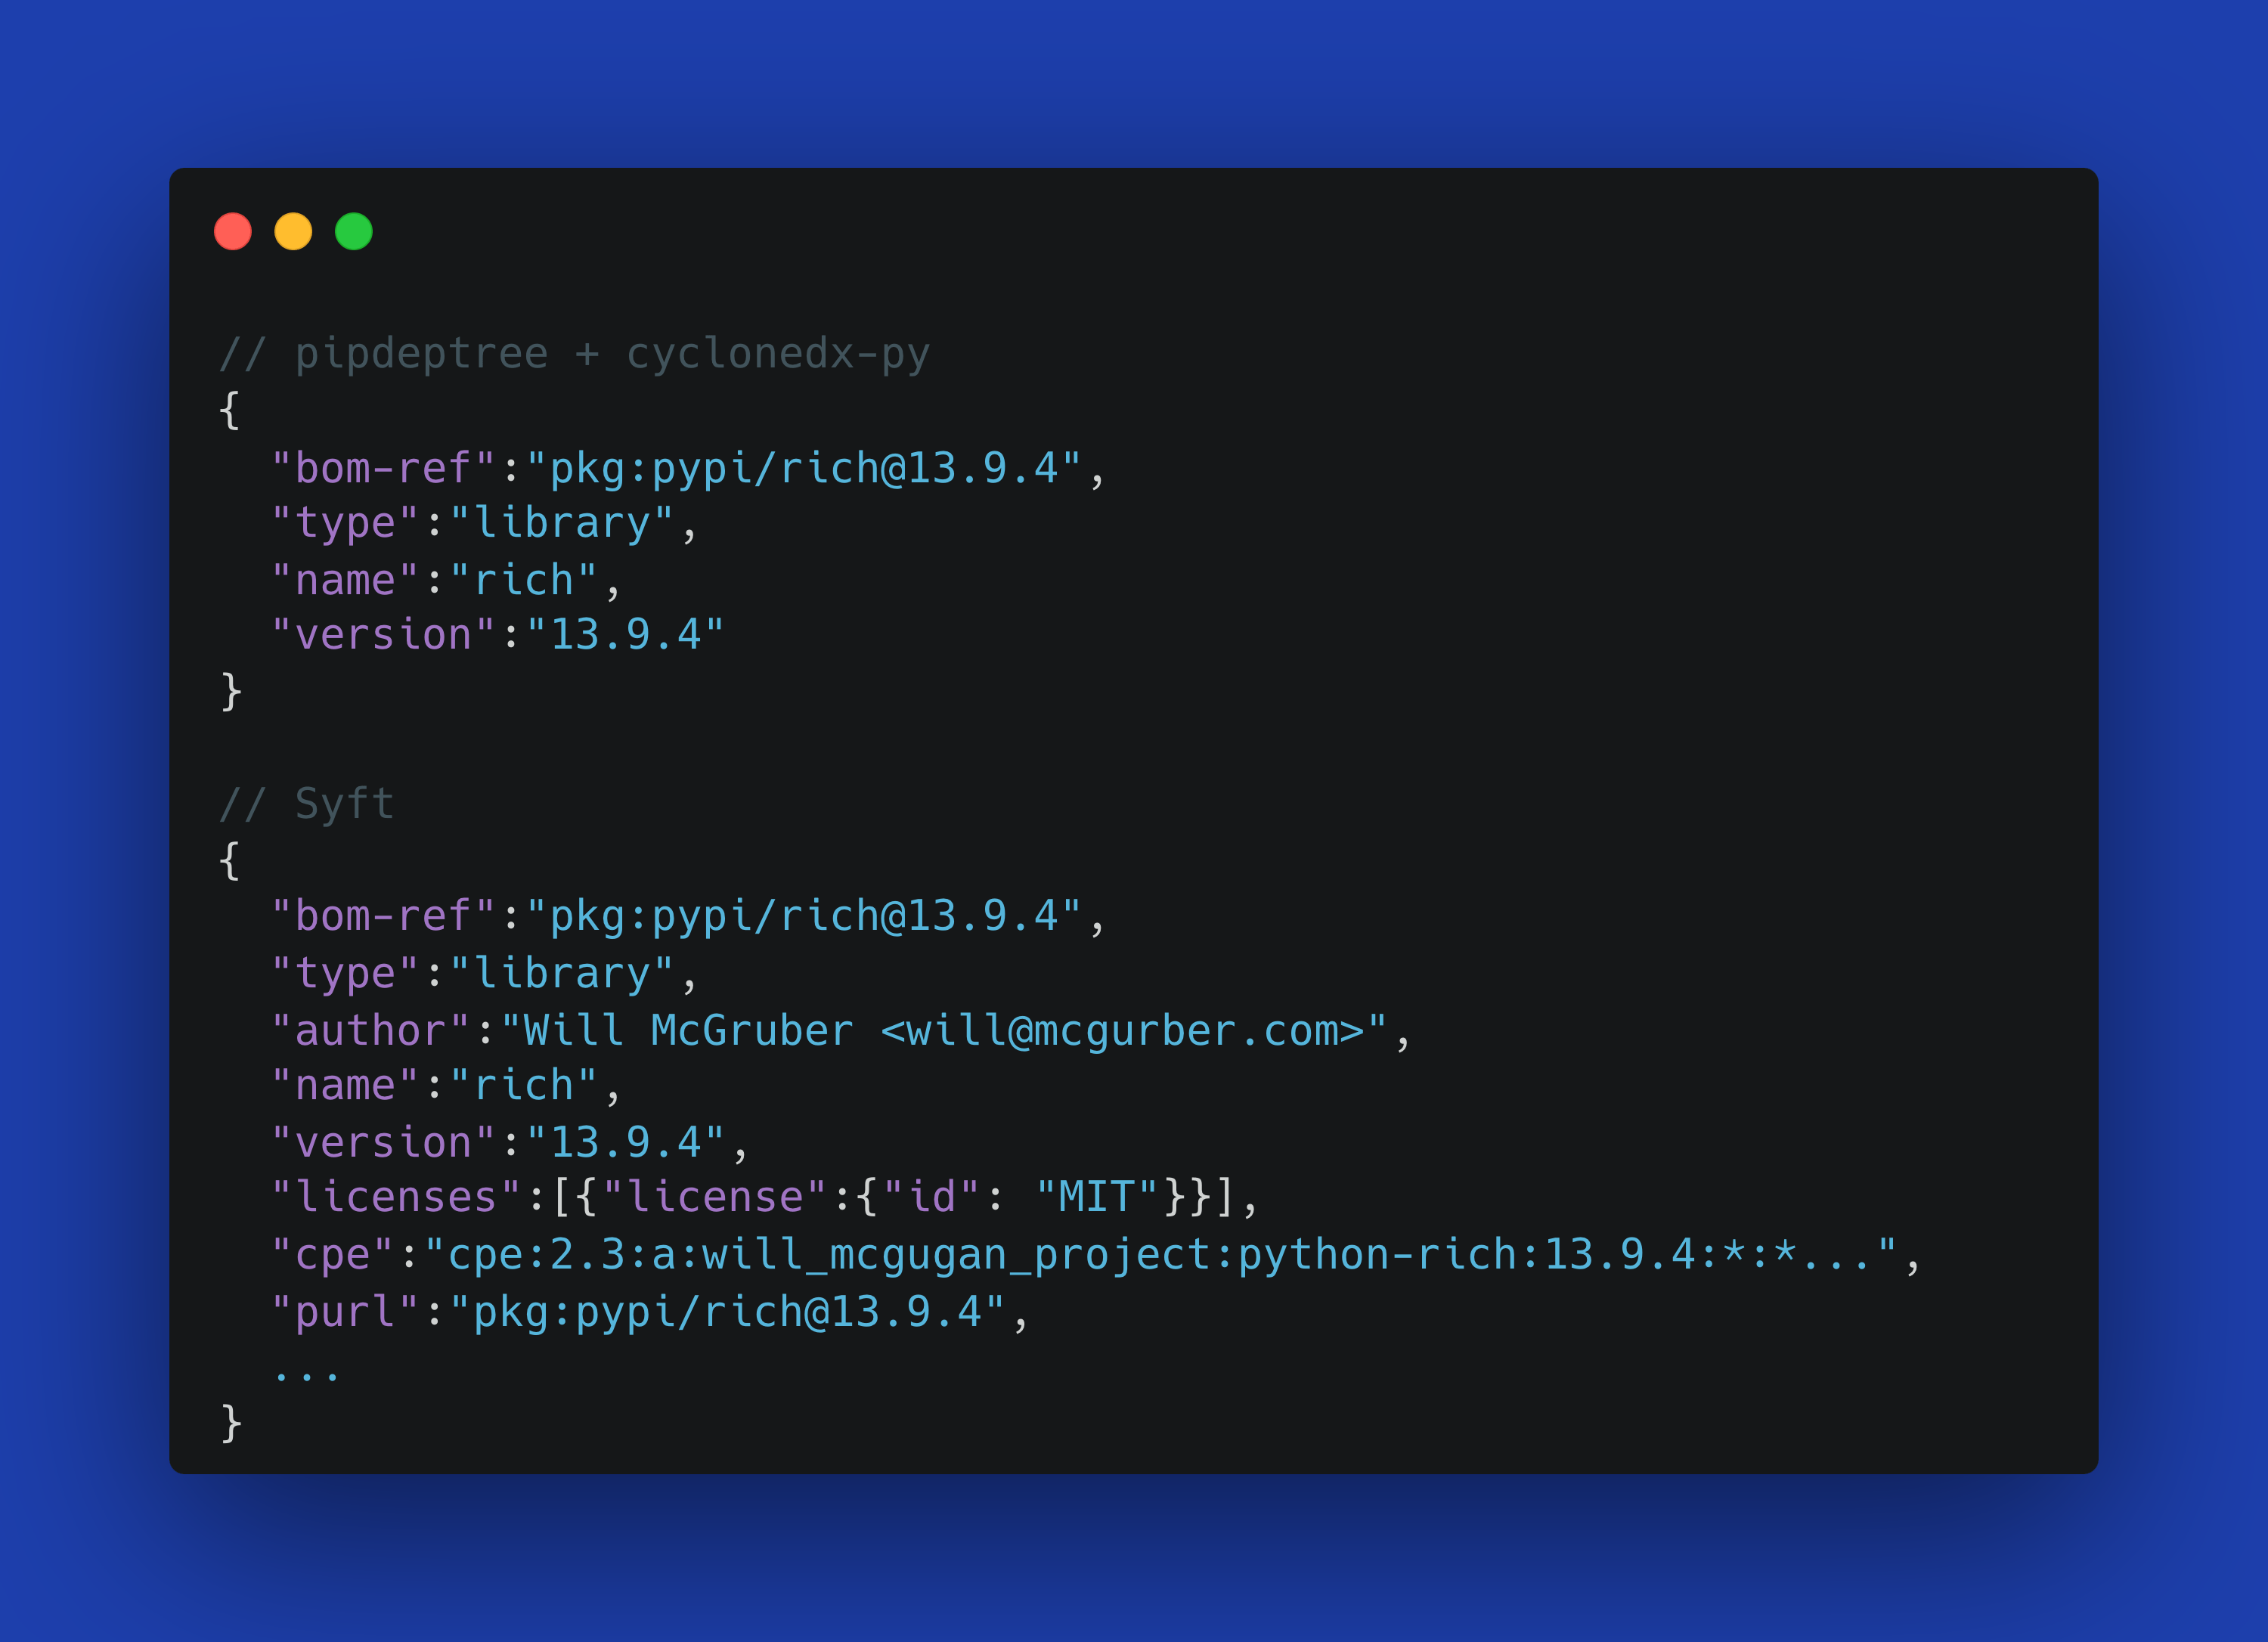
While Grype is the star of this story, its improvements are powered by advances across our entire toolchain. Syft, our SBOM generation tool, has dramatically expanded its package detection capabilities over the past year:
New Binary Detection:
- Chrome/Chromium browsers
- curl and other common utilities
- Dart language binaries
- PHP interpreters and extensions
- Haskell and OCaml binaries
Enhanced Language Support:
- Improved .NET detection with better dependency relationships
- NuGet package support
- Enhanced Java cataloging with better Maven support
- Python packaging improvements with dependency relationships
- Support for Rust cargo-auditable binaries
Better Container Analysis:
- Support for scanning Debian archives directly
- Improved handling of symlinks and complex file systems
- Better performance with large container images
This expanded detection means Grype can now find and assess vulnerabilities in a broader range of software components, giving you more comprehensive security coverage.
Configuration Profiles: Simplify Your Setup
Managing Grype configuration across different environments previously required maintaining separate config files. Now, Grype supports hierarchical configuration with profiles, making it easy to maintain different scanning policies for various environments as well as per-project exclusion lists.

PURL Support: Scan What You Know
Sometimes you don’t need to scan an entire container image – you just want to check if a specific package version has known vulnerabilities. Grype now supports direct PURL (Package URL) scanning:
Check a specific package version

Feed Grype one or more PURLs from a file

This is particularly useful for dependency checking in CI/CD pipelines or when you want to validate specific component versions.
Performance Under the Hood
Beyond the user-facing features, significant engineering work has improved Grype’s performance and reliability:
- Faster vulnerability matching with optimized database queries
- Reduced memory consumption especially when scanning large container images
- Better error handling with more informative messages when things go wrong
The Road Ahead
The past year has established a solid foundation for Grype’s future. With the new database architecture in place, we can more rapidly integrate new vulnerability sources and provide richer context about security issues.
Key areas we’re continuing to develop include:
- Enhanced support for emerging package ecosystems
- Better integration with vulnerability management workflows
- More sophisticated vulnerability prioritization
- Expanded scanning capabilities for different artifact types
Try It Today
If you’re already using Grype, updating to the latest version will automatically give you these improvements. If you’re new to Grype or haven’t tried it recently, installation is straightforward, from brew or using our installer.
Install and run Grype

For CI/CD integration, the Grype GitHub Action and Docker images make integration seamless.
Grype vs The World
Have you tested Grype recently? Maybe you’re comparing it to other tools in the market. Let us know how we got on, we would love to know. This post on our community Discourse is a great place to share your experience and give us your feedback.

I also put all the above commands in there, for easy copy/paste-ability!
Get Involved
Grype is open source, and community contributions have been essential to these improvements. Whether you’re reporting bugs, suggesting features, or contributing code, there are multiple ways to get involved:
- GitHub: anchore/grype for issues and contributions
- Community: Join our Discourse community for discussions and support, and let us know how you get on!
- Newsletter: Sign up for our community newsletter for updates
The past year has shown that security scanning becomes a force multiplier rather than a bottleneck when tooling gets out of the way and provides accurate, actionable results. Grype’s evolution continues to focus on this goal: giving you the information you need to secure your software supply chain without the noise.
Give it another look – you might be surprised by how much has changed!