Anchore’s Vice President of Security, Josh Bressers recently did an interview with Fed Gov Today about the role of automation in DevSecOps and how it is impacting the US federal government. We’ve condensed the highlights of the interview into a snackable blog post below.
Automation is the foundation of DevSecOps
Automation isn’t just a buzzword but is actually the foundation of DevSecOps. It is what gives meaning to marketing taglines like “shift left”. The point of DevSecOps is to create automated workflows that provide feedback to software developers as they are writing the application. This unwinds the previous practice of artificially grouping all of the “compliance” or “security” tasks into large blocks at the end of the development process. The challenge with this pattern is that it delays feedback and design decisions are made that become difficult to undo after development has completed. By inverting the narrative and automating feedback as design decisions are made, developers are able to prevent compliance or security issues before they become deeply embedded into the software.
DoD Software Factories are leading the way in DevSecOps adoption
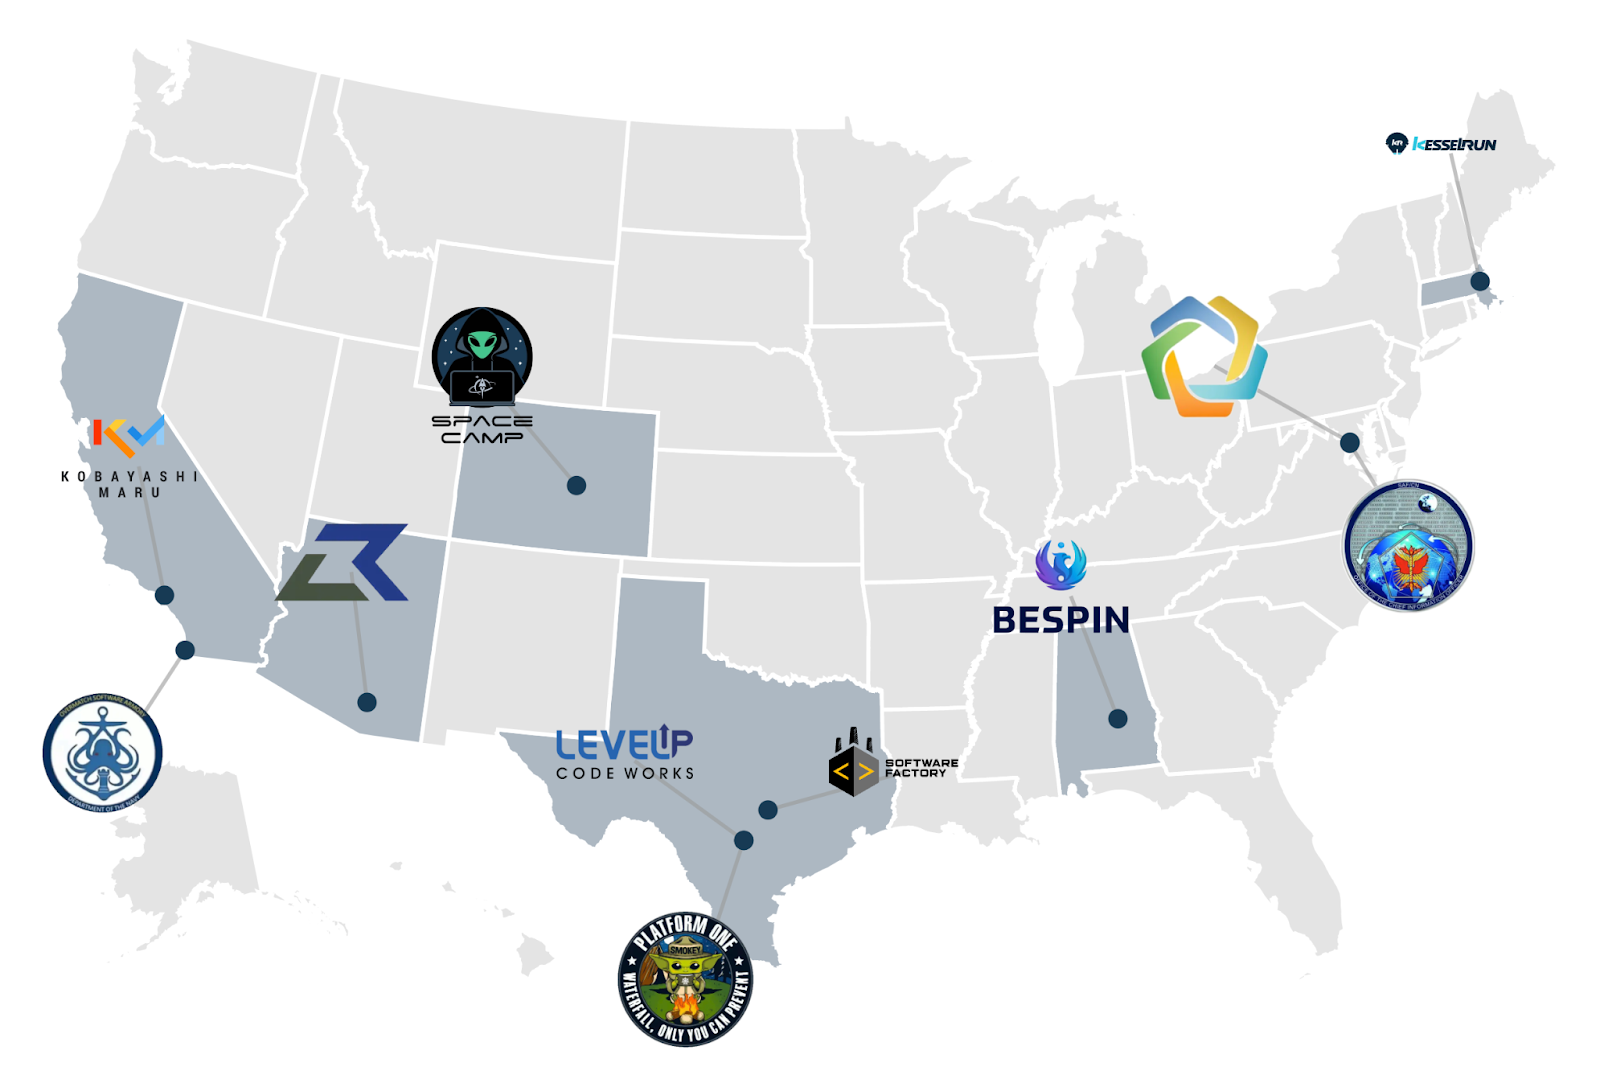
The US Department of Defense (DoD) is at the forefront of implementing DevSecOps through their DoD software factory model. The US Navy’s Black Pearl and the Air Force’s Platform One are perfect examples of this program. These organizations are leveraging automation to streamline compliance work. Instead of relying on manual documentation ahead of Authority to Operate (ATO) reviews, automated workflows built directly into the software development pipeline provide direct feedback to developers. This approach has proven highly effective, Bressers emphasizes this in his interview:
It’s obvious why the DoD software factory model is catching on. It’s because they work. It’s not just talk, it’s actually working. There’s many organizations that have been talking about DevSecOps for a long time. There’s a difference between talking and doing. Software factories are doing and it’s amazing.
—Josh Bressers, VP of Security, Anchore
Benefits of compliance automation
By giving compliance the same treatment as security (i.e., automate all the things), tasks that once took weeks or even months, can now be completed in minutes or hours. This dramatic reduction in time-to-compliance not only accelerates development cycles but also allows teams to focus on collaboration and solution delivery rather than getting bogged down in procedural details. The result is a “shift left” approach that extends beyond security to compliance as well. When compliance is integrated early in the development process the benefits cascade down the entire development waterfall.
Compliance automation is shifting the policy checks left into the software development process. What this means is that once your application is finished; instead of the compliance taking weeks or months, we’re talking hours or minutes.
—Josh Bressers, VP of Security, Anchore
Areas for improvement
While automation is crucial, there are still several areas for improvement in DevSecOps environments. Key focus areas include ensuring developers fully understand the automated processes, improving communication between team members and agencies, and striking the right balance between automation and human oversight. Bressers emphasizes the importance of letting “people do people things” while leveraging computers for tasks they excel at. This approach fosters genuine collaboration and allows teams to focus on meaningful work rather than simply checking boxes to meet compliance requirements.
Standardizing communication workflows with integrated developer tools
Software development pipelines are primarily platforms to coordinate the work of distributed teams of developers. They act like old-fashioned switchboard operators that connect one member of the development team to the next as they hand-off work in the development production line. Leveraging developer tooling like GitLab or GitHub standardizes communication workflows. These platforms provide mechanisms for different team members to interact across various stages of the development pipeline. Teams can easily file and track issues, automatically pass or fail tests (e.g., compliance tests), and maintain a searchable record of discussions. This approach facilitates better understanding between developers and those identifying issues, leading to more efficient problem-solving and collaboration.
The government getting ahead of the private sector: an unexpected narrative inversion
In a surprising turn of events, Bressers points out that government agencies are now leading the way in DevSecOps implementation by integrating automated compliance. Historically often seen as technologically behind, federal agencies, through the DoD software factory model, are setting new standards that are likely to influence the private sector. As these practices become more widespread, contractors and private companies working with the government will need to adapt to these new requirements. This shift is evident in recent initiatives like the SSDF attestation questionnaire and White House Executive Order (EO) 14028. These initiatives are setting new expectations for federal contractors, signaling a broader move towards making compliance a native pillar of DevSecOps.
This is one of the few instances in recent memory where the government is truly leading the way. Historically the government has often been the butt of jokes about being behind in technology but these DoD software factories are absolutely amazing. The next thing that we’re going to see is the compliance expectations that are being built into these DoD software factories will seep out into the private sector. The SSDF attestation and the White House Executive Order are only the beginning. Ironically my expectation is everyone is going to have to start paying attention to this, not just federal agencies.
Achieve container vulnerability scanning nirvana in your CI pipeline with Anchore Enterprise and your preferred CI platform, whether it’s GitHub, GitLab, or Jenkins. Identifying vulnerabilities, security issues, and compliance policy failures early in the software development process is crucial. It’s certainly preferable to uncover these issues during development rather than having them discovered by a customer or during an external audit.
Early detection of vulnerabilities ensures that security and compliance are integrated into your development workflow, reducing the risk of breaches and compliance violations. This proactive approach not only protects your software but also saves time and resources by addressing issues before they escalate.
Enabling CI Integration
At a high level, the steps to connect any CI platform to Enterprise are broadly the same, with implementation details differing between each vendor.
Enable network connectivity between CI and Enterprise
Craft an automation script to operate after the build process
Install AnchoreCTL
Capture built container details
Use AnchoreCTL to submit container details to Enterprise
Once SBOM generation is integrated into the CI pipeline, and they’re submitted to Anchore Enterprise, the following features can quickly be leveraged:
Known vulnerabilities with severity, and fix availability
Search for accidental ‘secrets’ sharing such as private API keys
Scan for malware like trojans and viruses
Policy enforcement to comply with standards like FedRAMP, CISA and DISA
Remediation by notifying developers and other agents via standard tools like GitHub issues, JIRA, and Slack
Scheduled reporting on container insights
CI Integration by Example
Taking GitHub Actions as an example, we can outline the requirements and settings to get up and running with automated SBOM generation and vulnerability management.
Network connectivity
AnchoreCTL uses port 8228 for communication with the Anchore Enterprise SBOM ingest and management API. Ensure the Anchore Enterprise host, where this is configured, is accessible on that port from GitHub. This is site specific and may require firewall, VLAN and other site-specific changes.
Required configuration
AnchoreCTL requires only three environment variables, typically set as GitHub secrets.
ANCHORECTL_URL – the URL of the Anchore Enterprise API endpoint. e.g. http://anchore-enterprise.example.com:8228
ANCHORECTL_USERNAME – the user account in Anchore Enterprise, that the anchorectl will authenticate using
ANCHORECTL_PASSWORD – the password for the account, set on the Anchore Enterprise instance
On the GitHub repository go to Settings -> Secrets and Variables -> Actions.
Under the ‘Variables’ tab, add ANCHORECTL_URL & ANCHORECTL_USERNAME, and set their values. In the ‘Secrets’ tab, add ANCHORECTL_PASSWORD and set the value.
Automation script
Below are the sample snippets from a GitHub action that should be placed in the repository under .github/workflows to enable SBOM generation in Anchore Enterprise. In this example,
First, our action needs a name:
name: Anchore Enterprise Centralized Scan
Pick one or more from this next section, depending on when you require the action to be triggered. It could be based on pushes to the main or other named branches, on a timed schedule, or manually.
Commonly when configuring an action for the first time, manual triggering is used until proven working, then timed or branch automation is enabled later.
on:## Action runs on a push the branches listedpush:branches: - main## Action runs on a regular scheduleschedule: ## Run at midnight every day - cron: '0 0 * * *'## Action runs on demand buildworkflow_dispatch:inputs:mode:description: 'On-Demand Build'
In the env section we pass in the settings gathered and configured inside the GitHub web UI earlier. Additionally the optional ANCHORECTL_FAIL_BASED_ON_RESULTS boolean defines (if true) whether we want the the entire action to be failed based on scan results. This may be desirable, to block further processing if any vulnerabilities, secrets or malware are identified.
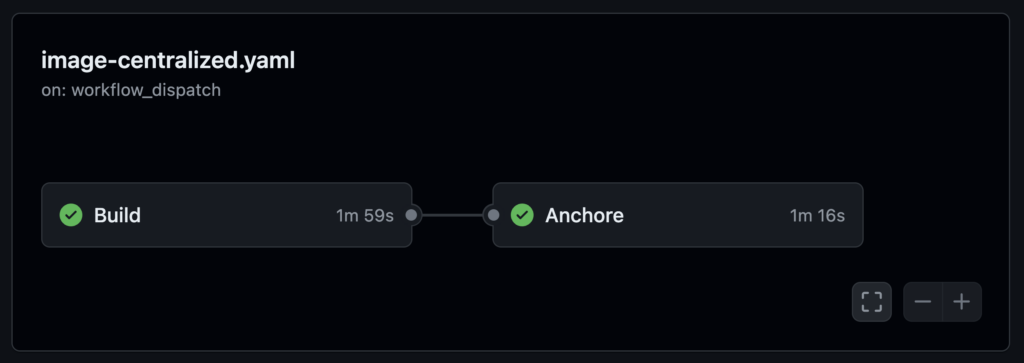
Now we start the actual body of the action, which comprises two jobs, ‘Build’ and ‘Anchore’. The ‘Build’ example here will use externally defined steps to checkout the code in the repo and build a container using docker, then push the resulting image to the container registry. In this case we build and publish to the GitHub Container Registry (ghcr), however, we could publish elsewhere.
jobs:Build:runs-on: ubuntu-lateststeps: - name: "Set IMAGE environmental variables"run: | echo "IMAGE=${REGISTRY}/${GITHUB_REPOSITORY}:${GITHUB_REF_NAME}" >> $GITHUB_ENV - name: Checkout Codeuses: actions/checkout@v3 - name: Log in to the Container registryuses: docker/login-action@v2with:registry: ${{ env.REGISTRY }}username: ${{ github.actor }}password: ${{ secrets.GITHUB_TOKEN }} - name: Set up Docker Buildxuses: docker/setup-buildx-action@v2 - name: build local containeruses: docker/build-push-action@v3with:tags: ${{ env.IMAGE }}push: trueload: false
The next job actually generates the SBOM, let’s break this down. First, the usualy boilerplate, but note this job depends on the previous ‘Build’ job having already run.
Anchore:runs-on: ubuntu-latestneeds: Buildsteps:
The same registry settings are used here as were used in the ‘Build’ job above, then we checkout the code onto the action runner. The IMAGE variable will be used by the anchorectl command later to submit into Anchore Enterprise.
Installing the AnchoreCTL binary inside the action runner is required to send the request to the Anchore Enterprise API. Note the version number specified as the past parameter, should match the version of Enterprise.
The Connectivity check is a good way to ensure anchorectl is installed correctly, and configured to connect to the right Anchore Enterprise instance.
- name: Connectivity Checkrun: | anchorectl version anchorectl system status anchorectl feed list
Now we actually queue the image up for scanning by our Enterprise instance. Note the use of --wait to ensure the GitHub Action pauses until the backend Enterprise instance completes the scan. Otherwise the next steps would likely fail, as the scan would not yet be complete.
- name: Queue Image for Scanning by Anchore Enterpriserun: | anchorectl image add --no-auto-subscribe --wait --dockerfile ./Dockerfile --force ${IMAGE}
Once the backend Anchore Enterprise has completed the vulnerability, malware, and secrets scan, we use anchorectl to pull the list of vulnerabilities and display them as a table. This can be viewed in the GitHub Action log, if required.
Finally, the image check will pull down the results of the policy compliance as defined in your Anchore Enterprise. This will likely be a significantly shorter output than the full vulnerability list, depending on your policy bundle.
If the environment variable ANCHORECTL_FAIL_BASED_ON_RESULTS was set true earlier in the action, or -f is added to the command below, the action will return as a ‘failed’ run.
That’s everything. If configured correctly, the action will run as required, and directly leverage the vulnerability, malware and secrets scanning of Anchore Enterprise.
Not just GitHub
While the example above is clearly GitHub specific, a similar configuration can be used in GitLab pipelines, Jenkins, or indeed any CI system that supports arbitrary shell scripts in automation.
Conclusion
By integrating Anchore Enterprise into your CI pipeline, you can achieve a higher level of security and compliance for your software development process. Automating vulnerability scanning and SBOM management ensures that your software is secure, compliant, and ready for deployment.
Automate your SBOM management with Anchore Enterprise. Get instant access with a 15-day free trial.
The Iron Bank provides Platform One and any US Department of Defense (DoD) agency with a hardened and centralized container image repository that supports the end-to-end lifecycle needed for secure software development. Anchore and the Iron Bank have been collaborating since 2020 to balance deployment velocity, and policy compliance while maintaining rigorous security standards and adapting to new security threats.
The Challenge
The Iron Bank development team is responsible for the integrity and security of 1,800 base images that are provided to build and create software applications across the DoD. They face difficult tasks such as:
Providing hardened components for downstream applications across the DoD
Meeting rigorous security standards crucial for military systems
Improving deployment frequency while maintaining policy compliance
Camdon Cady, Chief Technology Officer at Platform One:
People want to be security minded, and they want to do the right thing. But what they really want is tooling that helps them to do that with all the necessary information in one place. That’s why we looked to Anchore for help.
The Solution
Anchore’s engineering team is deeply embedded with the Iron Bank infrastructure and development team to improve and maintain DevSecOps standards. Anchore Enterprise is the software supply chain security tool of choice as it provides:
The partnership between Iron Bank and Anchore has yielded impressive results:
Reduced False Positives: The introduction of an exclusion feed captured over 12,000 known false positives, significantly reducing the security assessment load.
Improved SBOM Accuracy: Custom capabilities like SBOM Hints and SBOM Corrections allow for more precise component identification and vulnerability mapping.
Enhanced Scanning Capabilities: Additions like time-based allowlisting, content hints, and image scanning have expanded Iron Bank’s security coverage.
Streamlined Processes: The standardized scanning process adheres to the DoD’s Container Hardening Guide while delivering high-quality vulnerability and compliance findings.
Even though security is important for all organizations, the stakes are higher for the DoD. What we need is a repeatable development process. It’s imperative that we have a standardized way of building secure software across our military agencies.
Camdon Cady, Chief Technology Officer at Platform One
Download the full case study to learn more about how Anchore Enterprise can help your organization achieve a proactive security stance while maintaining development velocity.
In today’s fast-paced software development world, maintaining the highest levels of security and compliance is a daunting challenge. Our new case study highlights how Infoblox, a leader in Enterprise DDI (DNS, DHCP, IPAM), successfully scaled their product security and compliance efforts using Anchore Enterprise. Let’s dive into their journey and the impressive results they achieved.
The Challenge: Scaling security in high-velocity Environments
Infoblox faced several critical challenges in their product security efforts:
Implementing “shift-left” security at scale for 150 applications developed by over 600 engineers with a security team of 15 (a 40:1 ratio!)
Managing vulnerabilities across thousands of containers produced monthly
Maintaining multiple compliance certifications (FedRAMP, SOC 2, StateRAMP, ISO 27001)
Integrating seamlessly into existing DevOps workflows
“When I first started, I was manually searching GitHub repos for references to vulnerable libraries,” recalls Sukhmani Sandhu, Product Security Engineer at Infoblox. This manual approach was unsustainable and prone to errors.
The Solution: Anchore Enterprise
To address these challenges, Infoblox turned to Anchore Enterprise to provide:
Native integrations with Amazon EKS, Harbor, and Jenkins CI
A FedRAMP, SOC 2, StateRAMP, and ISO compliant platform
Chris Wallace, Product Security Engineering Manager at Infoblox, emphasizes the importance of accuracy: “We’re not trying to waste our team or other team’s time. We don’t want to report vulnerabilities that don’t exist. A low false-positive rate is paramount.“
Impressive Results
The implementation of Anchore Enterprise transformed Infoblox’s product security program:
75% reduction in time for manual vulnerability detection tasks
55% reduction in hours allocated to retroactive vulnerability remediation
60% reduction in hours spent on compliance tasks
Empowered the product security team to adopt a proactive, “shift-left” security posture
These improvements allowed the Infoblox team to focus on higher-value initiatives like automating policy and remediation. Developers even began self-adopting scanning tools during development, catching vulnerabilities before they entered the build pipeline.
“We effectively had no tooling before Anchore. Everything was manual. We reduced the amount of time on vulnerability detection tasks by 75%,” says Chris Wallace.
Conclusion: Scaling security without compromise
Infoblox’s success story demonstrates that it’s possible to scale product security and compliance efforts without compromising on development speed or accuracy. By leveraging Anchore Enterprise, they transformed their security posture from reactive to proactive, significantly reduced manual efforts, and maintained critical compliance certifications.
Are you facing similar challenges in your organization? Download the full case study and take the first step towards a secure, compliant, and efficient development environment. Or learn more about how Anchore’s container security platform can help your organization.
In the rapidly evolving landscape of national defense and cybersecurity, the concept of a Department of Defense (DoD) software factory has emerged as a cornerstone of innovation and security. These software factories represent an integration of the principles and practices found within the DevSecOps movement, tailored to meet the unique security requirements of the DoD and Defense Industrial Base (DIB).
By fostering an environment that emphasizes continuous monitoring, automation, and cyber resilience, DoD Software Factories are at the forefront of the United States Government’s push towards modernizing its software and cybersecurity capabilities. This initiative not only aims to enhance the velocity of software development but also ensures that these advancements are achieved without compromising on security, even against the backdrop of an increasingly sophisticated threat landscape.
Building and running a DoD software factory is so central to the future of software development that “Establish a Software Factory” is the one of the explicitly named plays from the DoD DevSecOps Playbook. On top of that, the compliance capstone of the authorization to operate (ATO) or its DevSecOps infused cousin the continuous ATO (cATO) effectively require a software factory in order to meet the requirements of the standard. In this blog post, we’ll break down the concept of a DoD software factory and a high-level overview of the components that make up one.
A Department of Defense (DoD) Software Factory is a software development pipeline that embodies the principles and tools of the larger DevSecOps movement with a few choice modifications that conform to the extremely high threat profile of the DoD and DIB. It is part of the larger software and cybersecurity modernization trend that has been a central focus for the United States Government in the last two decades.
The goal of a DoD Software Factory is aimed at creating an ecosystem that enables continuous delivery of secure software that meet the needs of end-users while ensuring cyber resilience (a DoD catchphrase that emphasizes the transition from point-in-time security compliance to continuous security compliance). In other words, the goal is to leverage automation of software security tasks in order to fulfill the promise of the DevSecOps movement to increase the velocity of software development.
What is an example of a DoD software factory?
Platform One is the canonical example of a DoD software factory. Run by the US Air Force, it offers both a comprehensive portfolio of software development tools and services. It has come to prominence due to its hosted services like Repo One for source code hosting and collaborative development, Big Bang for a end-to-end DevSecOps CI/CD platform and the Iron Bank for centralized container storage (i.e., container registry). These services have led the way to demonstrating that the principles of DevSecOps can be integrated into mission critical systems while still preserving the highest levels of security to protect the most classified information.
Any organization that works with the DoD as a federal service integrator will want to be intimately familiar with DoD software factories as they will either have to build on top of existing software factories or, if the mission/program wants to have full control over their software factory, be able to build their own for the agency.
Department of Defense (DoD) Mission
Any Department of Defense (DoD) mission will need to be well-versed on DoD software factories as all of their software and systems will be required to run on a software factory as well as both reach and maintain a cATO.
What are the components of a DoD Software Factory?
A DoD software factory is composed of both high-level principles and specific technologies that meet these principles. Below are a list of some of the most significant principles of a DoD software factory:
Principles of DevSecOps embedded into a DoD software factory
Breakdown organizational silos
This principle is borrowed directly from the DevSecOps movement, specifically the DoD aims to integrate software development, test, deployment, security and operations into a single culture with the organization.
Open source and reusable code
Composable software building blocks is another principle of the DevSecOps that increases productivity and reduces security implementation errors from developers writing secure software packages that they are not experts in.
Immutable Infrastructure-as-Code (IaC)
This principle focuses on treating the infrastructure that software runs on as ephemeral and managed via configuration rather than manual systems operations. Enabled by cloud computing (i.e., hardware virtualization) this principle increases the security of the underlying infrastructure through templated secure-by-design defaults and reliability of software as all infrastructure has to be designed to fail at any moment.
Microservices architecture (via containers)
Microservices are a design pattern that creates smaller software services that can be built and scale independently of each other. This principle allows for less complex software that only performs a limited set of behavior.
Shift Left
Shift left is the DevSecOps principle that re-frames when and how security testing is done in the software development lifecycle. The goal is to begin security testing while software is being written and tested rather than after the software is “complete”. This prevents insecure practices from cascading into significant issues right as software is ready to be deployed.
Continuous improvement through key capabilities
The principle of continuous improvement is a primary characteristic of the DevSecOps ethos but the specific key capabilities that are defined in the DoD DevSecOps playbook are what make this unique to the DoD.
Define a DevSecOps pipeline
A DevSecOps pipeline is the system that utilizes all of the preceding principles in order to create the continuously improving security outcomes that is the goal of the DoD software factory program.
Cyber resilience
Cyber resiliency is the goal of a DoD software factory, is it defined as, “the ability to anticipate, withstand, recover from, and adapt to adverse conditions, stresses, attacks, or compromises on the systems that include cyber resources.”
Common tools and systems of a DoD software factory
Code Repository (e.g., Repo One)
Where software source code is stored, managed and collaborated on.
CI/CD Build Pipeline (e.g., Big Bang)
The system that automates the creation of software build artifacts, tests the software and packages the software for deployment.
Artifact Repository (e.g., Iron Bank)
The storage system for software components used in development and the finished software artifacts that are produced from the build process.
Runtime Orchestrator and Platform (e.g., Big Bang)
The deployment system that hosts the software artifacts pulled from the registry and keeps the software running so that users can access it.
How do I meet the security requirements for a DoD Software Factory? (Best Practices)
Use a pre-existing software factory
The benefit of using a pre-existing DoD software factory is the same as using a public cloud provider; someone else manages the infrastructure and systems. What you lose is the ability to highly customize your infrastructure to your specific needs. What you gain is the simplicity of only having to write software and allow others with specialized skill sets to deal with the work of building and maintaining the software infrastructure. When you are a car manufacturer, you don’t also want to be a civil engineering firm that designs roads.
If you need the flexibility and customization of managing your own software factory then we’d recommend following the DoD Enterprise DevSecOps Reference Design as the base framework. There are a few software supply chain security recommendations that we would make in order to ensure that things go smoothly during the authorization to operate (ATO) process:
Continuous vulnerability scanning across all stages of CI/CD pipeline
Use a cloud-native vulnerability scanner that can be directly integrated into your CI/CD pipeline and called automatically during each phase of the SDLC
Automated policy checks to enforce requirements and achieve ATO
Use a cloud-native policy engine in tandem with your vulnerability scanner in order to automate the reporting and blocking of software that is a security threat and a compliance risk
Remediation feedback
Use a cloud-native policy engine that can provide automated remediation feedback to developers in order to maintain a high velocity of software development
Compliance (Trust but Verify)
Use a reporting system that can be directly integrated with your CI/CD pipeline to create and collect the compliance artifacts that can prove compliance with DoD frameworks (e.g., CMMC and cATO)
Is a software factory required in order to achieve cATO?
Technically, no. Effectively, yes. A cATO requires that your software is deployed on an Approved DoD Enterprise DevSecOps Reference Design not a software factory specifically. If you build your own DevSecOps platform that meets the criteria for the reference design then you have effectively rolled your own software factory.
How Anchore can help
The easiest and most effective method for achieving the security guarantees that a software factory is required to meet for its software supply chain are by using:
DoD software factories can come off as intimidating at first but hopefully we have broken them down into a more digestible form. At their core they reflect the best of the DevSecOps movement with specific adaptations that are relevant to the extreme threat environment that the DoD has to operate in, as well as, the intersecting trend of the modernization of federal security compliance standards.
If you’re looking to dive deeper into all things DoD software factory, we have a white paper that lays out the 6 best practices for container images in highly secure environments. Download the white paper below.
Welcome to the beginners guide to AnchoreCTL, a powerful command-line tool designed for seamless interaction with Anchore Enterprise via the Anchore API. Whether you’re wrangling SBOMs, managing Kubernetes runtime inventories, or ensuring compliance at scale, AnchoreCTL is your go-to companion.
Overview
AnchoreCTL enables you to efficiently manage and inspect all aspects of your Anchore Enterprise deployments. It serves both as a human-readable configuration tool and a CLI for automation in CI/CD environments, making it indispensable for DevOps, security engineers, and developers.
If you’re familiar with Syft and Grype, AnchoreCTL will be a valuable addition to your toolkit. It offers enhanced capabilities to manage tens, hundreds, or even thousands of images and applications across your organization.
In this blog series, we’ll explore top tips and practical use cases to help you leverage AnchoreCTL to its fullest potential. In this part, we’ll review the basics of getting started with AnchoreCTL. In subsequent posts, we will dive deep on container scanning, SBOM Management and Vulnerability Management.
We’ll start by getting AnchoreCTL installed and learning about its configuration and use. I’ll be using AnchoreCTL on my macOS laptop, connected to a demo of Anchore Enterprise running on another machine.
Get AnchoreCTL
AnchoreCTL is a command-line tool available for macOS, Linux and Windows. The AnchoreCTL Deployment docs cover installation and deployment in detail. Grab the release of AnchoreCTL that matches your Anchore Enterprise install.
At the time of writing, the current release of AnchoreCTL and Anchore Enterprise is v5.6.0. Both are updated on a monthly cadence, and yours may be newer or older than what we’re using here. The AnchoreCTL Release Notes contain details about the latest, and all historical releases of the utility.
You may have more than one Anchore Enterprise deployment on different releases. As AnchoreCTL is a single binary, you can install multiple versions on a system to support all the deployments in your landscape.
macOS / Linux
This following snippet will install the binary in a directory of your choosing. On my personal workstation, I use $HOME/bin, but anywhere in your $PATH is fine. Placing the application binary in /usr/local/bin/ makes sense in a shared environment.
$# Download the macOS or Linux build of anchorectl$curl-sSfL https://anchorectl-releases.anchore.io/anchorectl/install.sh | sh-s---b$HOME/binv5.6.0
Windows
The Windows install snippet grabs the zip file containing the binary. Once downloaded, unpack the zip and copy the anchorectl command somewhere appropriate.
$# Download the Windows build of anchorectl$curl-oanchorectl.ziphttps://anchorectl-releases.anchore.io/anchorectl/v5.6.0/anchorectl_5.6.0_windows_amd64.zip
Setup
Quick check
Once AnchoreCTL is installed, check it’s working with a simple anchorectl version. It should print output similar to this:
$# Show the version of the anchorectl command line tool$anchorectlversionApplication:anchorectlVersion:5.6.0SyftVersion:v1.4.1BuildDate:2024-05-27T18:28:23ZGitCommit:7c134b46b7911a5a17ba1fa5f5ffa4e3687f170bGitDescription:v5.6.0Platform:darwin/arm64GoVersion:go1.21.10Compiler:gc
Configure
The anchorectl command has a --help option that displays a lot of useful information beyond just the list of command line options reference. Below are the first 15 lines to illustrate what you should see. The actual output is over 80 lines, so we’ve snipped it down here.
$# Show the top 15 lines of the help$anchorectl--help | head-n15Usage:anchorectl [command]ApplicationConfig: (searchlocations:.anchorectl.yaml,anchorectl.yaml,.anchorectl/config.yaml,~/.anchorectl.yaml,~/anchorectl.yaml,$XDG_CONFIG_HOME/anchorectl/config.yaml)# the URL to the Anchore Enterprise API (env var: "ANCHORECTL_URL")url:""# the Anchore Enterprise username (env var: "ANCHORECTL_USERNAME")username:""# the Anchore Enterprise user's login password (env var: "ANCHORECTL_PASSWORD")
On launch, the anchorectl binary will search for a yaml configuration file in a series of locations shown in the help above. For a quick start, just create .anchorectl.yaml in your home directory, but any of the listed locations are fine.
Here is my very basic .anchorectl.yaml which has been configured with the minimum values of url, username and password to get started. I’ve pointed anchorectl at the Anchore Enterprise v5.6.0 running on my Linux laptop ‘ziggy’, using the default port, username and password. We’ll see later how we can create new accounts and users.
$# Show the basic config file$cat.anchorectl.ymlurl:"http://ziggy.local:8228"username:"admin"password:"foobar"
Config Check
The configuration can be validated with anchorectl -v. If the configuration is syntactically correct, you’ll see the online help displayed, and the command will exit with return code 0. In this example, I have truncated the lengthy anchorectl -v output.
$# Good config$cat.anchorectl.ymlurl:"http://ziggy.local:8228"username:"admin"password:"foobar"$anchorectl-v[0000] INFO anchorectlversion:5.6.0Usage: anchorectl [command]⋮ --versionversionforanchorectlUse"anchorectl [command] --help"formoreinformationaboutacommand.$echo$?0
In this example, I omitted a closing quotation mark on the url: line, to force an error.
$# Bad config$cat.anchorectl.ymlurl:"http://ziggy.local:8228username: "admin"password: "foobar"$ anchorectl -v⋮error: invalid application config: unable to parse config="/Users/alan/.anchorectl.yml": While parsing config: yaml: line 1: did not find expected key$ echo $?1
Connectivity Check
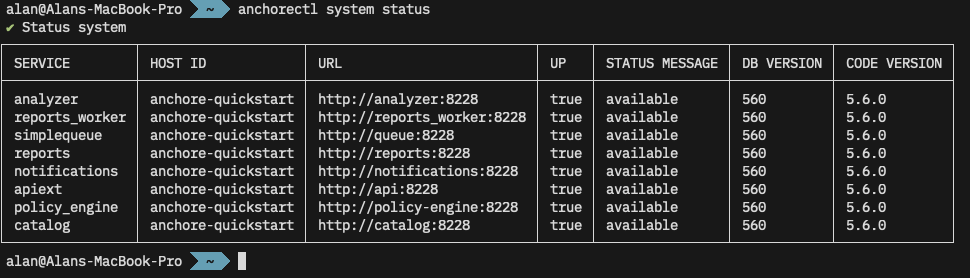
Assuming the configuration file is syntactically correct, we can now validate the correct url, username and password are set for the Anchore Enterprise system with an anchorectl system status. If all is going well, we’ll get a report similar to this:
The output of anchore system status shows the services running on my Anchore Enterprise.
Multiple Configurations
You may also use the -c or --config option to specify the path to a configuration file. This is useful if you communicate with multiple Anchore Enterprise systems.
$# Show the production configuration file$cat./production.anchore.ymlurl:"http://remotehost.anchoreservers.com:8228"username:"admin"password:"foobar"$# Show the development configuration file, which points to a diff PC$cat./development.anchore.ymlurl:"http://workstation.local:8228"username:"admin"password:"foobar"$# Connect to remote production instance$anchorectl-c./production.anchorectl.ymlsystemstatus ✔Statussystem⋮$# Connect to developer workstation$anchorectl-c./development.anchorectl.ymlsystemstatus ✔Statussystem⋮
Environment Variables
Note from the --help further up that AnchoreCTL can be configured with environment variables instead of the configuration file. This can be useful when the tool is deployed in CI/CD environments, where these can be set using the platform ‘secret storage’.
So, without any configuration file, we can issue the same command but setting options via environment variables. I’ve truncated the output below, but note the ✔ Status system indicating a successful call to the remote system.
$# Delete the configuration to prove we aren't using it$rm.anchorectl.yml$anchorectlsystemstatus ⠋error:1erroroccurred: *noenterpriseURLprovided$# Use environment variables instead$ANCHORECTL_URL="http://ziggy.local:8228"\ANCHORECTL_USERNAME="admin"\ANCHORECTL_PASSWORD="foobar"\anchorectlsystemstatus ✔Statussystem⋮
Of course, in a CI/CD environment such as GitHub, GitLab, or Jenkins, these environment variables would be set in a secure store and only set up as the job running anchorectl it initiated.
Users
Viewing Accounts & Users
In the examples above, I’ve been using the default username and password for a demo Anchore Enterprise instance. AnchoreCTL can be used to query and manage the system’s accounts and users. Documentation for these activities can be found in the user management section of the docs.
$# Show list of accounts on the remote instance$anchorectlaccountlist ✔Fetchedaccounts┌───────┬─────────────────┬─────────┐│NAME │EMAIL│STATE│├───────┼─────────────────┼─────────┤│admin│admin@myanchore│enabled│└───────┴─────────────────┴─────────┘
We can also list existing users on the system:
$# Show list of users (if any) in the admin account$anchorectluserlist--accountadmin ✔Fetchedusers┌──────────┬──────────────────────┬───────────────────────┬────────┬──────────┬────────┐│USERNAME│CREATEDAT│PASSWORDLASTUPDATED│TYPE│IDPNAME│SOURCE│├──────────┼──────────────────────┼───────────────────────┼────────┼──────────┼────────┤│admin │2024-06-10T11:48:32Z│2024-06-10T11:48:32Z │native│ │ │└──────────┴──────────────────────┴───────────────────────┴────────┴──────────┴────────┘
Managing Acounts
AnchoreCTL can be used to add (account add), enable (account enable), disable (account disable) and remove (account delete) accounts from the system:
$# Create a new account$anchorectlaccountadddev_team_alpha ✔AddedaccountName:dev_team_alphaEmail:State:enabled$# Get a list of accounts$anchorectlaccountlist ✔Fetchedaccounts┌────────────────┬─────────────────┬─────────┐│NAME│EMAIL│STATE│├────────────────┼─────────────────┼─────────┤│admin │admin@myanchore│enabled││dev_team_alpha││enabled││dev_team_beta││enabled│└────────────────┴─────────────────┴─────────┘$# Disable an account before deleting it$anchorectlaccountdisabledev_team_alpha ✔DisabledaccountState:disabled$# Delete the account$anchorectlaccountdeletedev_team_alpha ✔DeletedaccountNoresults$# Get a list of accounts$ anchorectlaccountlist ✔Fetchedaccounts┌────────────────┬─────────────────┬──────────┐│NAME│EMAIL│STATE │├────────────────┼─────────────────┼──────────┤│admin │admin@myanchore│enabled ││dev_team_alpha││deleting││dev_team_beta││enabled│└────────────────┴─────────────────┴──────────┘
Managing Users
Users exist within accounts, but usernames are globally unique since they are used for authenticating API requests. Any user in the admin account can perform user management in the default Anchore Enterprise configuration using the native authorizer.
For more information on configuring other authorization plugins, see Authorization Plugins and Configuration in our documentation.
Users can also be managed via AnchoreCTL. Here we create a new dev_admin_beta user under the dev_team_beta account and give then the role full-control as an administrator of the team. We’ll set a password of CorrectHorseBatteryStable for the admin user, but pass that via the environment rather than echo it out in the command line.
$# Create a new user from the dev_team_beta account$ANCHORECTL_USER_PASSWORD=CorrectHorseBatteryStable\anchorectluseradd--accountdev_team_betadev_admin_beta\--rolefull-control ✔Addeduser dev_admin_betaUsername:dev_admin_betaCreatedAt:2024-06-12T10:25:23ZPasswordLastUpdated:2024-06-12T10:25:23ZType:nativeIDPName:Source:
Let’s check that worked:
$# Check that the new user was created$anchorectluserlist--accountdev_team_beta ✔Fetchedusers┌────────────────┬──────────────────────┬───────────────────────┬────────┬──────────┬────────┐│USERNAME│CREATEDAT│PASSWORDLASTUPDATED│TYPE│IDPNAME│SOURCE│├────────────────┼──────────────────────┼───────────────────────┼────────┼──────────┼────────┤│dev_admin_beta│2024-06-12T10:25:23Z│2024-06-12T10:25:23Z │native│ │ │└────────────────┴──────────────────────┴───────────────────────┴────────┴──────────┴────────┘
That user is now able to use the API.
$# List users from the dev_team_beta account$ANCHORECTL_USERNAME=dev_admin_beta\ANCHORECTL_PASSWORD=CorrectHorseBatteryStable\ANCHORECTL_ACCOUNT=dev_team_beta\anchorectluserlist ✔Fetchedusers┌────────────────┬──────────────────────┬───────────────────────┬────────┬──────────┬────────┐│USERNAME│CREATEDAT│PASSWORDLASTUPDATED│TYPE│IDPNAME│SOURCE│├────────────────┼──────────────────────┼───────────────────────┼────────┼──────────┼────────┤│dev_admin_beta│2024-06-12T10:25:23Z│2024-06-12T10:25:23Z │native│ │ │└────────────────┴──────────────────────┴───────────────────────┴────────┴──────────┴────────┘
Using AnchoreCTL
We now have AnchoreCTL set-up to talk to our Anchore Enterprise, and a user other than admin to connect as let’s actually use it to scan a container. We have two options here, ‘Centralized Analysis’ and ‘Distributed Analysis’.
In Centralized Analysis, any container we request will be downloaded and analyzed by our Anchore Enterprise. If we choose Distributed Analysis, the image will be analyzed by anchorectl itself. This is covered in much more detail in the Vulnerability Management section of the docs.
Currently we have no images submitted for analysis:
$# Query Enterprise to get a list of container images and their status$ANCHORECTL_USERNAME=dev_admin_beta\ANCHORECTL_PASSWORD=CorrectHorseBatteryStable\ANCHORECTL_ACCOUNT=dev_team_beta\anchorectlimagelist ✔Fetchedimages┌─────┬────────┬──────────┬────────┐│TAG│DIGEST│ANALYSIS│STATUS│├─────┼────────┼──────────┼────────┤└─────┴────────┴──────────┴────────┘
Let’s submit the latest Debian container from Dockerhub to Anchore Enterprise for analysis. The backend Anchore Enterprise deployment will then pull (download) the image, and analyze it.
$# Request that enterprise downloads and analyzes the debian:latest image$ANCHORECTL_USERNAME=dev_admin_beta\ANCHORECTL_PASSWORD=CorrectHorseBatteryStable\ANCHORECTL_ACCOUNT=dev_team_beta\anchorectlimageadddocker.io/library/debian:latest ✔AddedImage docker.io/library/debian:latest Image: status:not-analyzed (active) tag: docker.io/library/debian:latest digest:sha256:820a611dc036cb57cee7... id:7b34f2fc561c06e26d69d7a5a58...
Initially the image starts in a state of not-analyzed. Once it’s been downloaded, it’ll be queued for analysis. When the analysis begins, the status will change to analyzing after which it will change to analyzed. We can check the status with anchorectl image list.
$# Check the status of the container image we requested $ANCHORECTL_USERNAME=dev_admin_beta\ANCHORECTL_PASSWORD=CorrectHorseBatteryStable\ANCHORECTL_ACCOUNT=dev_team_beta\anchorectlimagelist ✔Fetchedimages┌─────────────────────────────────┬────────────────────────────────┬───────────┬────────┐│TAG│DIGEST│ANALYSIS │STATUS│├─────────────────────────────────┼────────────────────────────────┼───────────┼────────┤│docker.io/library/debian:latest│sha256:820a611dc036cb57cee7...│analyzing│active│└─────────────────────────────────┴────────────────────────────────┴───────────┴────────┘
After a short while, the image has been analyzed.
$# Check the status of the container image we requested $ANCHORECTL_USERNAME=dev_admin_beta\ANCHORECTL_PASSWORD=CorrectHorseBatteryStable\ANCHORECTL_ACCOUNT=dev_team_beta\anchorectlimagelist ✔Fetchedimages┌─────────────────────────────────┬────────────────────────────────┬───────────┬────────┐│TAG│DIGEST│ANALYSIS │STATUS│├─────────────────────────────────┼────────────────────────────────┼───────────┼────────┤│docker.io/library/debian:latest│sha256:820a611dc036cb57cee7...│analyzed │active│└─────────────────────────────────┴────────────────────────────────┴───────────┴────────┘
Results
Once analysis is complete, we can inspect the results, again with anchorectl.
Container contents
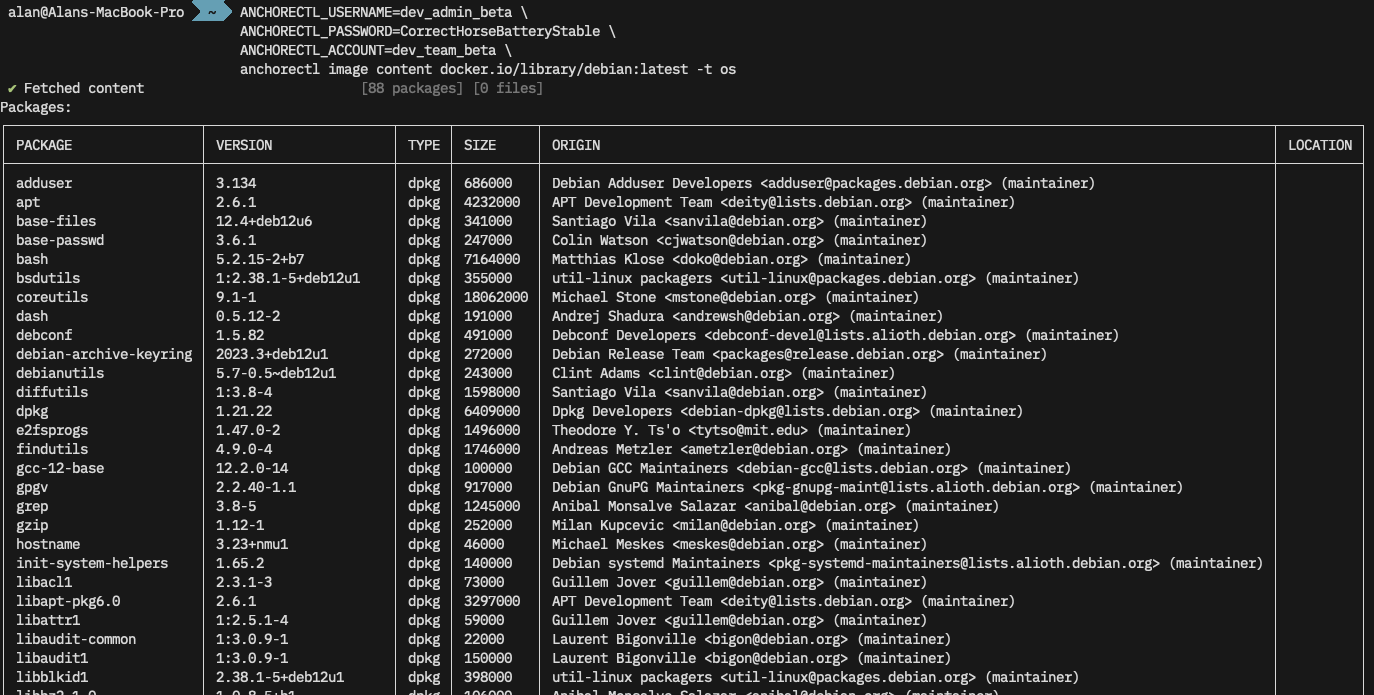
First, let’s see what Operating System packages Anchore found in this container with anchorectl image content docker.io/library/debian:latest -t os
anchorectl reporting the full OS package list from this Debian image. (the list is too large to show here)
SBOM
We can also pull the Software Bill of Materials (SBOM) for this image from Anchore with anchorectl image sbom docker.io/library/debian:latest -o table. We can use -f to write this to a file, and -o syft-json (for example) to output in a different format.
$# Get a list of OS packages in the image$ANCHORECTL_USERNAME=dev_admin_beta\ ANCHORECTL_PASSWORD=CorrectHorseBatteryStable\ANCHORECTL_ACCOUNT=dev_team_beta\anchorectlimagesbomdocker.io/library/debian:latest-otable ✔FetchedSBOM docker.io/library/debian:latestNAME VERSION TYPEadduser3.134debapt2.6.1 debbase-files 12.4+deb12u6deb⋮util-linux 2.38.1-5+deb12u1debutil-linux-extra 2.38.1-5+deb12u1debzlib1g 1:1.2.13.dfsg-1deb
Vulnerabilities
Finally let’s have a quick look to see if any OS vulnerabilities were found in this image with anchorectl image vulnerabilities docker.io/library/debian:latest -t os. This is a lot of super-wide output, click through to see the full size image.
Conclusion
So far we’ve introduced AnchoreCTL, shown it’s is easy to install, configure and test. It can be used both locally on developer workstations, and in CI/CD environments such as GitHub, GitLab and Jenkins. We’ll cover the integration of AnchoreCTL with source forges in a later post.
AnchoreCTL is a powerful tool which can be used to automate the management of scanning container contents, generating SBOMs, and analyzing for vulnerabilities.
The purpose of FedRAMP is to act as a central intermediary between federal agencies and cloud service providers (CSP) in order to make it easier for agencies to purchase software services and for CSPs to sell software services to agencies. By being the middleman, FedRAMP creates a single marketplace that reduces the amount of time it takes for an agency to select and purchase a product. From the CSP perspective, FedRAMP becomes a single standard that they can target for compliance and after achieving authorization they get access to 200+ agencies that they can sell to—a win-win.
Unfortunately, that promised land wasn’t the typical experience for either side of the exchange. Since FedRAMP’s inception in 2011, the demand for cloud services has increased significantly. Cloud was still in its infancy at the birth of FedRAMP and the majority of federal agencies still procured software with perpetual licenses rather than as a cloud service (e.g., SaaS). In the following 10+ years that have passed, that preference has inverted and now the predominant delivery model is infrastructure/platform/software-as-a-service.
This has led to an environment where new cloud services are popping up every year but federal agencies don’t have access to them via the streamlined FedRAMP marketplace. On the other side of the coin, CSPs want access to the market of federal agencies that are only able to procure software via FedRAMP but the process of becoming FedRAMP certified is a complex and laborious process that reduces the opportunity cost of access to this market.
Luckily, the GSA isn’t resting on its laurels. Due to feedback from all stakeholders they are prioritizing a revamp of the FedRAMP authorization process to take into account the shifting preferences in the market. To help you get a sense of what is happening, how quickly you can expect changes and the benefits of the initiative, we have compiled a comprehensive FAQ.
What are the benefits of the FedRAMP modernization initiative?
TL;DR—For agencies
Increased vendor options within the FedRAMP marketplace
Reduced wait time for CSPs in authorization process
TL;DR—For CSPs
Reduced friction during the authorization process
More clarity on how to meet security requirements
Less time and cost spent on the authorization process
TL;DR—For 3PAOs
Reduced friction between 3PAO and CSP during authorization process
Increased clarity on how to evaluate CSPs
What prompted the GSA to improve FedRAMP now?
GSA is modernizing FedRAMP because of feedback from stakeholders. Both federal agencies and CSPs levied complaints about the current FedRAMP process. Agencies wanted more CSPs in the FedRAMP marketplace that they could then easily procure. CSPs wanted a more streamlined process so that they could get into the FedRAMP marketplace faster. The point of friction was the FedRAMP authorization process that hasn’t evolved at the same pace as the transition from the on-premise, perpetual license delivery model to the rapid, cloud services model.
How will GSA deliver on its promises to modernize FedRAMP?
Taking a customer-centric approach that reduces friction in the authorization process based on customer interviews
Publishing clear guidance on how to meet core security requirements
Streamlining authorization process to reduce bottlenecks based on best practices from agencies that have developed a strong authorization process
Moving away from lengthy documents and towards a data-first foundation to enable automation of the authorization process for CSPs and 3PAOs
Wrap-Up
The GSA has made a commitment to being transparent about the improvements to the modernization process. Anchore, as well as, the rest of the public sector stakeholders will be watching and holding the GSA accountable. Follow this blog or the Anchore LinkedIn page to stay updated on progress.If the 18 month timeline is longer than you’re willing to wait, Anchore is already an expert in supporting organizations that are seeking FedRAMP authorization. Anchore Enterprise is a modern, cloud-native software composition analysis (SCA) platform that both meets FedRAMP compliance standards and helps evaluate whether your software supply chain is FedRAMP compliant. If you’re interested to learn more, download “FedRAMP Requirements Checklist for Container Vulnerability Scanning” or learn more about how Anchore Enterprise has helped organizations like Cisco achieve FedRAMP compliance in weeks versus months.
According to the latest figures, GitHub has over 100 million developers working on over 420 million repositories, with at least 28M being public repos. Unfortunately, very few software repos contain a Software Bill of Materials (SBOM) inventory of what’s been released.
SBOMs (Software Bill of Materials) are crucial in a repository as they provide a comprehensive inventory of all components, improving transparency and traceability in the software supply chain. This allows developers and security teams to quickly identify and address vulnerabilities, enhancing overall security and compliance with regulatory standards.
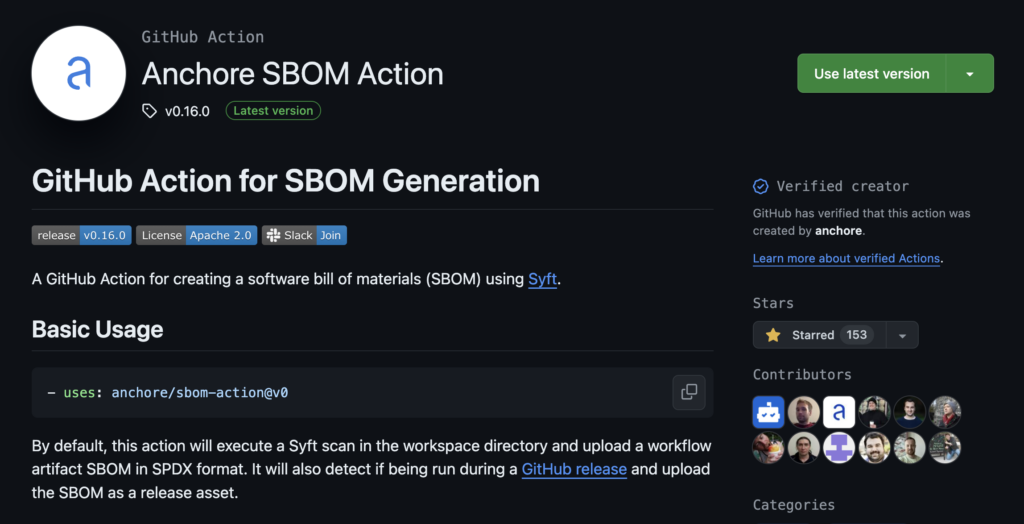
Anchore developed the sbom-action GitHub Action to automatically generate an SBOM using Syft. Developers can quickly add the action via the GitHub Marketplace and pretty much fire and forget the setup.
What is an SBOM?
Anchore developers have written plenty over the years about What is an SBOM, but here is the tl;dr:
An SBOM (Software Bill of Materials) is a detailed list of all software project components, libraries, and dependencies. It serves as a comprehensive inventory that helps understand the software’s structure and the origins of its components.
An SBOM in your project enhances security by quickly identifying and mitigating vulnerabilities in third-party components. Additionally, it ensures compliance with regulatory standards and provides transparency, essential for maintaining trust with stakeholders and users.
Introducing Anchore’s SBOM GitHub Action
Adding an SBOM is a cinch with the GitHub Action for SBOM Generation provided by Anchore. Once added to a repo the action will execute a Syft scan in the workspace directory and upload a workflow artefact SBOM in SPDX format.
The SBOM Action can scan a Docker image directly from the container registry with or without registry credentials specified. Alternatively, it can scan a directory full of artifacts or a specific single file.
The action will also detect if it’s being run during the GitHub release and upload the SBOM as a release asset. Easy!
How to Add the SBOM GitHub Action to Your Project
Assuming you already have a GitHub account and repository setup, adding the SBOM action is straightforward.
There are further options detailed on the GitHub Marketplace page for the action. For example, use output-file to specify the resulting SBOM file name and format to select whether to build an SPDX or CycloneDX formatted SBOM.
Results and Benefits
After the GitHub action is set up, the SBOM will start being generated on each push or with every release – depending on your configuration.
Once the SBOM is published on your GitHub repo, users can analyze it to identify and address vulnerabilities in third-party components. They can also use it to ensure compliance with security and regulatory standards, maintaining the integrity of the software supply chain.
Additional Resources
The SBOM action is open source and is available under the Apache 2.0 License in the sbom-action repository. It relies on Syft which is available under the same license, also on GitHub. We welcome contributions to both sbom-action and Syft, as well as Grype, which can consume and process these generated SBOMs.
Join us on Discourse to discuss all our open source tools.
Rising threats to the software supply chain and increasing use of containers are causing organizations to focus on container security. Containers bring many unique security challenges due to their layered dependencies and the fact that many container images come from public repositories.
5 best practices to instantly strengthening container security
Use SBOMs to build a transparent foundation
SBOMs—Software Bill of Materials—create a trackable inventory of the components you use, which is a precursor for identifying security risks, meeting regulatory requirements and assessing license compliance. Get recommendations on the best way to generate, store, search and share SBOMs for better transparency.
Identify vulnerabilities early with continuous scanning
Security issues can arise at any point in the software supply chain. Learn why shifting left is necessary, but not sufficient for container security. Understand the role SBOMs are critical when responding to zero-day vulnerabilities.
Find out how to use automated policies to identify which vulnerabilities should be fixed and enforce regulatory requirements. Learn how a customizable policy engine and out-of-the-box policy packs streamline your compliance efforts.
Reduce toil in the developer experience
Integrating with the tools developers use, minimizing false positives, and providing a path to faster remediation will keep developers happy and your software development moving efficiently. See how Anchore Enterprise makes it easy to provide a good developer experience
To protect your software supply chain, you must ensure that the code you bring in from third-party sources is trusted and vetted. Implement vetting processes for open-source code that you use.
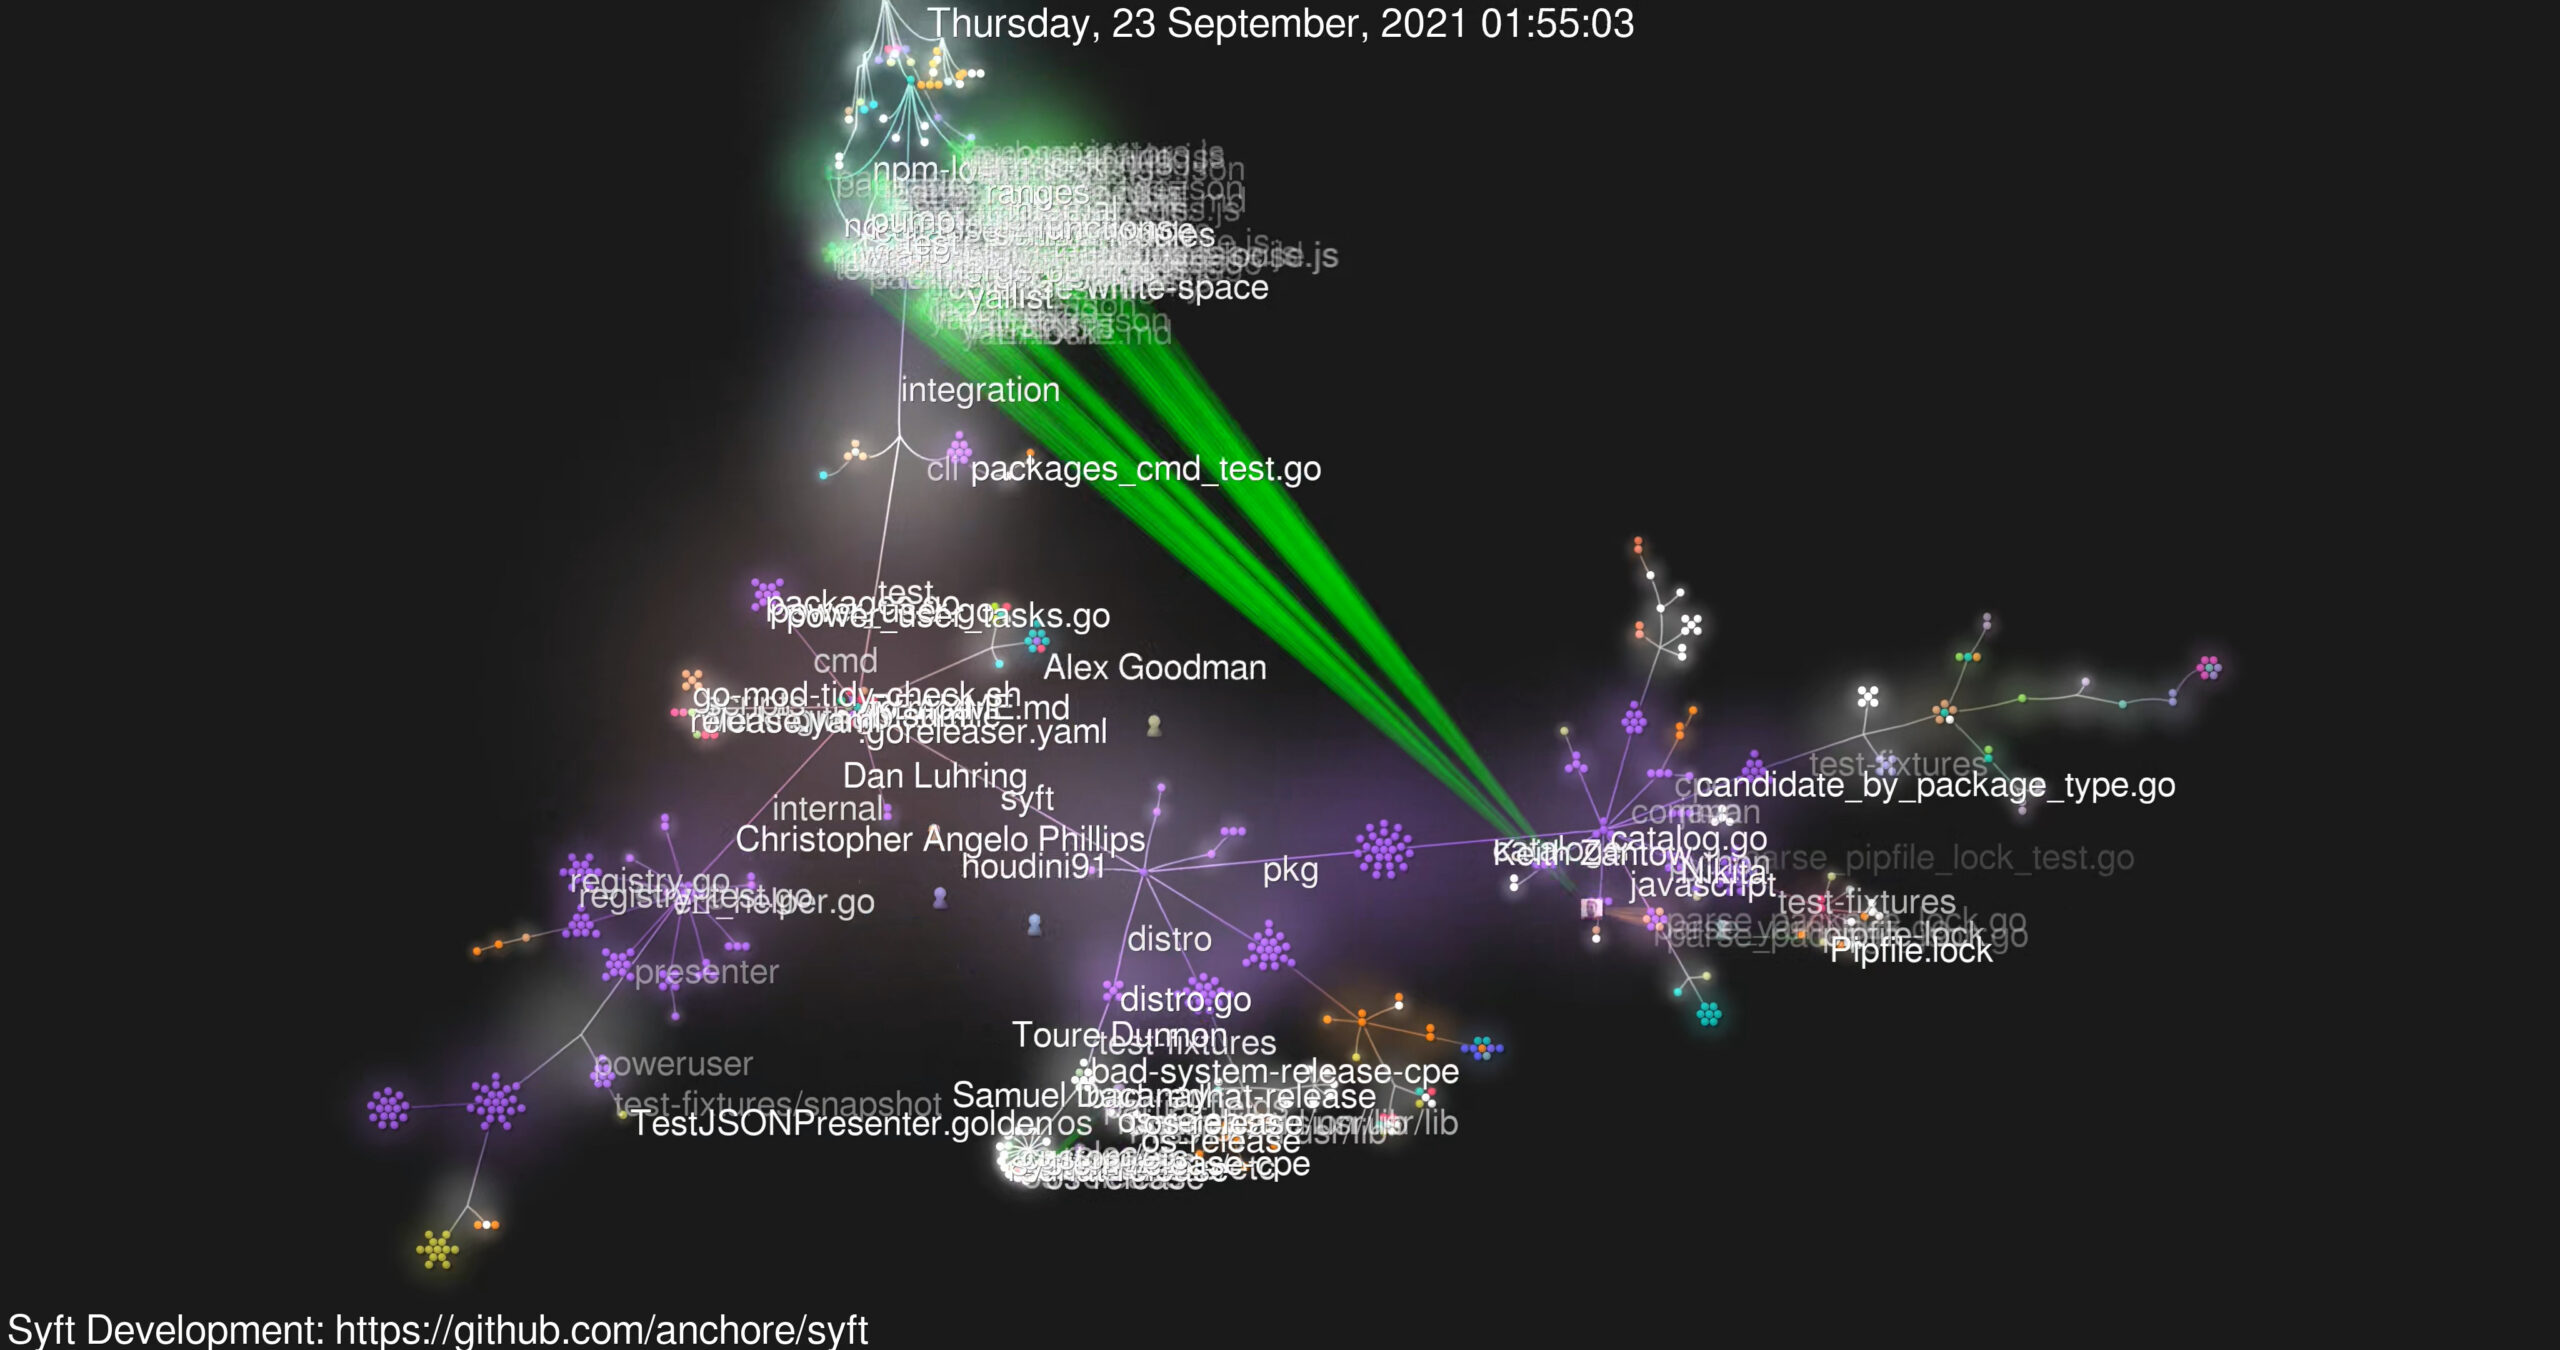
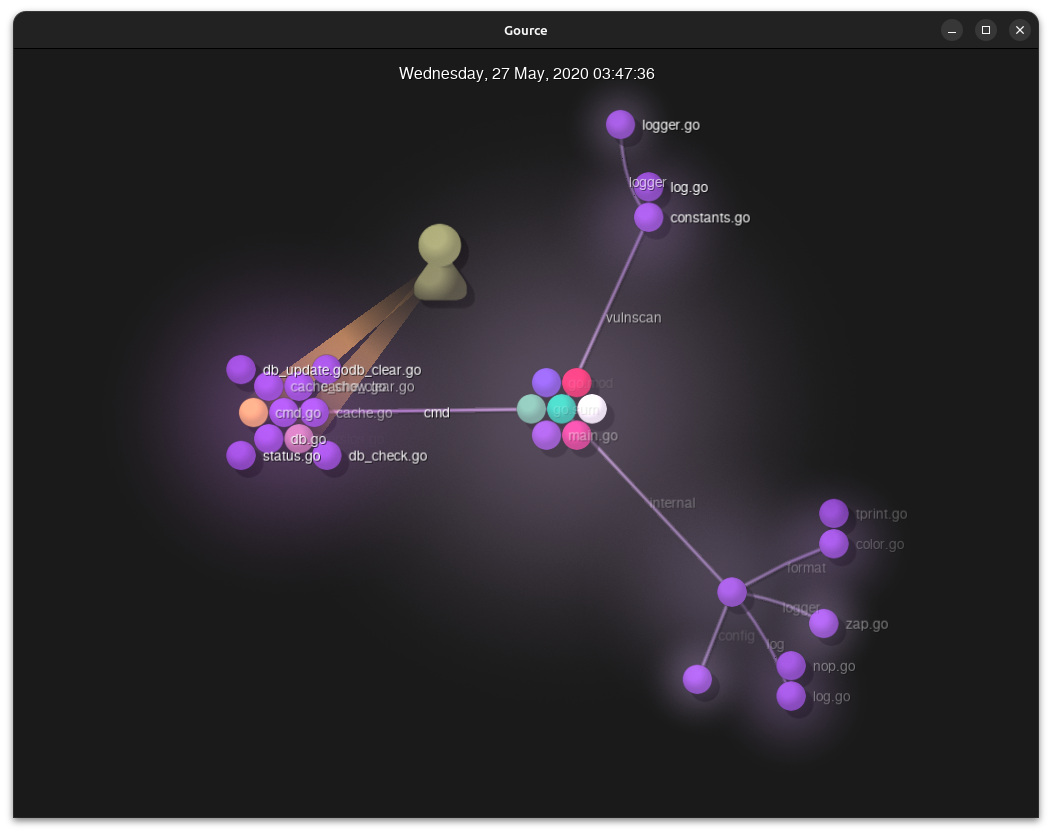
Our open-source SBOM and vulnerability scanning tools Syft and Grype, recently turned four years old. So I did what any nerd would do: render an animated visualization of the development using the now-venerable Gource. Initially, I wanted to render these videos at 120Hz framerate, but that didn’t go well. Read on to find out how that panned out.
For those unaware, Gource is a popular open-source project by Andrew Caudwell. Its purpose is to visualize development with pretty OpenGL-rendered videos. You may have seen these animated glowing renders before, as Gource has been around for a while now.
Syft is Anchore’s command-line tool and library for generating a software bill of materials (SBOM) from container images and filesystems. Grype is our vulnerability scanner for container images and filesystems. They’re both fundamental components of our Anchore Enterprise platform but are also independently famous.
Generating the video
Plenty of guides online cover how to build Gource visualizations, which are pretty straightforward. Gource analyses the git log of changes in a repository to generate frames of animation which can be viewed or saved to a video. There are settings to control various aspects of the animation, which are well documented in the Gource Wiki.
By default, while Gource is running, a window displaying the animation will appear on your screen. So, if you want to see what the render will look like, most of the defaults are fine when running Gource directly.
Tweak the defaults
I wanted to limit the video duration, and render at a higher resolution than my laptop panel supports. I also wanted the window to be hidden while the process runs.
tl;dr Here’s the full command line I used to generate and encode the 4K video in the background.
$/usr/bin/xvfb-run--server-num=99-e/dev/stdout\-s'-screen 0 4096x2160x24 '/usr/bin/gource\--max-files0--font-scale4--output-framerate60\-4096x2160--auto-skip-seconds0.1--seconds-per-day0.16\--bloom-multiplier0.9--fullscreen--highlight-users\--multi-sampling--stop-at-end--high-dpi\--user-image-dir../faces/--start-date2020-05-07\--title'Syft Development https://github.com/anchore/syft'\-o-\ffmpeg-y-r60-fimage2pipe-vcodecppm-i-\-vcodeclibx264-presetveryfast-pix_fmtyuv420p\-crf1-threads0-bf0../syft-4096x2160-60.mkv
Let’s take a step back and examine the preparatory steps and some interesting points to note.
Preparation
The first thing to do is to get Gource and ffmpeg. I’m using Ubuntu 24.04 on my ThinkPad Z13, so a simple sudo apt install gource ffmpeg works.
Gource can use avatar images in the videos which represent the project contributors. I used gitfaces for this. Gitfaces is available from PyPI, so can be installed with pip install -U gitfaces or similar. Once installed, generate the avatars from within the project folder.
Do this for each project you wish to render out. I used a central ../faces folder as there would be some duplication between the projects I’m rendering. However, not everyone has an avatar, so they’ll show up as an anonymous “head and shoulders” in the animation.
Test render
Perform a quick test to ensure Gource is installed correctly and the avatars are working.
A default-sized window of 1052×834 should appear with nicely rendered blobs and lines. If you watch it for any appreciable length, you’ll notice it can be boring in the gaps between commits. Gource has some options to improve this.
The --auto-skip-seconds option defines when Gource will skip to the next entry in the git log while there is no activity. The default is 3 seconds, which can be reduced. With --seconds-per-day we can set the render speed so we don’t get a very long video.
I used 0.1 and 0.16, respectively. The result is a shorter, faster, more dynamic video. The Gource Wiki details many other options for Gource.
Up the resolution!
While the default 1052×834 video size is fine for a quick render, I wanted something much bigger. Using the ‘4 years in 4 minutes at 4K’ heading would be fun, so I went for 4096×2160. My laptop doesn’t have a 4K display (it’s 2880×1800 natively), so I decided to render it in the background, saving it to a video.
To run it in the background, I used xvfb-run from the xvfb package on my Ubuntu system. A quick sudo apt install xvfb installed it. To run Gource inside xvfb we simply prefix the command line like this:
(this is not the full command, just a snippet to show the xvfb syntax)
Note that the XServer’s resolution matches the video’s, and we use the fullscreen option in Gource to use the whole virtual display. Here we also specify the color bit-depth of the XServer – in this case 24.
Create the video
Using ffmpeg—the Swiss army knife of video encoding—we can turn Gource’s output into a video. I used the x264 codec with some reasonable options. We can run these as two separate commands: one to generate a (huge) series of ppm images and the second to compress that into a reasonable file size.
Four years of commits as uncompressed 4K60 images will fill the disk pretty fast. So it’s preferable to chain the two commands together so we save time and don’t waste too much disk space.
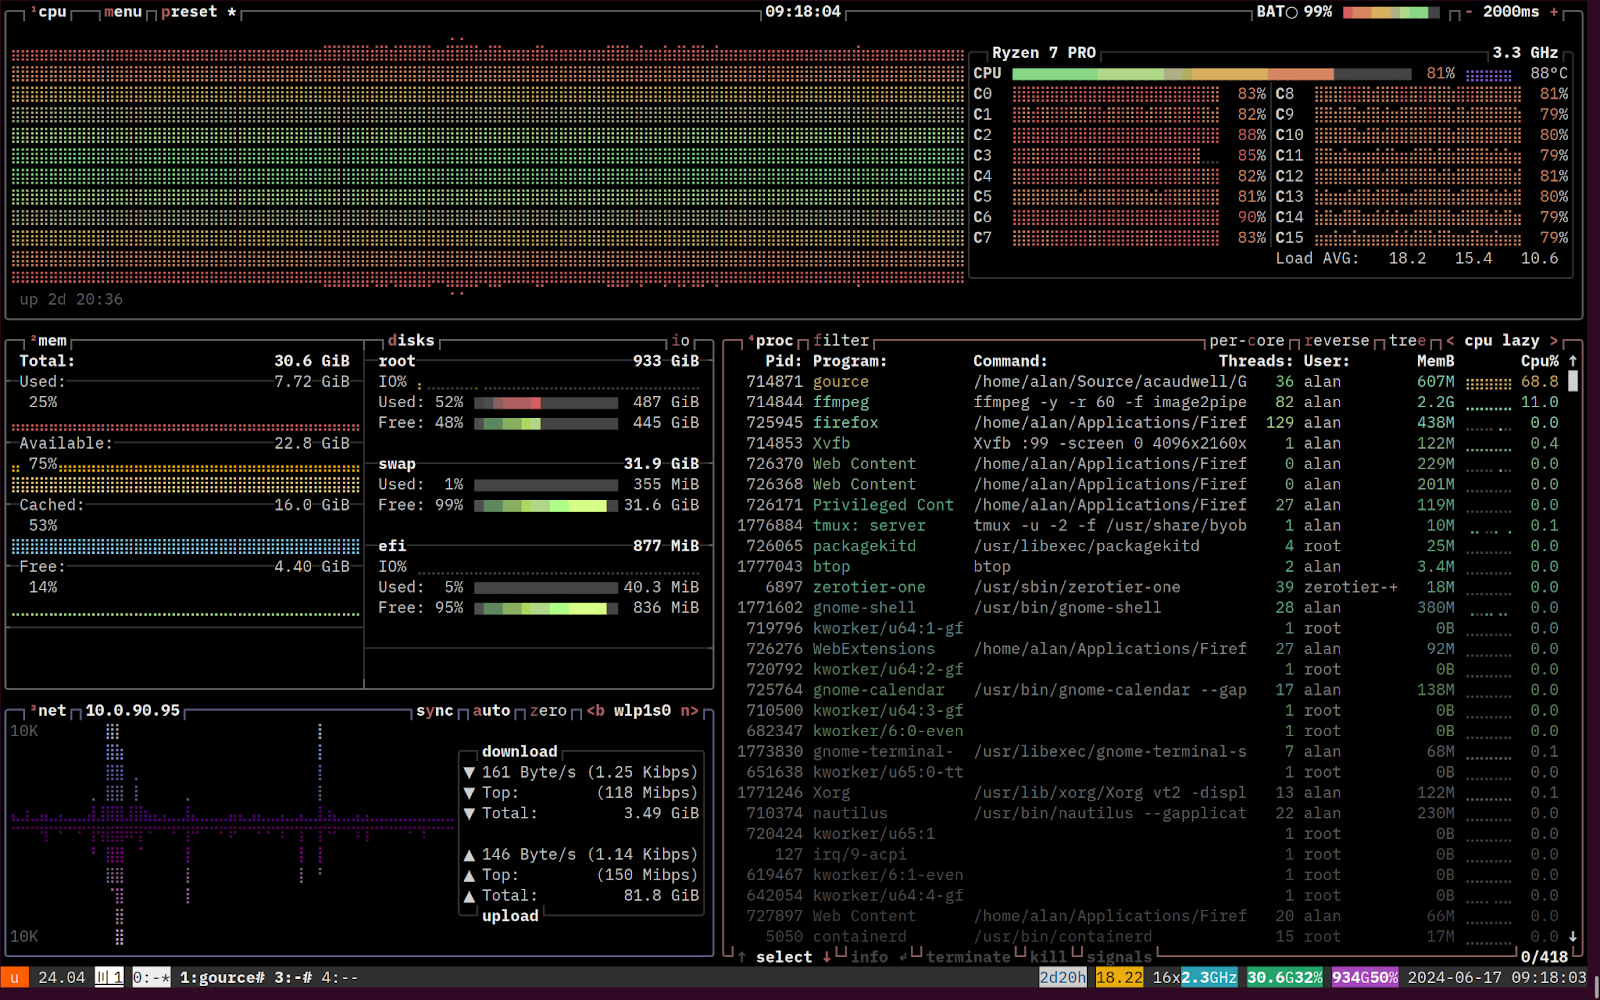
On my ThinkPad Z13 equipped with an AMD Ryzen 7 PRO 6860Z CPU, this takes around 42 minutes and generates a ~10GB mkv video. Here’s what the resource utilisation looks like while this is running. Fully maxed out all the CPU cores. Toasty!
Challenges
More frames
Initially, I considered creating a video at 120fps rather than the default 60fps that Gource generates. However, Gource is limited in code to 25, 30, and 60fps. As an academic exercise, I patched Gource (diff below) to generate visualizations at the higher frame rate.
I’m not a C++ developer, nor do I play one on TV! But with a bit of grep and a small amount of trial and error, I modified and rebuilt Gource to add support for 120fps.
As you can see and probably expect on some test renders, with these settings, double the frames means double the size. I could have fiddled with ffmpeg to use better-optimized options, or a different codec, but decided against it.
There’s an even more significant issue here. There are precious few places to host high-frame-rate videos; few people have the hardware, bandwidth, and motivation to watch them. So, I rolled back to 60fps for subsequent renders.
More pixels
While 4K (4096×2160) is fun and fits the story of “4 years in 4 minutes at 4K”, I did consider trying to render out at 8K (7680×4320). After all, I had time on my hands at the weekend and spare CPU cycles, so why not?
Sadly, the hardware x264 encoder in my ThinkPad Z13 has a maximum canvas size of 4096×4096, which is far too small for 8K. I could have encoded using software rather than hardware acceleration, but that would have been ludicrously more time-consuming.
I do have an NVIDIA card but don’t believe it’s new enough to do 8K either, being a ‘lowly’ (these days) GTX 2080Ti. My work laptop is an M3 MacBook Pro. I didn’t attempt rendering there because I couldn’t fathom getting xvfb working to do off-screen rendering in Gource on macOS.
I have another four years to figure this out before my ‘8 years of Syft in 8 minutes at 8K’ video, though!
Minor edits
Once Gource and ffmpeg did their work, I used Kdenlive to add some music and our stock “top and tail” animated logo to the video and then rendered it for upload. The default compression settings in Kdenlive dramatically reduced the file size to something more manageable and uploadable!
Conclusion
Syft and Grype are – in open source terms – relatively young, with a small, dedicated team working on them. As such, the Gourse renders aren’t as busy or complex as more well-established projects with bigger teams.
We certainly welcome external contributions over on the Syft and Grype repositories. We also have a new Anchore Community Discourse where you can discuss the projects and this article.
If you’d like to see how Syft and Grype are integral to your SBOM generation, vulnerability and policy enforcement tools, contact us and watch the guided tour.
I always find these renders technically neat, beautiful and relaxing to watch. The challenges of rendering them also led me down some interesting technical paths. I’d love to hear feedback and suggestions over on the Anchore Community Discourse