Author: Sonja Schweigert
NIST 2.0: Common Failures and Their Impact on Cybersecurity Resilience
Breaking the Vulnerability Management Cycle with Anchore and Echo
Accelerate & Secure: Optimizing Your Software Supply Chain with DevSecOps
Generative AI in Risk and Compliance: Insights from the 2025 Industry Report
The Regulation and Liability of Open Source Software
Can an LLM Really Fix a Bug? A Start-to-Finish Case Study

The software industry faces a growing problem: we have far more open issues than we have contributors multiplied by available time. Every project maintainer knows this pain. We certainly recognize this across our open source tools Syft, Grype and Grant.
The backlogs grow faster than teams can address them, and “good first issues” can sit untouched for months. What if we could use AI tools not just to write code, but to tackle this contributor time shortage systematically?
Friends and podcast presenters frequently share their perspective that LLMs are terrible at coding tasks. Rather than accepting this at face value, I wanted to conduct a controlled experiment using our own open source tools at Anchore.
My specific hypothesis: Can an LLM take me from start to finish; selecting a bug to work on, implementing a fix, and submitting a pull request that gets merged; while helping me learn something valuable about the codebase?
Explore SBOM use-cases for almost any department of the enterprise and learn how to unlock enterprise value to make the most of your software supply chain.
Finding the Right Issue to Work On
Most repositories tag specific issues as “good-first-issue”, a label typically assigned by the core developers. They tend to know the project well enough to identify work items suitable for newcomers. These issues represent the sweet spot: meaningful contributions that may not require deep architectural knowledge, which is why I think they might be suitable for this test.
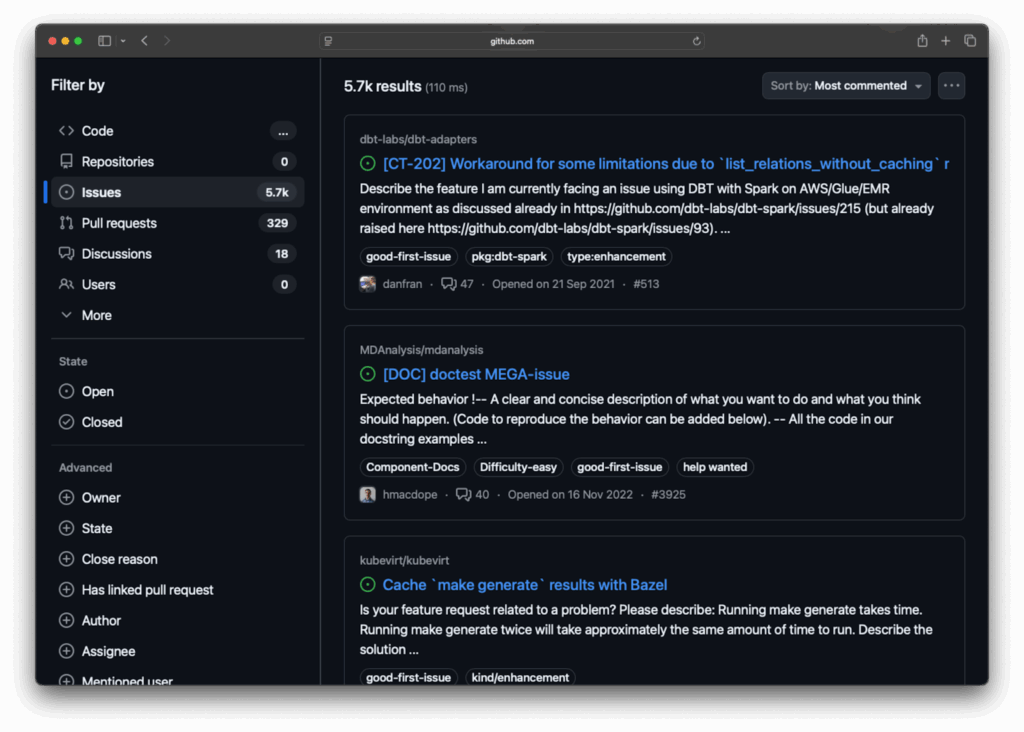
Rather than manually browsing through dozens of issues, I wrote a quick script that uses gh to gather all the relevant data systematically. The expectation is that I can benefit from an LLM to pick an appropriate issue from this list.
#!/bin/bash
# Script to find and save open issues with
# a specific label from a GitHub repository.
#
# Usage: ./find-labelled-issues.sh [org/repo] [label] [limit]
set -e

repo="${1:-anchore/syft}"
label="${2:-good-first-issue}"
limit="${3:-50}"
tmpfile=$(mktemp)
results="./results/$repo"

cleanup() {
    rm -f "$tmpfile"
}
trap cleanup EXIT

mkdir -p "$results"

# Grab the issues with the specified label
echo "Fetching issues from repo with label 'label'..."
gh issue list -R "repo" --label "$label" --state "open" --limit "$limit" --json number --jq '.[] | .number' > "tmpfile"

while read -r issue_number; do
    echo "Processing repo issue #issue_number"
    filename="(echo $repo | tr '/' '_')_issue_issue_number.json"
    gh issue view "issue_number" -R "$repo" --json title,body,author,createdAt,updatedAt,comments,labels --jq '. | {title: .title, body: .body, author: .author.login, createdAt: .createdAt, updatedAt: .updatedAt, comments: .comments, labels: [.labels[].name]}' | jq . > "$results/filename"
done < "$tmpfile"

echo "All issues processed. Results saved in the $results directory."This script does the heavy lifting of gathering not just the initial bug reports, but all the comments and discussions that often contain crucial implementation hints from the project maintainers.
I ran this across multiple Anchore repositories, to get the first fifty:
for repo in syft grype grant stereoscope; do
    ./find-good-first-issues.sh anchore/$repo good-first-issue 50
doneLetting the LLM Choose
With all the data collected, I presented the entire set to Claude and asked them to recommend which issue I should work on. I deliberately provided it with minimal criteria, allowing the LLM to develop its own evaluation framework.

Claude devised an evaluation criterion based on the following factors and weights:
Impact & User Value (Weight: 30%)
- High: Critical functionality, affects many users, or enables new important use cases
- Medium: Useful improvements or bug fixes affecting moderate user base
- Low: Nice-to-have features or edge cases
Implementation Complexity (Weight: 25%)
- Easy: Clear requirements, well-defined scope, straightforward implementation
- Medium: Some complexity but manageable with good planning
- Hard: Complex architecture changes, unclear requirements, or extensive testing needed
Information Quality (Weight: 20%)
- Excellent: Clear problem description, reproduction steps, examples, context
- Good: Adequate information with some details
- Poor: Vague description, missing context or examples
LLM Assistance Potential (Weight: 15%)
- High: Pattern matching, code generation, template work, documentation
- Medium: Some assistance possible for research or boilerplate
- Low: Requires deep domain expertise or complex architectural decisions
Community Need (Weight: 10%)
- High: Many comments, long-standing issue, or frequently requested
- Medium: Some community interest
- Low: Limited engagement
Using the above criteria, Claude grouped the current open issues into three “Tiers” and “Avoid”, for those that might be too complex or have insufficient information to complete. The “Top Tier” issues included Syft issue #675 – “Markdown Table Output Support”, and #2555 – “Windows .NET6 Dependency Parsing Fix”, but finally landed on Syft issue #2250 – “package.json authors keyword parsing”. This involves parsing the authors field in package.json files. Quoting the LLM’s response, the rationale was somewhat compelling:
"This issue stands out as the best choice because it's ideal for AI assistance—it involves JSON parsing, regex patterns, and code generation—all areas where LLMs excel. The problem has crystal clear requirements with exact examples of expected JSON structures, a manageable scope contained in a single file. It provides real user impact by improving npm package metadata parsing accuracy."The issue was well-documented with specific examples:
"authors": [
   "Harry Potter <[email protected]> (http://youknowwho.com/)",
   "John Smith <[email protected]> (http://awebsite.com/)"
]
Starting the Development Work
With the issue selected, I moved into VS Code and enabled GitHub Copilot’s agent mode, which allows the AI to edit code and run commands rather than just make suggestions. My initial prompt was deliberately simple:
#codebase

This is the syft codebase. Syft is an SBOM generator.

I have analyzed all the open bugs in syft that are tagged "good first issue" and found 2250 a good one to start with.

The rationale is in #file:anchore_syft_issue_2250_rationale.md and the bug itself is detailed in #file:anchore_syft_issue_2250.json

Please formulate a plan for implementing the fix. Do not start working on the code. I would like you to break down the fix into the necessary steps and explain them. If you need more information, ask questions.The key was treating this as a collaborative process. I read every response, examined all generated code, and made sure I understood each step. Working in a feature branch meant I could experiment freely, abandon approaches that weren’t working, and restart with different prompts when needed. I was under no obligation to accept any of the suggestions from the LLM.
The Iterative Process
The most valuable part of this experiment was the back-and-forth dialog. When the LLM-generated code was unclear to me, I asked questions. When it made assumptions about the codebase structure, I corrected them. When it needed more context about contributing guidelines, I provided that information by directing it to the CONTRIBUTING.md and DEVELOPING.md files from the repository.
This iterative approach allowed me to learn about the Syft codebase structure, Go programming patterns, and the project’s testing conventions throughout the process. The LLM worked as a knowledgeable pair-programming partner rather than a black-box code generator.
Testing and Validation
The LLM automatically detected the project’s existing test structure and generated appropriate test cases for the new functionality. It was understood that any changes needed to maintain backward compatibility and avoid breaking existing package.json parsing behavior.
Running the test suite confirmed that the implementation worked correctly and didn’t introduce regressions, a crucial step that many rushed “vibe-coded” AI-assisted contributions skip.
Pull Request Creation
When the code was ready, I asked the LLM to draft a pull request description using the project’s template. I edited this slightly to match my writing style before submitting, but the generated description covered all the key points: what the change does, why it’s needed, and how it was tested.
The pull request was submitted like any other contribution and entered the standard review process.
Results and Lessons Learned
The experiment succeeded: the pull request was merged after review and feedback from the maintainers. But the real insights came from what happened during the process:
Speed Gains: The development process was somewhere around 3-5 times faster than if I had tackled this issue manually. The LLM handled the routine parsing logic while I focused on understanding the broader codebase architecture.
Learning Acceleration: Rather than just producing code, the process accelerated my understanding of how Syft’s package parsing works, Go testing patterns, and the project’s contribution workflow.
Maintainer Perspective: The project maintainers could tell the code was AI-assisted (interesting in itself), but this wasn’t a significant problem. They provided thoughtful feedback that I was able to incorporate with the LLM’s help.
Room for Improvement: I should have explicitly pointed the LLM to the contributing guidelines instead of relying on the codebase to infer conventions. This would have saved some iteration cycles.
When This Approach Makes Sense
I wouldn’t use this process for every contribution. Consuming all the good-first-issues would leave nothing for human newcomers who want to learn through direct contribution. The sweet spot seems to be:
- Straightforward issues with clear requirements.
- Learning-focused development where you want to understand a new codebase.
- Time-constrained situations where you need to move faster than usual.
- Problems that involve routine parsing or data transformation logic.
Future Refinements
For the next contributions, I will make several improvements:
- Add explicit prompts to match my writing style for pull request descriptions.
- Point the LLM directly to the contributing guidelines and coding standards, which are in the repository, but sometimes require explicit mention.
- Consider working on issues that aren’t tagged as “good-first-issue” to preserve those seemingly “easier” ones for other human newcomers.
- Add a note in the pull request acknowledging the use of a tool-assisted approach.
The goal isn’t to replace human contributors, but to find ways that AI tools can help us tackle the growing backlog of open issues while genuinely accelerating our learning and understanding of the codebases we work with.
This experiment suggests that with the right approach, LLMs can be valuable partners in open source contribution, not just for generating code, but for navigating unfamiliar codebases and understanding project conventions. The key is maintaining active engagement with the entire process, rather than treating AI as a one-click magic solution.
After conducting this experiment, I discussed the outcomes with the Anchore Open Source team, which welcomes contributions to all of its projects. They were quick to point out the quality difference between a well-curated AI-assisted pull request and a “vibe-coded” one, thrown over the wall.
What similar experiments would you want to see? The intersection of AI tools and open-source contributions feels like fertile ground for making our development workflows both faster and more educational.
Learn about the role that SBOMs for the security of your organization in this white paper.

Establishing Continuous Compliance with Anchore & Chainguard: Automating Container Security
Packages, Policies, and Performance: What’s New in Grant
Streamline Vulnerability Management: From Minimal Images to Comprehensive SBOM Analysis
Container Drift, Base Images, & CMMC: Solving Public Sector Security Challenges
Beyond Compliance: Neil Levine Reveals How Anchore is Revolutionizing SBOM Management
Carahsoft DevSecOps Conference
Enhancing Security in Cloud-Native Environments with Anchore’s Alex Rybak and Neil Levine
Time to Take Another Look at Grype: A Year of Major Improvements
If you last tried Grype a year ago and haven’t checked back recently, you’re in for some pleasant surprises. The past twelve months have significantly improved the accuracy and performance of our open source vulnerability scanner. Whether you’re dealing with false positives, slow database updates, or wanting deeper insights into your vulnerability data, Grype has evolved considerably.
Let’s dive into the highlights that make now a perfect time to give Grype another look.
Dramatically Fewer False Positives
One of the most common complaints we’ve heard over the years was about false positives – vulnerabilities being incorrectly flagged where they didn’t actually exist. This problem was particularly acute when scanning Java applications, where a Python package named “redis” might trigger vulnerabilities meant for the Redis database server, or where different ecosystems would cross-contaminate results.
The root cause was our reliance on CPE (Common Platform Enumeration) matching from the National Vulnerability Database. While comprehensive, CPE matching often lacked the ecosystem-specific context needed for accurate results.
The solution? We’ve fundamentally shifted our approach to prioritize the GitHub Advisory Database, which provides ecosystem-specific vulnerability data. The results speak for themselves:
- Up to 80% reduction in false positives across some ecosystems
- More accurate matching that respects package ecosystem boundaries
- Cleaner, more actionable scan results
 # Before: Multiple false positives for "redis"
 $ grype redis:latest
 ...
 CVE-2022-0543    redis    pkg:gem/[email protected]

 # After: Only legitimate vulnerabilities reported
 $ grype redis:latest
 # Clean results focused on actual Redis server vulnerabilities
Don’t worry if you still need CPE matching for specific use cases – it’s still available and configurable. But for most users, the new defaults provide dramatically better accuracy.
So, while not completely solved, we’re another step closer to nirvana.
Database Revolution: Faster, Smaller, Smarter
Behind the scenes, we’ve completely reimagined how Grype stores and accesses vulnerability data with our move from database schema v5 to v6. This isn’t just a version bump – it’s a fundamental architectural improvement.
The numbers tell the story:
| Metric | Schema v5 | Schema v6 | Improvement |
| Download Size | 210 MB | ↓ 65 MB | ↓ 69% smaller |
| On-disk DB Size | 1.6 GB | ↓ 900 MB | ↓ 44% smaller |
For your day-to-day workflow, this means:
- Faster CI/CD pipelines with quicker database updates
- Reduced bandwidth costs especially important for air-gapped environments
- Better performance on resource-constrained systems
But the improvements go beyond just size. The new schema is built around OSV (Open Source Vulnerability) standards and includes powerful new datasets:
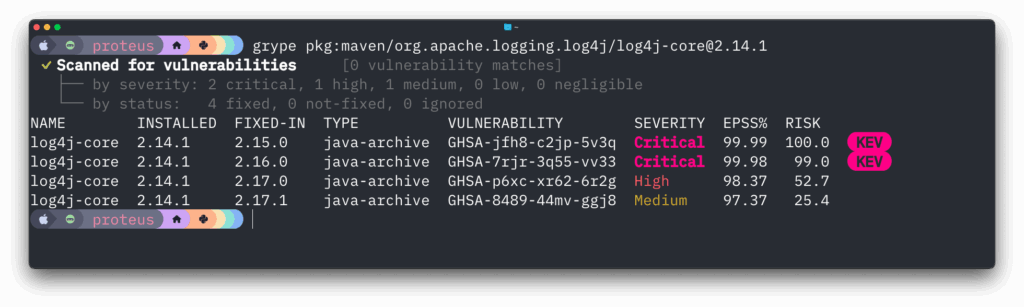
Enhanced Intelligence with CISA KEV and EPSS
Grype now includes CISA’s Known Exploited Vulnerabilities (KEV) database and EPSS (Exploit Prediction Scoring System) data. This means you can now prioritize vulnerabilities actively exploited in the wild or have a high probability of exploitation.
This contextual information helps security teams focus their remediation efforts on the most important vulnerabilities.
The KEV and EPSS data and a vulnerability’s severity are now used to calculate a “Risk” value, presented in the Grype tabular output.
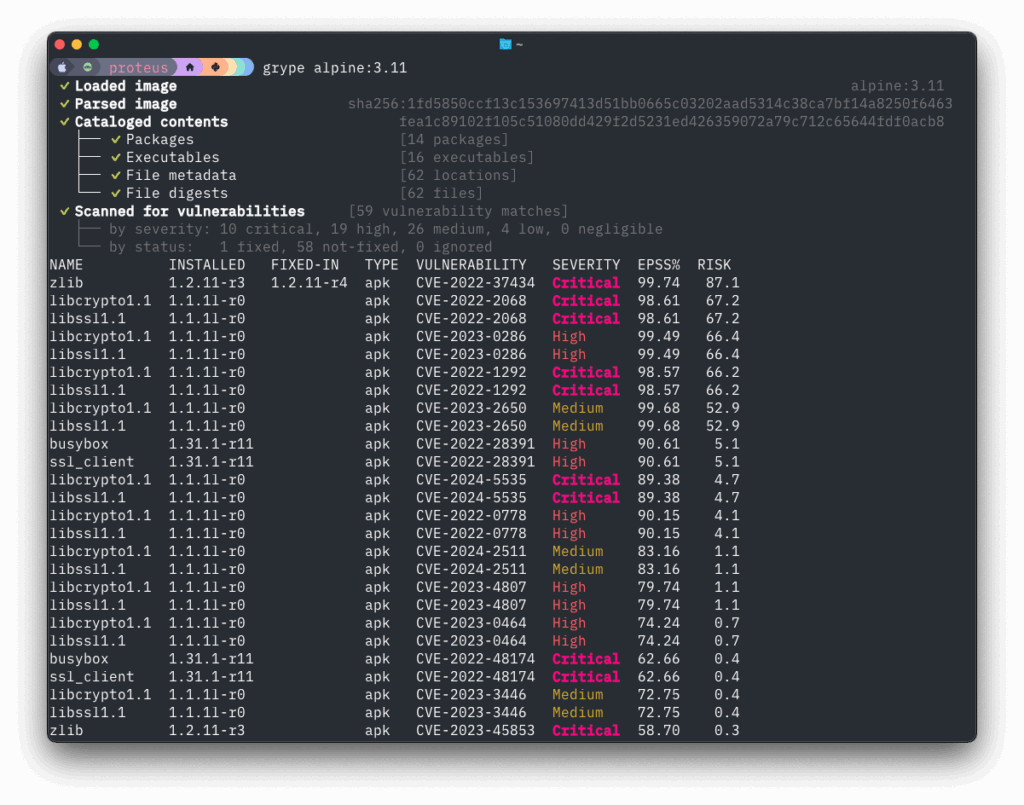
The tabular output from Grype is now sorted by the calculated “Risk” column by default.
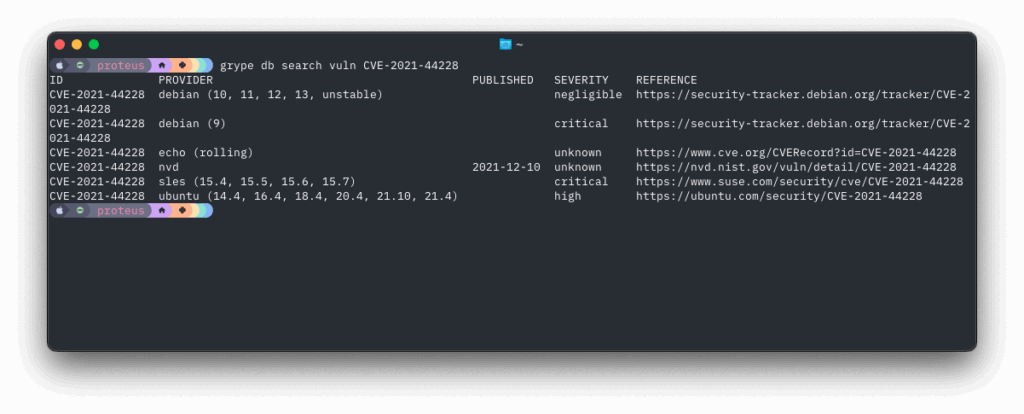
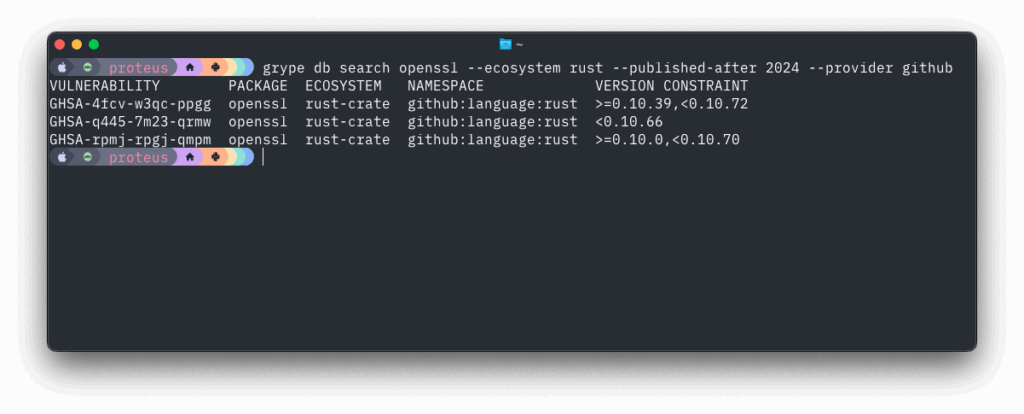
Database Search: Your New Best Friend
One of the most powerful additions to Grype is the enhanced database search functionality. Previously, investigating vulnerability data meant manually searching through multiple sources. Now, you can query the Grype database directly to understand what’s in there and why certain matches occur.
This is best illustrated with a few examples:
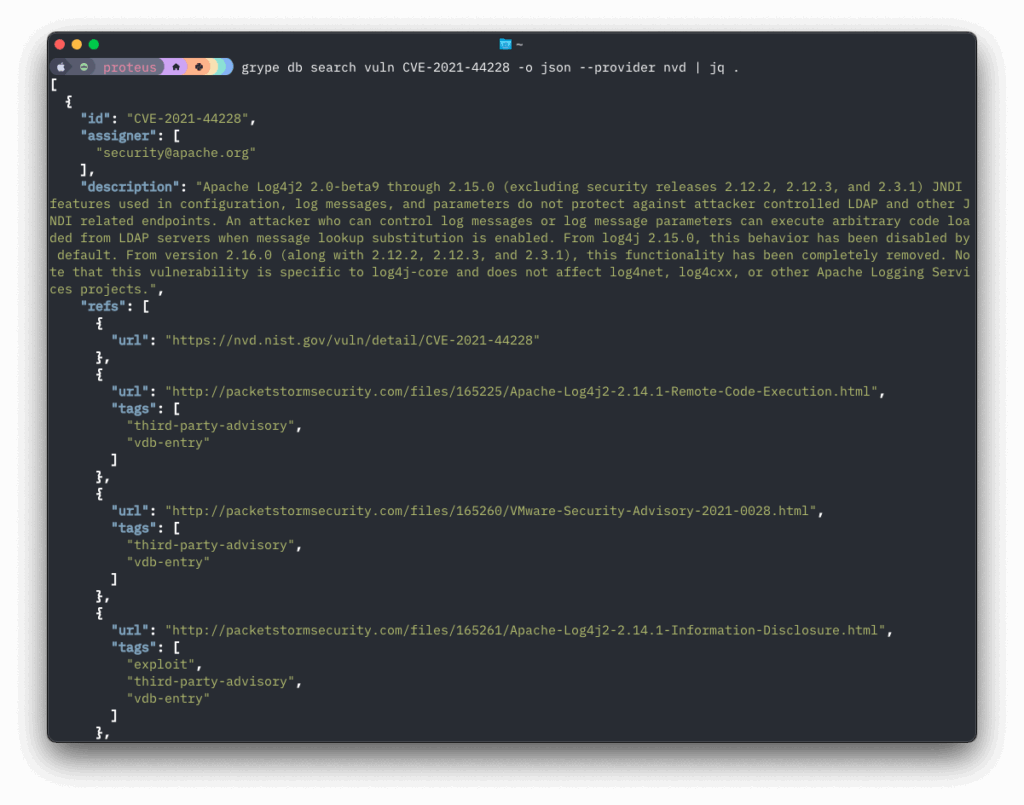
Find all vulnerabilities affecting log4j
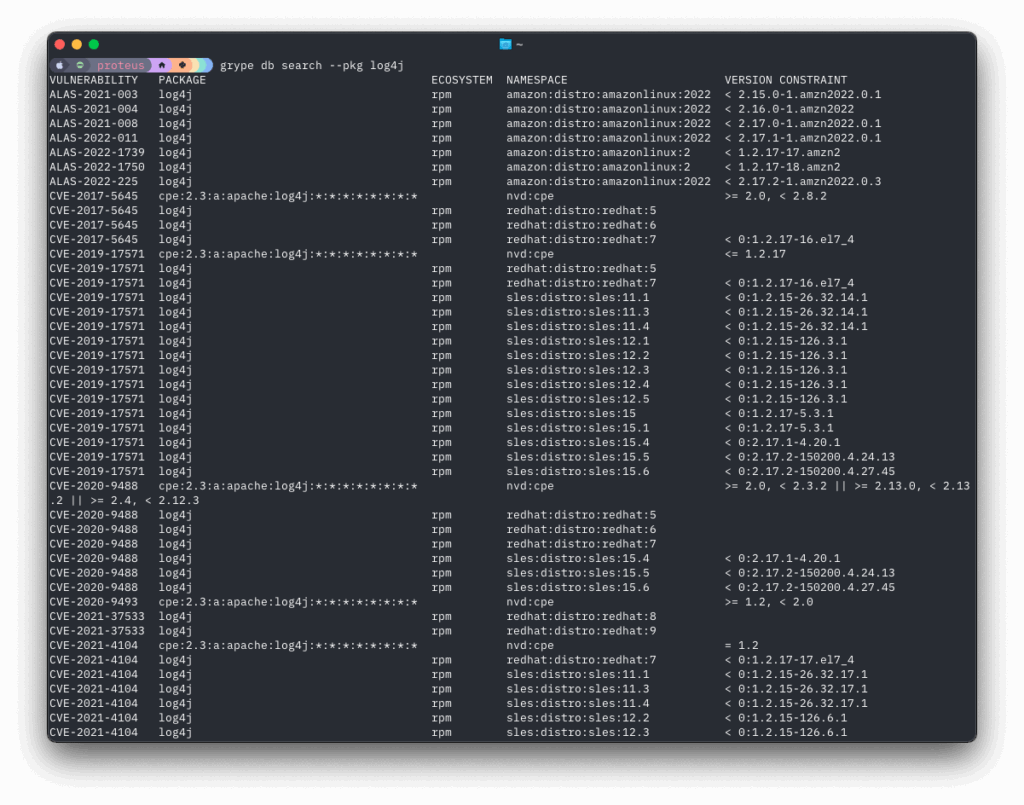
Search for specific vulnerability details
Search for vulns in a specific package/library and ecosystem
This transparency helps with:
- Debugging unexpected results – understand exactly why a match occurred
- Security research – explore vulnerability patterns across ecosystems
- Compliance reporting – validate that your scanning covers relevant vulnerability sources
A Cast of Thousands (Well, Five): The Ecosystem Advantage
While Grype is the star of this story, its improvements are powered by advances across our entire toolchain. Syft, our SBOM generation tool, has dramatically expanded its package detection capabilities over the past year:
New Binary Detection:
- Chrome/Chromium browsers
- curl and other common utilities
- Dart language binaries
- PHP interpreters and extensions
- Haskell and OCaml binaries
Enhanced Language Support:
- Improved .NET detection with better dependency relationships
- NuGet package support
- Enhanced Java cataloging with better Maven support
- Python packaging improvements with dependency relationships
- Support for Rust cargo-auditable binaries
Better Container Analysis:
- Support for scanning Debian archives directly
- Improved handling of symlinks and complex file systems
- Better performance with large container images
This expanded detection means Grype can now find and assess vulnerabilities in a broader range of software components, giving you more comprehensive security coverage.
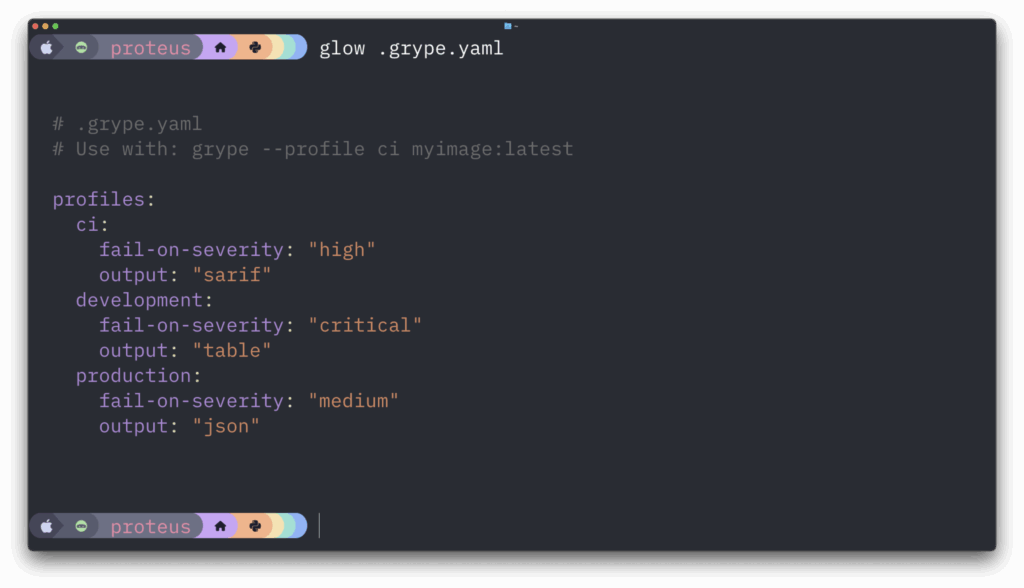
Configuration Profiles: Simplify Your Setup
Managing Grype configuration across different environments previously required maintaining separate config files. Now, Grype supports hierarchical configuration with profiles, making it easy to maintain different scanning policies for various environments as well as per-project exclusion lists.
PURL Support: Scan What You Know
Sometimes you don’t need to scan an entire container image – you just want to check if a specific package version has known vulnerabilities. Grype now supports direct PURL (Package URL) scanning:
Check a specific package version
Feed Grype one or more PURLs from a file

This is particularly useful for dependency checking in CI/CD pipelines or when you want to validate specific component versions.
Performance Under the Hood
Beyond the user-facing features, significant engineering work has improved Grype’s performance and reliability:
- Faster vulnerability matching with optimized database queries
- Reduced memory consumption especially when scanning large container images
- Better error handling with more informative messages when things go wrong
The Road Ahead
The past year has established a solid foundation for Grype’s future. With the new database architecture in place, we can more rapidly integrate new vulnerability sources and provide richer context about security issues.
Key areas we’re continuing to develop include:
- Enhanced support for emerging package ecosystems
- Better integration with vulnerability management workflows
- More sophisticated vulnerability prioritization
- Expanded scanning capabilities for different artifact types
Try It Today
If you’re already using Grype, updating to the latest version will automatically give you these improvements. If you’re new to Grype or haven’t tried it recently, installation is straightforward, from brew or using our installer.
Install and run Grype
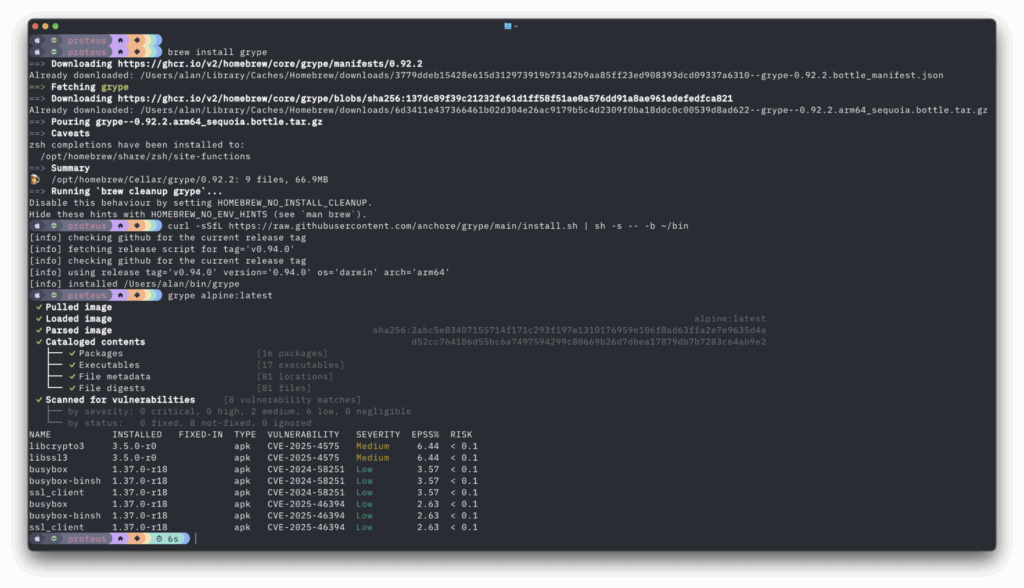
For CI/CD integration, the Grype GitHub Action and Docker images make integration seamless.
Grype vs The World
Have you tested Grype recently? Maybe you’re comparing it to other tools in the market. Let us know how we got on, we would love to know. This post on our community Discourse is a great place to share your experience and give us your feedback.
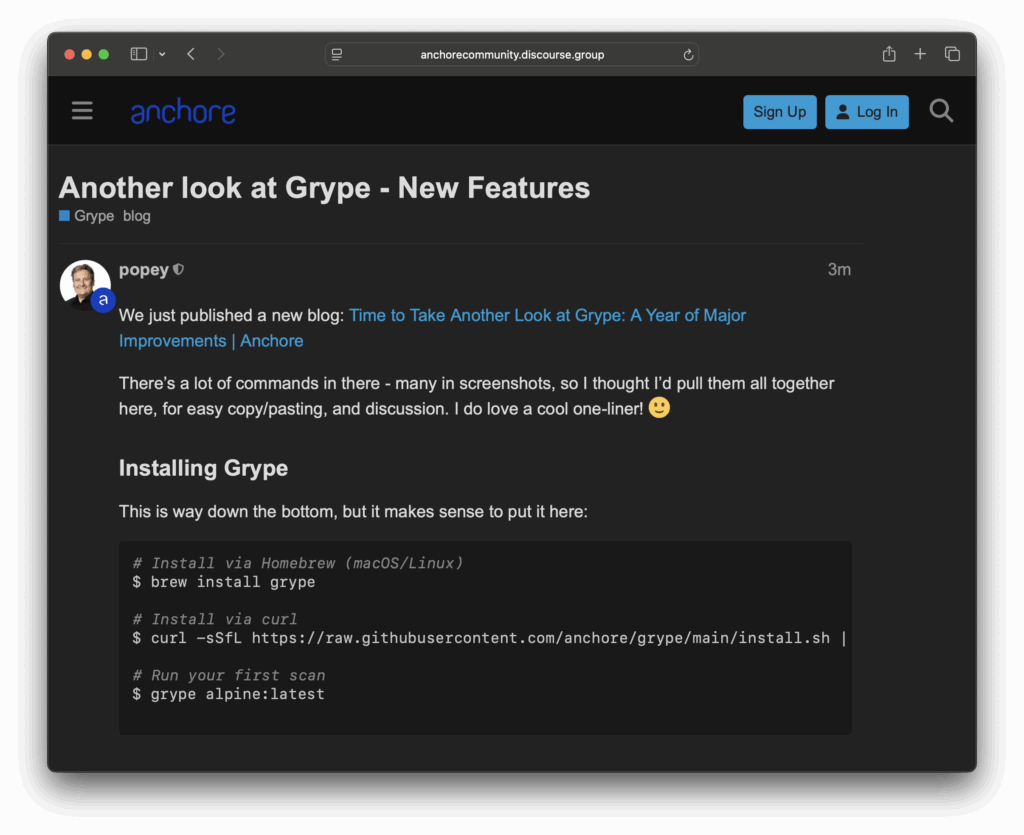
I also put all the above commands in there, for easy copy/paste-ability!
Get Involved
Grype is open source, and community contributions have been essential to these improvements. Whether you’re reporting bugs, suggesting features, or contributing code, there are multiple ways to get involved:
- GitHub: anchore/grype for issues and contributions
- Community: Join our Discourse community for discussions and support, and let us know how you get on!
- Newsletter: Sign up for our community newsletter for updates
The past year has shown that security scanning becomes a force multiplier rather than a bottleneck when tooling gets out of the way and provides accurate, actionable results. Grype’s evolution continues to focus on this goal: giving you the information you need to secure your software supply chain without the noise.
Give it another look – you might be surprised by how much has changed!
How to Use Anchore & DefectDojo to Stand Up Your DevSecOps Function
Join Anchore Open Source Team: Live Stream
Unlocking Federal Markets: The Enterprise Guide to FedRAMP
Contributing to Vulnerability Data: Making Security Better for Everyone
Software security depends on accurate vulnerability data. While organizations like NIST maintain the National Vulnerability Database (NVD), the sheer volume of vulnerabilities discovered daily means that sometimes data needs improvement. At Anchore, we’re working to enhance this ecosystem through open-source contributions, and we need your help.
Why Vulnerability Data Matters
When you run a security scanner like Grype, it relies on vulnerability data to determine if your software components have known security issues. This data includes crucial details like:
- Which versions of software are affected
- How the vulnerability can be exploited
- What versions contain the fix
However, this data isn’t always perfect. Sometimes, version ranges are incorrect, package names don’t match reality, or the metadata needs enrichment. These inaccuracies can lead to false positives (flagging secure components as vulnerable) and false negatives (missing actual vulnerabilities).
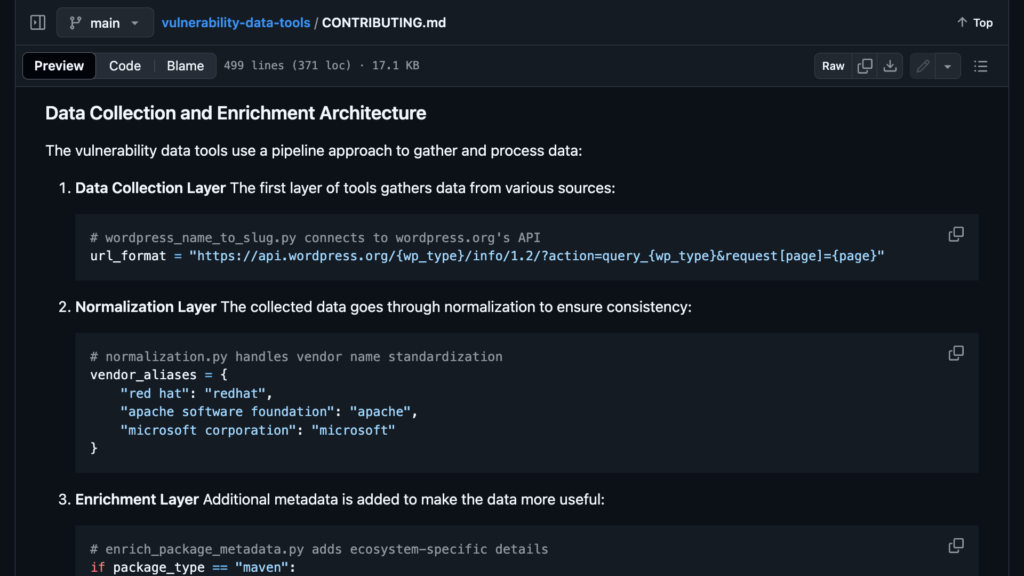
Our Approach to Better Data
We maintain a set of open-source repositories that help improve vulnerability data quality:
- A data enrichment repository where contributors can submit corrections
- Tools for processing and validating these corrections
- Generated outputs that integrate with existing vulnerability databases
This approach allows us to fix inaccuracies quickly and share these improvements with the broader security community. For example, we’ve helped correct version ranges for Java packages where the official data was incomplete and added missing metadata for WordPress plugins.
How You Can Help
We’ve published a comprehensive technical guide for contributors, but here’s the quick version:
- Find an Issue: Maybe you’ve noticed incorrect version information in a CVE, or you’re aware of missing package metadata
- Make the Fix: Clone our repository and use our tools to create or update the relevant records
- Submit a Pull Request: Share your improvements with the community
The most valuable contributions often come from security researchers and developers encountering data issues daily. Your real-world experience helps identify where the data needs improvement.
Impact of Contributions
Every contribution helps make security tooling more accurate for everyone. When you fix a false positive, you help thousands of developers avoid unnecessary security alerts. When you add missing metadata, you help security tools better understand the software ecosystem.
These improvements benefit individual developers using our open-source tools like Grype and major organizations, including Microsoft, Cisco, and various government agencies. By contributing, you’ll help make the entire software supply chain more secure.
Getting Started
Ready to contribute? Here’s what to do next:
- Check out our technical guide for detailed setup instructions
- Join our community forum to connect with other contributors
- Start with small improvements – even fixing one incorrect version range makes a difference
The security community strengthens when we work together. Your contributions, whether big or small, help make vulnerability data more accurate for everyone. Let’s improve software security one pull request at a time.
The future of SBOMs with Kate Stewart
Beyond Compliance: Exploring the Evolution & Future of Software Bill of Materials
Making Virtual Machine Security Analysis Easier with sbom-vm
Security professionals often need to analyze the contents of virtual machines (VMs) to generate Software Bills of Materials (SBOMs). This seemingly straightforward task can become surprisingly complex. I’d like to introduce sbom-vm, a prototype tool I created to simplify this process.
The Current Challenge
Security teams typically use tools such as Syft to generate SBOMs by running it directly inside virtual machines. While this approach works, it comes with significant limitations. VMs with constrained resources can experience out-of-memory errors during scanning. Large filesystems containing millions of files can lead to scans that take hours or even days. In some environments, running analysis tools inside production VMs isn’t permitted at all.
These limitations surfaced through various user reports and feature requests in the Syft project. While Syft and other libraries, such as stereoscope could be extended to handle VM disk images directly, users needed a solution today.
A New Approach with sbom-vm
I developed sbom-vm over a weekend to tackle this challenge from a different angle. Instead of operating inside the virtual machine, sbom-vm works directly with VM disk images from the host system. The tool mounts these images in read-only mode using qemu-nbd, automatically detects and mounts common filesystem types, and runs Syft against the mounted filesystem from the host system.
This approach fundamentally changes how we analyze VM contents. Running outside the virtual machine, sbom-vm sidesteps resource constraints and performance limitations. The read-only nature of all operations ensures the safety of the source material, while support for multiple disk formats and filesystem types provides broad compatibility.
Technical Implementation
At its core, sbom-vm leverages standard Linux utilities to handle disk images safely. Here’s an example of how it manages filesystem mounting:
def mount_filesystem(self):
    self.mounted_partition = self.find_filesystem_partition()
    self.mount_point.mkdir(parents=True, exist_ok=True)

    # Get filesystem type
    result = self._run_command(["blkid", "-o", "value", "-s", "TYPE",
                              self.mounted_partition])
    fs_type = result.stdout.strip().lower()

    logger.info(f"Mounting {fs_type} filesystem")

    if fs_type == "zfs_member":
        self._handle_zfs(self.mounted_partition)
    elif fs_type == "btrfs":
        mount_opts = ["mount", "-t", "btrfs", "-o", "ro"]
        self._run_command(mount_opts + [self.mounted_partition,
                         str(self.mount_point)])
The tool currently supports multiple disk formats, including qcow2 and vmdk, along with common filesystems such as ext4, ZFS, BTRFS, NTFS, HFS+, and APFS. This broad compatibility ensures it works with most virtual machine images you’ll likely encounter. But it’s early days—I don’t know what crazy filesystems and disk image systems others may have.
Getting Started
To try sbom-vm, you’ll need a Linux system with some common utilities installed:
# Install Syft, so we can generate an SBOM from the VM
# See also: https://github.com/anchore/syft
$ snap install syft

# Install Linux utilities to manage disk images
$ sudo apt install qemu-utils gdisk fdisk parted util-linux

# Grab sbom-vm from GitHub
$ git clone https://github.com/popey/sbom-vm
$ cd sbom-vm
There’s a script provided to generate test images:
# Generate/download some test images to play with
$ sudo ./generate-test-images.py
Generating the test images doesn’t take long:

Now you can scan the images with sbom-vm!
# Run sbom-vm against one of the test images.
$ sudo ./sbom-vm.py ./test_images/ubuntu_22.04_zfs.qcow2
Here’s what that looks like, slightly speeded up:

Future Development
So, while sbom-vm provides a practical solution today, there’s room for enhancement. Future development could add support for additional disk image formats, enhance filesystem type detection, and integrate with cloud provider VM snapshots. Performance optimizations for large filesystems and potential integration with Syft’s native capabilities are also on the roadmap.
Join the Project
sbom-vm is open source under the MIT license, and I welcome contributions. Whether you’re interested in adding support for new filesystem types, improving documentation, or reporting issues, you can find the project on GitHub at https://github.com/popey/sbom-vm.
While sbom-vm began as a weekend project, it potentially provides immediate value for security professionals who need to analyze VM disk images. It demonstrates how targeted solutions can bridge gaps in the security toolchain while considering more extensive architectural changes.
If you’d like to get updates about the Anchore Open Source Community, sign up for our low-traffic community newsletter and drop by our community discourse.
Community Spotlight: Laurent Goderre (Docker)
How to Unlock Enterprise Value with SBOMs
Use cases for Security, Engineering, Compliance, Legal and Sales
Anchore Community Spotlight: Nicolas Vuillamy from MegaLinter
Want to learn how a powerful open-source linting tool that supports over 50 programming languages came to be? Join us for an engaging conversation with Nicolas Vuillamy, the creator of MegaLinter, as he shares the journey from its Bash origins to becoming a comprehensive static code analysis solution developers use worldwide.
In this discussion, Nicolas explores:
– The evolution and core features of MegaLinter
– Why static code analysis matters for development teams
– How MegaLinter helps maintain code quality and security
– Tips for getting started with the tool
– How MegaLinter leverages Syft and Grype to generate SBOMs and create vulnerability reports
Watch the whole discussion on YouTube to dive deeper into Nicolas’s insights and learn how MegaLinter can enhance your development workflow.
Stay updated on future community spotlights and events by subscribing to our community newsletter.
SBOM 101: Understand, Implement & Leverage SBOMs for Stronger Security & Risk Management
A Guide for Developers, Security Engineers & the DevSecOps Community
Community Spotlight: MegaLinter
SBOMs 101: A Free, Open Source eBook for the DevSecOps Community
Today, we’re excited to announce the launch of “Software Bill of Materials 101: A Guide for Developers, Security Engineers, and the DevSecOps Community”. This eBook is free and open source resource that provides a comprehensive introduction to all things SBOMs.
Why We Created This Guide
While SBOMs have become increasingly critical for software supply chain security, many developers and security professionals still struggle to understand and implement them effectively. We created this guide to help bridge that knowledge gap, drawing on our experience building popular SBOM tools like Syft.
What’s Inside
The ebook covers essential SBOM topics, including:
- Core concepts and evolution of SBOMs
- Different SBOM formats (SPDX, CycloneDX) and their use cases
- Best practices for generating and managing SBOMs
- Real-world examples of SBOM deployments at scale
- Practical guidance for integrating SBOMs into DevSecOps pipelines
We’ve structured the content to be accessible to newcomers while providing enough depth for experienced practitioners looking to expand their knowledge.
Community-Driven Development
This guide is published under an open source license and hosted on GitHub at https://github.com/anchore/sbom-ebook. The collective wisdom of the DevSecOps community will strengthen this resource over time. We welcome contributions whether fixes, new content, or translations.
Getting Started
You can read the guide online, download PDF/ePub versions, or clone the repository to build it locally. The source is in Markdown format, making it easy to contribute improvements.
Join Us
We invite you to:
- Read the guide at https://github.com/anchore/sbom-ebook
- Star the repository to show your support
- Share feedback through GitHub issues
- Contribute improvements via pull requests
- Help spread the word about SBOM best practices
The software supply chain security challenges we face require community collaboration. We hope this guide advances our collective understanding of SBOMs and their role in securing the software ecosystem.
Learn about the role that SBOMs play for the security of your organization in this white paper.
Increase Supply Chain Transparency & Security with Harbor and Anchore
Rocky Mountain Cyber Symposium 2025
WEST 2025
Going All In: Anchore at SBOM Plugfest 2024
When we were invited to participate in Carnegie Mellon University’s Software Engineering Institute (SEI) SBOM Harmonization Plugfest 2024, we saw an opportunity to contribute to SBOM generation standardization efforts and thoroughly exercise our open-source SBOM generator, Syft.
While the Plugfest only required two SBOM submissions, we decided to go all in – and learned some valuable lessons along the way.
The Plugfest Challenge
The SBOM Harmonization Plugfest aims to understand why different tools generate different SBOMs for the same software. It’s not a competition but a collaborative study to improve SBOM implementation harmonization. The organizers selected eight diverse software projects, ranging from Node.js applications to C++ libraries, and asked participants to generate SBOMs in standard formats like SPDX and CycloneDX.
Going Beyond the Minimum
Instead of just submitting two SBOMs, we decided to:
- SBOM generation for all eight target projects
- Create both source and binary analysis SBOMs where possible
- Output in every format Syft supports
- Test both enriched and non-enriched versions
- Validate everything thoroughly
This comprehensive approach would give us (and the broader community) much more data to work with.
Automation: The Key to Scale
To handle this expanded scope, we created a suite of scripts to automate the entire process:
- Target acquisition
- Source SBOM generation
- Binary building
- Binary SBOM generation
- SBOM validation
The entire pipeline runs in about 38 minutes on a well-connected server, generating nearly three hundred SBOMs across different formats and configurations.
The Power of Enrichment
One of Syft’s interesting features is its --enrich option, which can enhance SBOMs with additional metadata from online sources. Here’s a real example showing the difference in a CycloneDX SBOM for Dependency-Track:
$ wc -l dependency-track/cyclonedx-json.json dependency-track/cyclonedx-json_enriched.json
  5494 dependency-track/cyclonedx-json.json
  6117 dependency-track/cyclonedx-json_enriched.json
The enriched version contains additional information like license URLs and CPE identifiers:
{
  "license": {
    "name": "Apache 2",
    "url": "http://www.apache.org/licenses/LICENSE-2.0"
  },
  "cpe": "cpe:2.3:a:org.sonatype.oss:JUnitParams:1.1.1:*:*:*:*:*:*:*"
}
These additional identifiers are crucial for security and compliance teams – license URLs help automate legal compliance checks, while CPE identifiers enable consistent vulnerability matching across security tools.
SBOM Generation of Binaries
While source code analysis is valuable, many Syft users analyze built artifacts and containers. This reflects real-world usage where organizations must understand what’s being deployed, not just what’s in the source code. We built and analyzed binaries for most target projects:
| Package | Build Method | Key Findings |
|---|---|---|
| Dependency Track | Docker | The container SBOMs included ~1000 more items than source analysis, including base image components like Debian packages |
| HTTPie | pip install | Binary analysis caught runtime Python dependencies not visible in source |
| jq | Docker | Python dependencies contributed significant additional packages |
| Minecolonies | Gradle | Java runtime java archives appeared in binary analysis, but not in the source |
| OpenCV | CMake | Binary and source SBOMs were largely the same |
| hexyl | Cargo build | Rust static linking meant minimal difference from source |
| nodejs-goof | Docker | Node.js runtime and base image packages significantly increased the component count |
Some projects, like gin-gonic (a library) and PHPMailer, weren’t built as they’re not typically used as standalone binaries.
The differences between source and binary SBOMs were striking. For example, the Dependency-Track container SBOM revealed:
- Base image operating system packages
- Runtime dependencies not visible in source analysis
- Additional layers of dependencies from the build process
- System libraries and tools included in the container
This perfectly illustrates why both source and binary analysis are important:
- Source SBOMs show some direct development dependencies
- Binary/container SBOMs show the complete runtime environment
- Together, they provide a full picture of the software supply chain
Organizations can leverage these differences in their CI/CD pipelines – using source SBOMs for early development security checks and binary/container SBOMs for final deployment validation and runtime security monitoring.
Unexpected Discovery: SBOM Generation Bug
One of the most valuable outcomes wasn’t planned at all. During our comprehensive testing, we discovered a bug in Syft’s SPDX document generation. The SPDX validators were flagging our documents as invalid due to absolute file paths:
file name must not be an absolute path starting with "/", but is:
/.github/actions/bootstrap/action.yaml
file name must not be an absolute path starting with "/", but is:
/.github/workflows/benchmark-testing.yaml
file name must not be an absolute path starting with "/", but is:
/.github/workflows/dependabot-automation.yaml
file name must not be an absolute path starting with "/", but is:
/.github/workflows/oss-project-board-add.yaml
The SPDX specification requires relative file paths in the SBOM, but Syft used absolute paths. Our team quickly developed a fix, which involved converting absolute paths to relative ones in the format model logic:
// spdx requires that the file name field is a relative filename
// with the root of the package archive or directory
func convertAbsoluteToRelative(absPath string) (string, error) {
    // Ensure the absolute path is absolute (although it should already be)
    if !path.IsAbs(absPath) {
        // already relative
        log.Debugf("%s is already relative", absPath)
        return absPath, nil
    }
    // we use "/" here given that we're converting absolute paths from root to relative
    relPath, found := strings.CutPrefix(absPath, "/")
    if !found {
        return "", fmt.Errorf("error calculating relative path: %s", absPath)
    }
    return relPath, nil
}
The fix was simple but effective – stripping the leading “/” from absolute paths while maintaining proper error handling and logging. This change was incorporated into Syft v1.18.0, which we used for our final Plugfest submissions.
This discovery highlights the value of comprehensive testing and community engagement. What started as a participation in the Plugfest ended up improving Syft for all users, ensuring more standard-compliant SPDX documents. It’s a perfect example of how collaborative efforts like the Plugfest can benefit the entire SBOM ecosystem.
SBOM Validation
We used multiple validation tools to verify our SBOMs:
- CycloneDX’s sbom-utility
- SPDX’s pyspdxtools
- NTIA’s online validator
Interestingly, we found some disparities between validators. For example, some enriched SBOMs that passed sbom-utility validation failed with pyspdxtools. Further, the NTA online validator gave us another different result in many cases. This highlights the ongoing challenges in SBOM standardization – even the tools that check SBOM validity don’t always agree!
Key Takeaways
- Automation is crucial: Our scripted approach allowed us to efficiently generate and validate hundreds of SBOMs.
- Real-world testing matters: Building and analyzing binaries revealed insights (and bugs!) that source-only analysis might have missed.
- Enrichment adds value: Additional metadata can significantly enhance SBOM utility, though support varies by ecosystem.
- Validation is complex: Different validators can give different results, showing the need for further standardization.
Looking Forward
The SBOM Harmonization Plugfest results will be analyzed in early 2025, and we’re eager to see how different tools handled the same targets. Our comprehensive submission will help identify areas where SBOM generation can be improved and standardized.
More importantly, this exercise has already improved Syft for our users through the bug fix and given us valuable insights for future development. We’re committed to continuing this thorough testing and community participation to make SBOM generation more reliable and consistent for everyone.
The final SBOMs are published in the plugfest-sboms repo, with the scripts in the plugfest-scripts repository. Consider using Syft for SBOM generation against your code and containers, and let us know how you get on in our community discourse.
Understanding SBOMs: Deep Dive with Kate Stewart
Understanding SBOMs: How to Automate, Generate and Manage SBOMs
Understanding SBOMs: An Introduction to Modern Development
Enhancing Container Security with NVIDIA’s AI Blueprint and Anchore’s Syft
Container security is critical – one breach can lead to devastating data losses and business disruption. NVIDIA’s new AI Blueprint for Vulnerability Analysis transforms how organizations handle these risks by automating vulnerability detection and analysis. For enhanced container security, this AI-powered solution is a potential game-changer.
At its core, the Blueprint combines AI-driven scanning with NVIDIA’s Morpheus Cybersecurity SDK to identify vulnerabilities in seconds rather than hours or days for enhanced container security. The system works through a straightforward process:
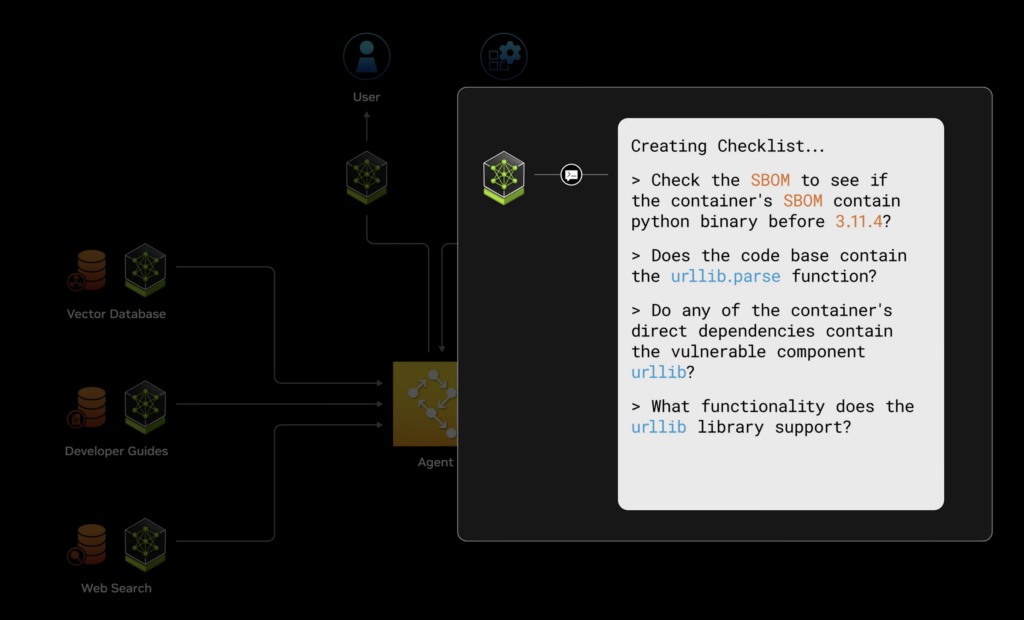
First, it generates a Software Bill of Materials (SBOM) using Syft, Anchore’s open-source tool. This tool creates a detailed inventory of all software components in a container. This SBOM feeds into an AI pipeline that leverages large language models (LLMs) and retrieval-augmented generation (RAG) to analyze potential vulnerabilities for enhanced container security.
The AI examines multiple data sources – from code repositories to vulnerability databases – and produces a detailed analysis of each potential threat. Most importantly, it distinguishes between genuine security risks and false positives by considering environmental factors and dependency requirements.
The system then provides clear recommendations through a standardized Vulnerability Exploitability eXchange (VEX) status, as illustrated below. Container security is further enhanced by these clear recommendations.
This Blueprint is particularly valuable because it automates traditional manual security analysis. Security teams can stop spending days investigating potential vulnerabilities and focus on addressing confirmed threats. This efficiency is invaluable for organizations managing container security at scale with enhanced container security solutions.
Want to try it yourself? Check out the Blueprint, read more in the NVIDIA blog post, and explore the vulnerability-analysis git repo. Let us know if you’ve tried this out with Syft, over on the Anchore Community Discourse.
2024 Software Supply Chain Security Report
2024 Trends in Software Supply Chain Security
Anchore Survey 2024: Only 1 in 5 organizations have full visibility of open source
The Anchore 2024 Software Supply Chain Security Report is now available. This report provides a unique set of insights into the experiences and practices of over 100 organizations that are the targets of software supply chain attacks.
Survey Highlights
The survey shows that amid growing software supply chain risks:
- The intensity of software supply chain attacks is increasing.
- 200% increase in the priority of software supply chain security.
- Only 1 in 5 have full visibility of open source.
- Third-party software joins open source as a top security challenge.
- Organizations must comply with an average of 4.9 standards.
- 78% plan to increase SBOM usage.
- Respondents worry about AI’s impact on software supply chain security.
The intensity of software supply chain attacks is increasing.
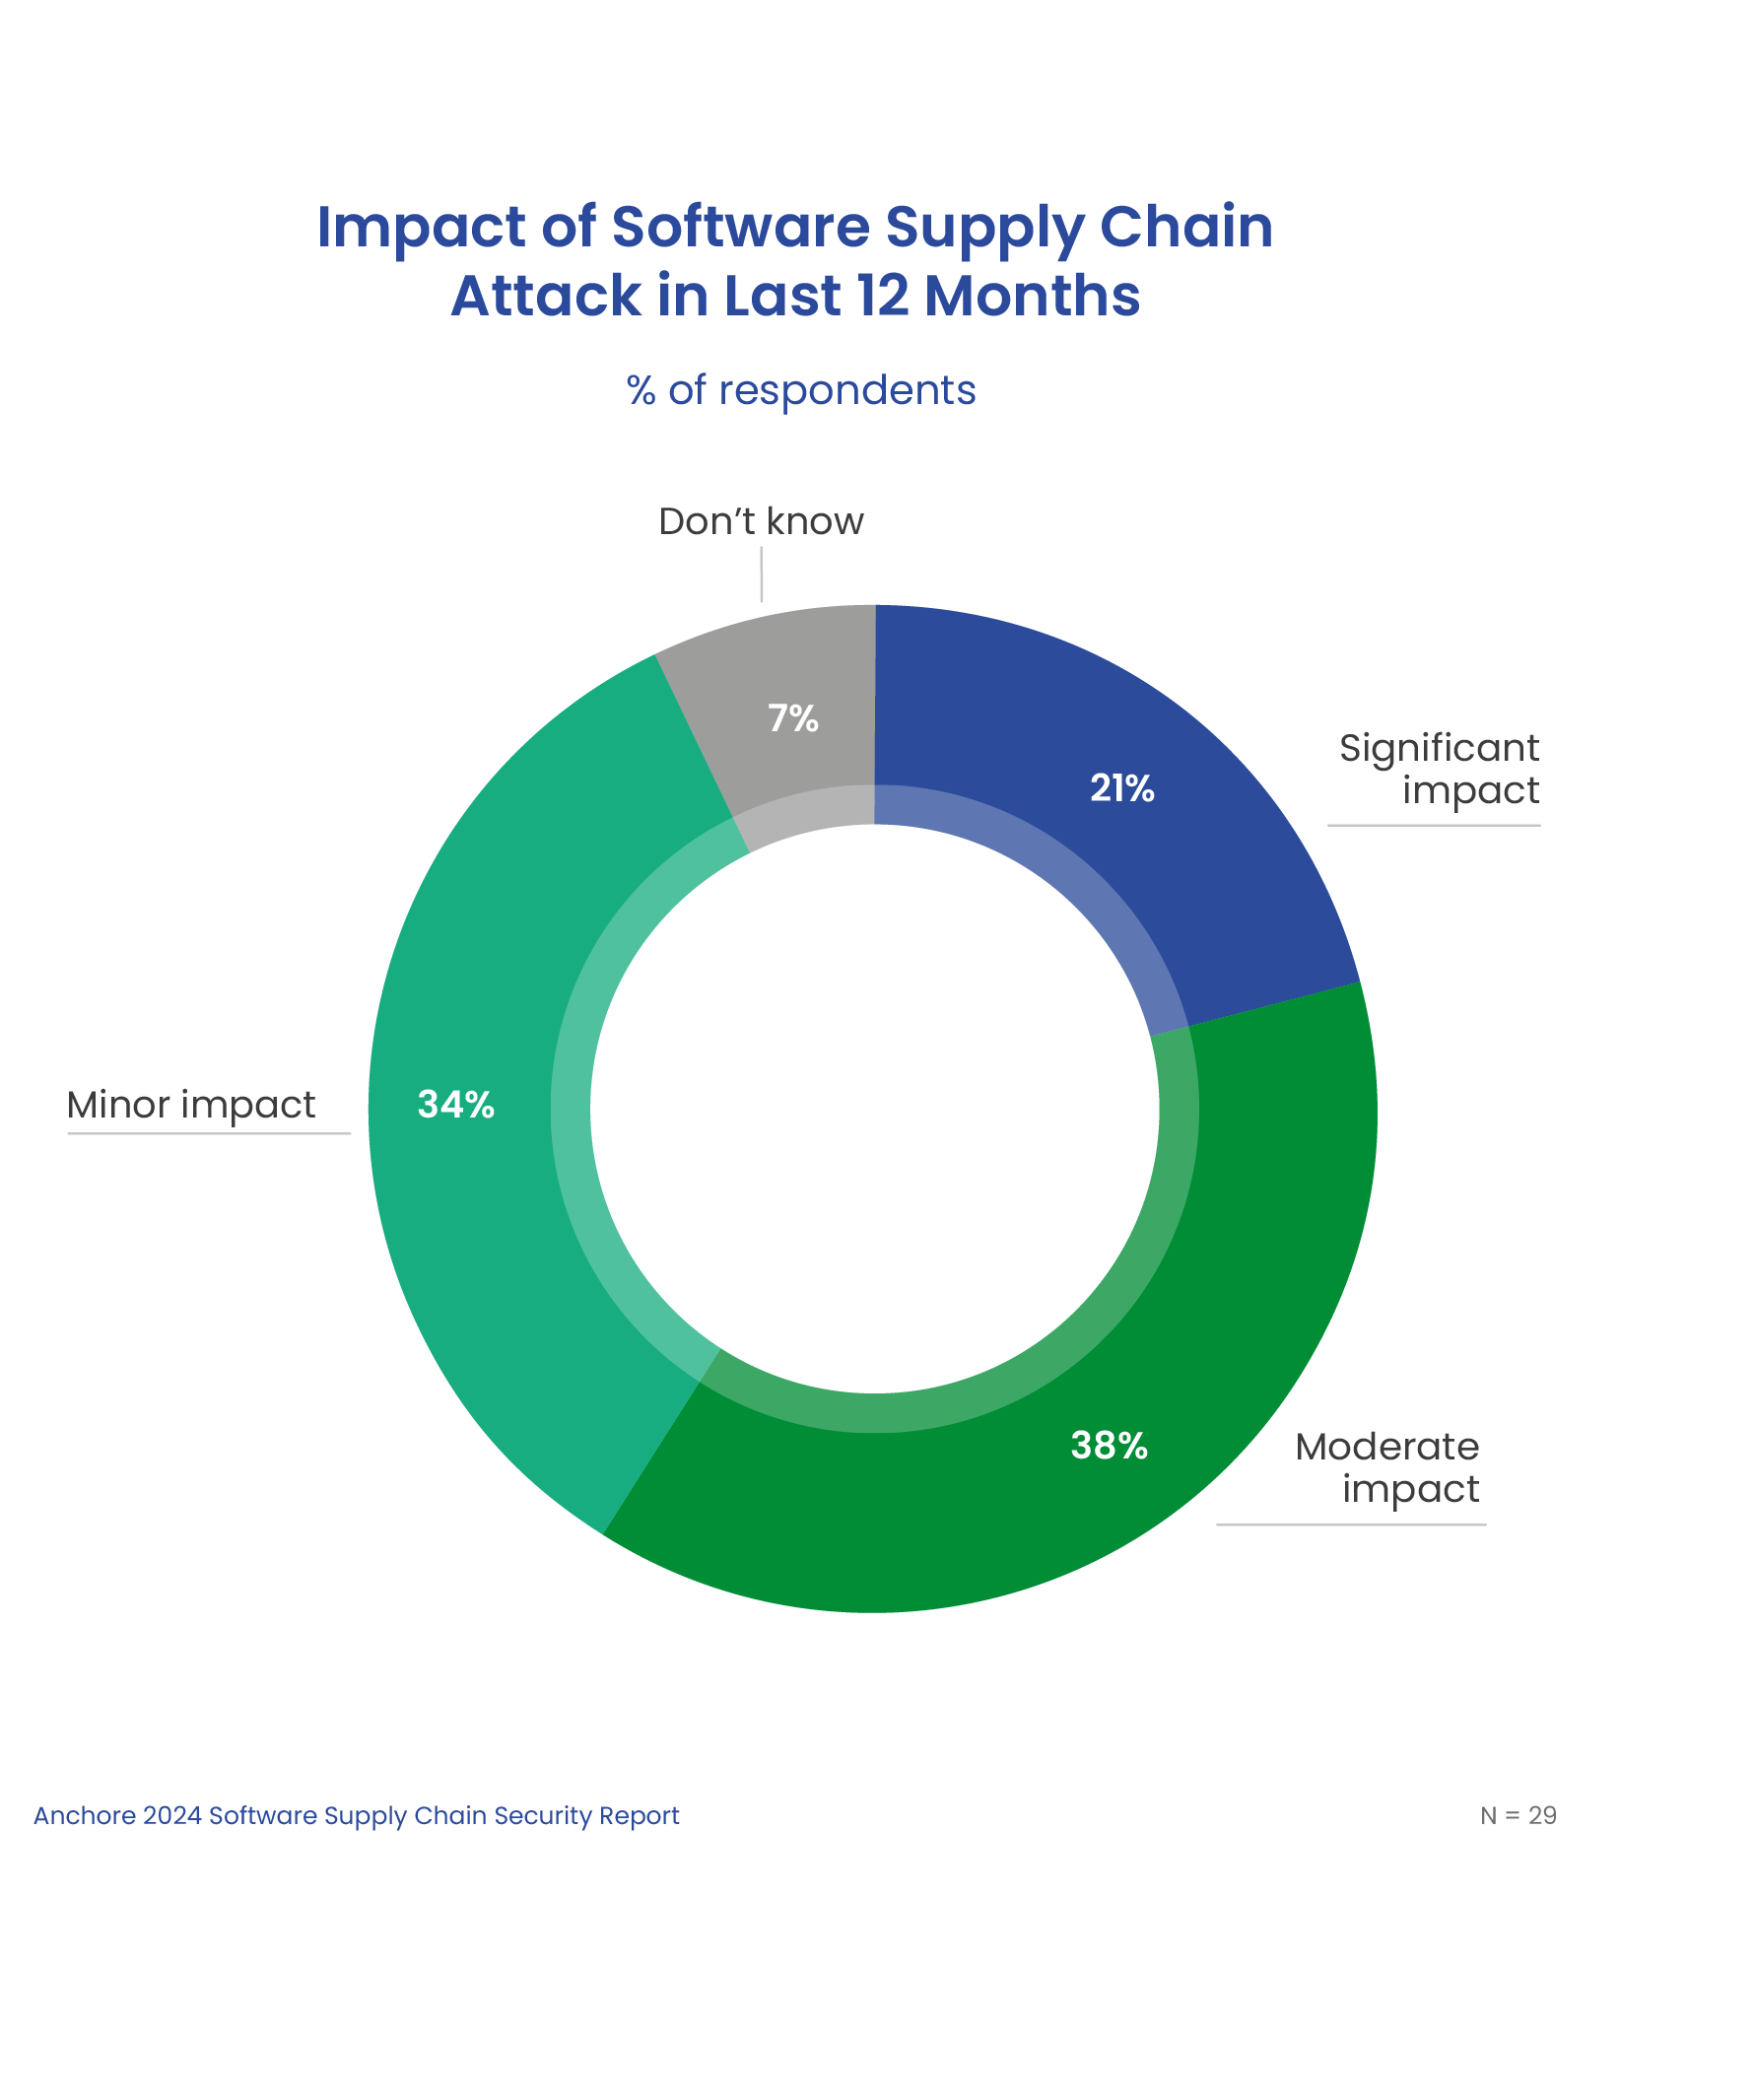
The survey shows that the intensity of software supply chain attacks is increasing, with 21% of successful supply chain attacks having a significant impact, more than doubling from 10% in 2022.
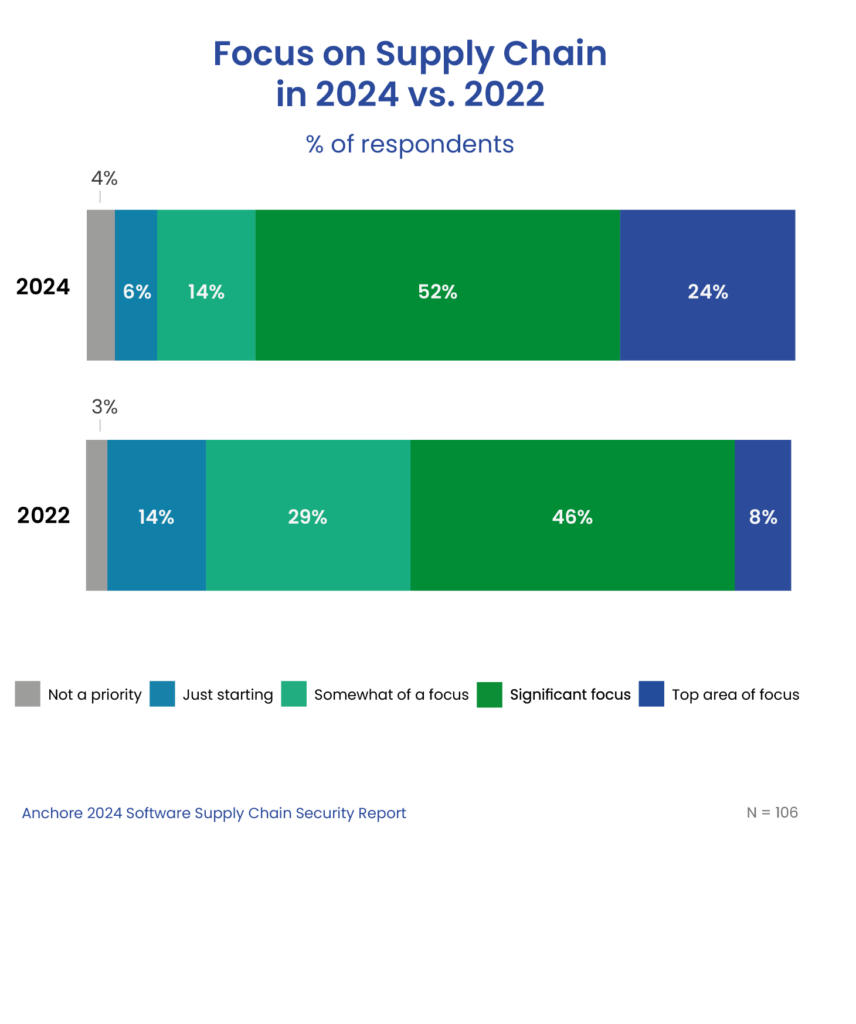
200% increase in the priority of software supply chain security.
As a result of increased attacks, organizations are increasing their focus on software supply chain security, with a 200% increase in organizations making it a top priority.
Only 1 in 5 have full visibility of open source.
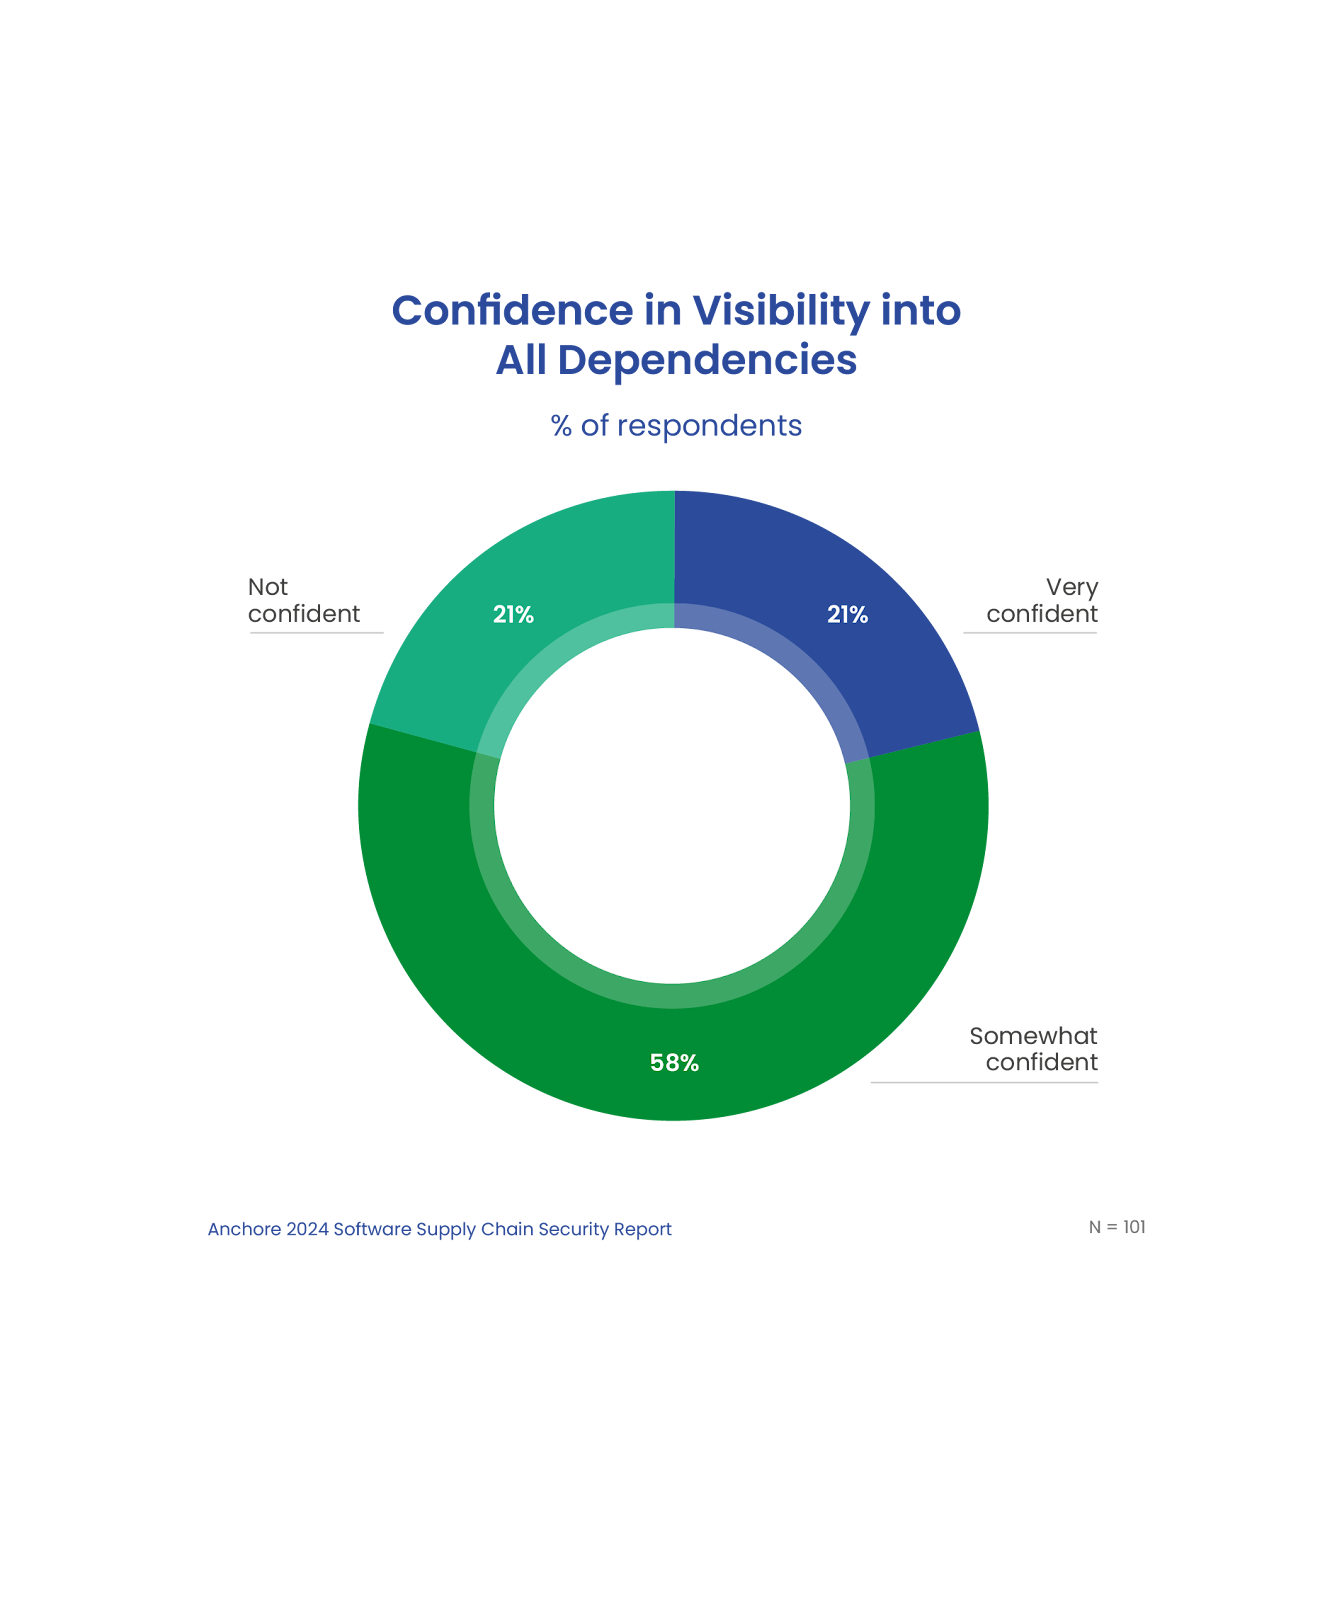
Amid growing software supply chain risks, only 21% of respondents are very confident that they have complete visibility into all the dependencies of the applications their organization builds. Without this critical foundation, organizations are unaware of vulnerabilities that leave them open to supply chain attacks.
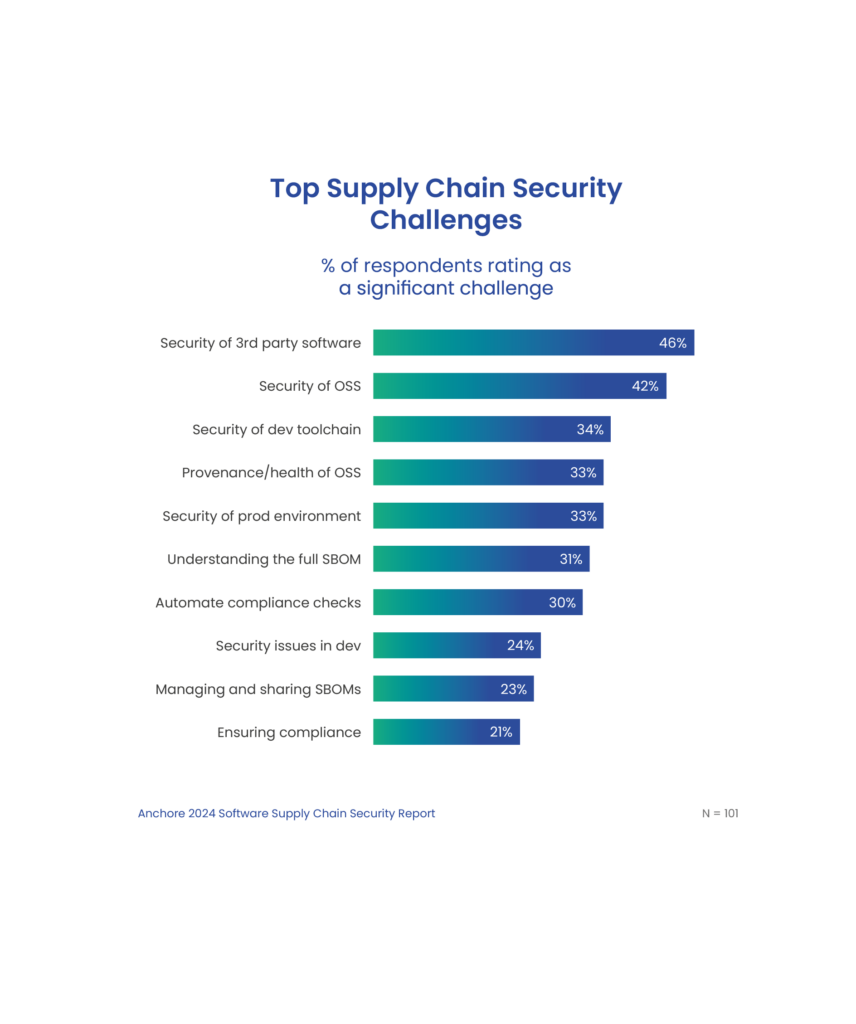
Third-party software joins open source as a top security challenge.
Organizations are looking to secure all elements of their software supply chain, including open source software and 3rd party libraries. While the security of open source software continues to be identified as a significant challenge, in this year’s report, 46% of respondents chose the security of 3rd party software as a significant challenge.
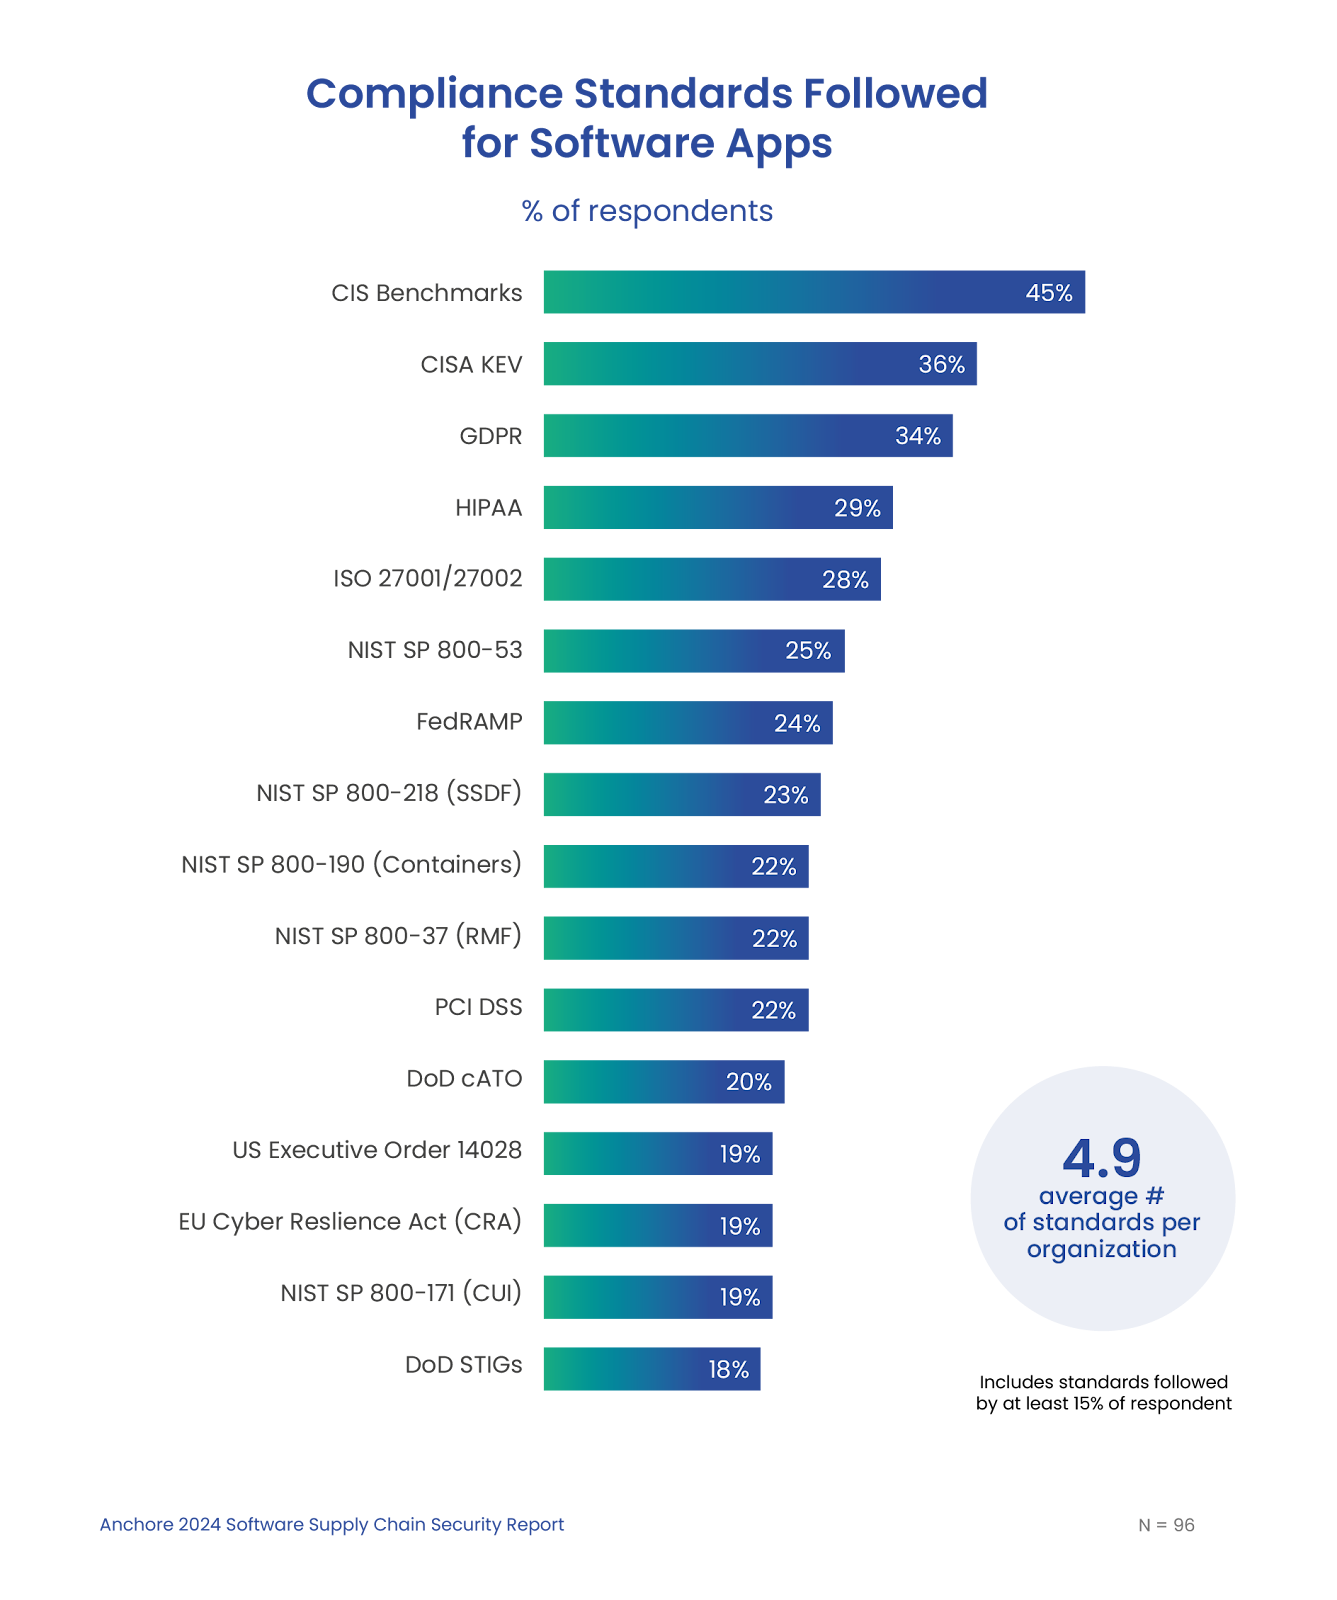
Organizations must comply with an average of 4.9 different standards.
Compliance is a significant driver in supply chain security. As software supply chain risks grow, governments and industry groups are responding with new guidelines and regulations. Respondents reported the need to comply with an average of almost five separate standards per organization. Many must comply with new regulatory requirements including the CISA Directive of Known Exploited Vulnerabilities, the Secure Software Development Framework (SSDF), and the EU Cyber Resilience Act.
78% plan to increase SBOM usage.
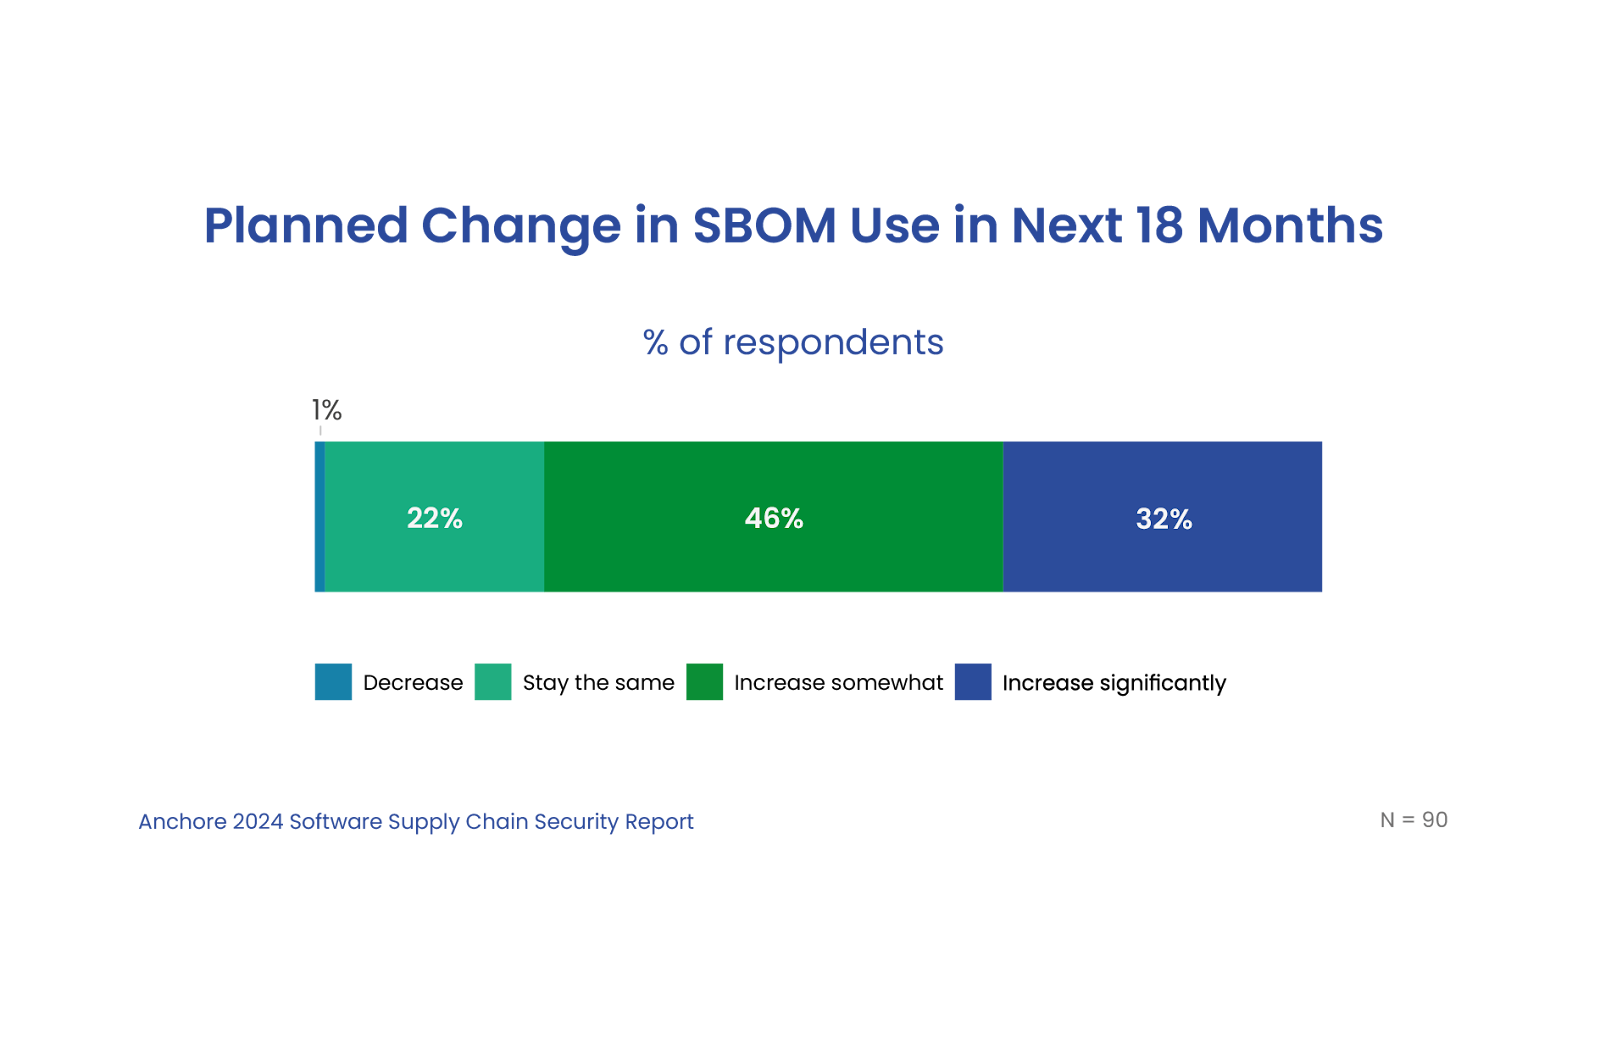
The software bill-of-materials (SBOM) is now a critical component of software supply chain security. An SBOM provides visibility into software ingredients and is a foundation for understanding software vulnerabilities and risks. While just under half of respondents currently leverage SBOMs, a large majority plan to increase SBOM use over the next 18 months.
Respondents worry about AI’s impact on software supply chain security.
A large majority of respondents are concerned about AI’s impact on software supply chain security, and as many as a third are very concerned. The highest concerns are with code tested with AI and code generated with AI or with Copilot tools.
Let’s design an action plan

Join on December 10, 2024 for a live discussion with VP of Security Josh Bressers on the latest trends. Hear practical steps for building a more resilient software supply chain. Register Now.
To minimize risk, avoid reputational damage, and protect downstream users and customers, software supply chain security must become a new practice for every organization that uses or builds software. SBOMs are a critical foundation of this new practice, providing visibility into the dependencies and risks of the software you use.
Here are seven steps to take your software supply chain security to the next level:
- Assess your software supply chain maturity against best practices.
- Identify key challenges and create a plan to make tangible improvements over the coming months.
- Develop a methodology to document and assess the impact of supply chain attacks on your organization, along with improvements to be made.
- Create a plan to generate, manage, and share SBOMs as a key pillar of your supply chain security initiative. Learn more with the Expert Guide on SBOMs in Cybersecurity and 6 Ways to Prevent SBOM sprawl.
- Delve into existing and emerging compliance requirements and create a plan to automate compliance checks. Learn how to meet compliance standards like NIST, SSDF, and FedRAMP.
- Identify gaps in tooling and create plans to address the gaps. See how Anchore can help. Try open source tools like Syft for SBOM generation and Grype for vulnerability scanning as a good way to get started.
- Create an organizational structure and define responsibilities to address software supply chain security and risk.
Tonight’s Movie: The Terminal (of your laptop)
A picture paints a thousand words, but a GIF shows every typo in motion. But it doesn’t have to! GIFs have long been the go-to in technical docs, capturing real-time terminal output and letting readers watch workflows unfold as if sitting beside you.
I recently needed to make some terminal GIFs, so I tried three of the best available tools, and here are my findings.
Requirements
We recently attended All Things Open, where a TV on our stand needed a rolling demo video. I wanted to add a few terminal usage examples for Syft, Grype, and Grant – our Open-Source, best-in-class container security tools. I tried a few tools to generate the GIFs, which I embedded in a set of Google Slides (for ease) and then captured and rendered as a video that played in a loop on a laptop running VLC.
To summarise, this was the intended flow:
Typing in a terminal →
 ↳ Recording
  ↳ GIF
   ↳ Google Slides
    ↳ Video Capture
     ↳ VLC playlist
      ↳ Success 🎉
We decided to render it as a video to mitigate conference WiFi issues. Nobody wants to walk past your exhibitor stand and see a 404 or “Network Connectivity Problems” on the Jumbotron®️!

The goal was for attendees passing our stand to see the command-line utilities in action. It also allowed us to discuss the demos with interested conferencegoers without busting out a laptop and crouching around it. We just pointed to the screen as a terminal appeared and talked through it.
Below is an early iteration of what I was aiming for, taken as a frame grab from a video – hence the slight blur.
My requirements were for a utility which:
- Records a terminal running commands
- Runs on Linux and macOS because I use both
- Reliably captures output from the commands being run
- Renders out a high-quality GIF
- Is preferably open source
- Is actively maintained
The reason for requiring a GIF rather than a traditional video, such as MP4, is to embed the GIF easily in a Google Slides presentation. While I could create an MP4 and then use a video editor to cut together the videos, I wanted something simple and easily reproducible. I may use MP4s in other situations – such as posting to social media – so if a tool can export to that format easily, I consider that a bonus.
It is worth noting that Google Slides supports GIFs up to 1000 frames in length. So, if you have a long-running command captured at a high frame rate, this limit is easy to hit. If that is the case, perhaps render an MP4 and use the right tool for the job, a video editor.
“High quality” GIF is a subjective term, but I’m after something that looks pleasing (to me), doesn’t distract from the tool being demonstrated, and doesn’t visibly stutter.
Feature Summary
I’ve put the full summary up here near the top of the article to save wear & tear on your mouse wheel or while your magic mouse is upside down, on charge. The details are underneath the conclusion for those interested and equipped with a fully-charged mouse.
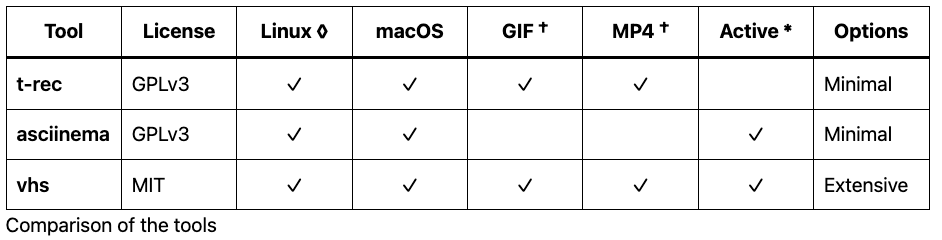
† asciinema requires an additional tool such as agg to convert the recorded output to a GIF.
◊ t-rec supports X11 on Linux, but currently does not support Wayland sessions.
* t-rec development appears to have stalled.
Conclusion
All three tools are widely used and work fine in many cases. Asciinema is often recommended because it’s straightforward to install, and almost no configuration is required. The resulting recordings can be published online and rendered on a web page.
While t-rec is interesting, as it records the actual terminal window, not just the session text (as asciinema does), it is a touch heavyweight. As such, with a 4fps frame rate, videos made with t-rec look jerky.
I selected vhs for a few reasons.
It runs easily on macOS and Linux, so I can create GIFs on my work or personal computer with the same tool. vhs is very configurable, supports higher frame rates than other tools, and is scriptable, making it ideal for creating GIFs for documentation in CI pipelines.
vhs being scriptable is, I think, the real superpower here. For example, vhs can be part of a documentation site build system. One configuration file can specify a particular font family, size and color scheme to generate a GIF suitable for embedding in documentation.
Another almost identical configuration file might use a different font size or color, which is more suitable for a social media post. The same commands will be run, but the color, font family, font size, and even GIF resolution can be different, making for a very flexible and reliable way to create a terminal GIF for any occasion!
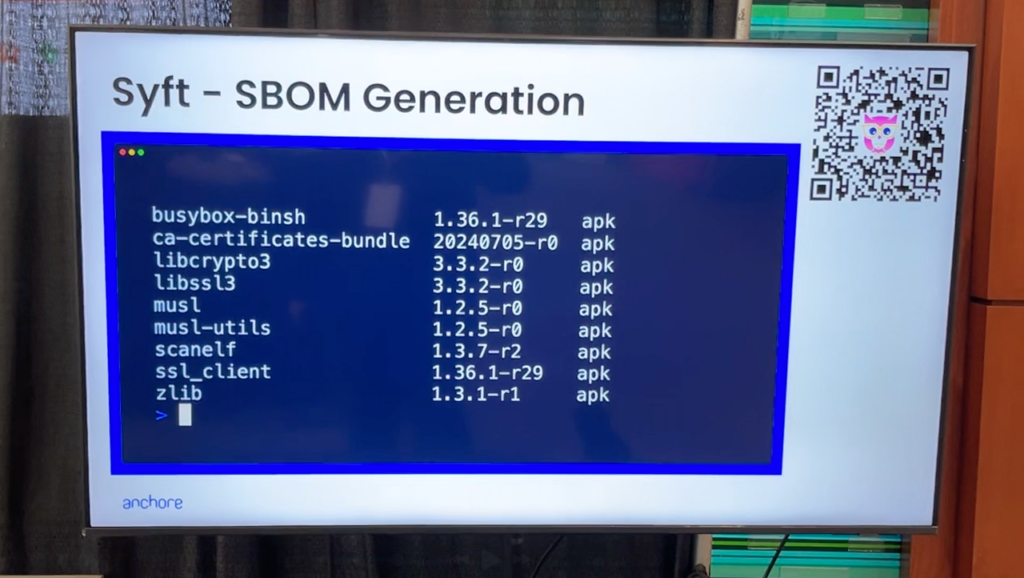
vhs ships with a broad default theme set that matches typical desktop color schemes, such as the familiar purple-hue terminal on Ubuntu, as seen below. This GIF uses the “BlexMono Nerd Font Mono” font (a modified version of IBM Plex font), part of the nerd-fonts project.
If this GIF seems slow, that’s intentional. The vhs configuration can “type” at a configurable speed and slow the resulting captured output down (or speed it up).

There are also popular Catppuccin themes that are pretty appealing. The following GIF uses the “catppuccin-macchiato” theme with “Iosevka Term” font, which is part of the Iosevka project. I also added a PS1 environment variable to the configuration to simulate a typical console prompt.

vhs can also take a still screenshot during the recording, which can be helpful as a thumbnail image, or to capture a particular frame from the middle of the recording. Below is the final frame from the previous GIF.
Here is one of the final (non-animated) slides from the video. I tried to put as little as possible on screen simultaneously, just the title, video, and a QR code for more information. It worked well, with someone even asking how the terminal videos were made. This blog is for them.
I am very happy with the results from vhs, and will likely continue using it in documentation, and perhaps social posts – if I can get the font to a readable size on mobile devices.
Alternatives
I’m aware of OBS Studio and other screen (and window) recording tools that could be used to create an initial video, which could be converted into a GIF.
Are there other, better ways to do this?
Let me know on our community discourse, or leave a comment wherever you read this blog post.
Below are the details about each of the three tools I tested.
t-rec
t-rec is a “Blazingly fast terminal recorder that generates animated gif images for the web written in rust.” This was my first choice, as I had played with it before my current task came up.
I initially quite liked that t-rec recorded the entire terminal window, so when running on Linux, I could use a familiar desktop theme indicating to the viewer that the command is running on a Linux host. On a macOS host, I could use a native terminal (such as iTerm2) to hint that the command is run on an Apple computer.
However, I eventually decided this wasn’t that important at all. Especially given that vhs can be used to theme the terminal so it looks close to a particular host OS. Plus, most of the commands I’m recording are platform agnostic, producing the same output no matter what they’re running on.
t-rec Usage
- Configure the terminal to be the size you require with the desired font and any other settings before you start t-rec.
- Run
t-rec.
$ t-rec --quiet --output grantThe terminal will clear, and recording will begin.
- Type each command as you normally would.
- Press
CTRL+Dto end recording. t-recwill then generate the GIF using the specified name.
🎆 Applying effects to 118 frames (might take a bit)
💡 Tip: To add a pause at the end of the gif loop, use e.g. option `-e 3s`
🎉 🚀 Generating grant.gif
Time: ~9s
alan@Alans-MacBook-Pro ~ The output GIF will be written in the current directory by stitching together all the bitmap images taken during the recording. Note the recording below contains the entire terminal user interface and the content.
t-rec Benefits
t-rec records the video by taking actual bitmap screenshots of the entire terminal on every frame. So, if you’re keen on having a GIF that includes the terminal UI, including the top bar and other window chrome, then this may be for you.
t-rec Limitations
t-rec records at 4 frames per second, which may be sufficient but can look jerky with long commands. There is an unmerged draft PR to allow user-configurable recording frame rates, but it hasn’t been touched for a couple of years.
I found t-rec would frequently just stop adding frames to a GIF. So the resulting GIF would start okay, then randomly miss out most of the frames, abruptly end, and loop back to the start. I didn’t have time to debug why this happened, which got me looking for a different tool.
asciinema
“Did you try asciinema?” was a common question asked of me, when I mentioned to fellow nerds what I was trying to achieve. Yes.
asciinema is the venerable Grand-daddy of terminal recording. It’s straightforward to install and setup, has a very simple recording and publishing pipeline. Perhaps too simple.
When I wandered around the various exhibitor stands at All Things Open last week, it was obvious who spent far too long fiddling with these tools (me), and which vendors recorded a window, or published an asciinema, with some content blurred out.
One even had an ugly demo of our favorite child, grype (don’t tell syft I said that), in such a video! Horror of horrors!
asciinema doesn’t create GIFs directly but instead creates “cast” files, JSON formatted text representations of the session, containing both the user-entered text and the program output. A separate utility, agg (asciinema gif generator), converts the “cast” to a GIF. In addition, another tool, asciinema-edit, can be used to edit the cast file post-recording.
asciinema Usage
- Start
asciinemarec, and optionally specify a target file to save as.
asciinema rec ./grype.cast- Run commands.
- Type
exitwhen finished. - Play back the cast file
asciinema play ./grype.cast
- Convert asciinema recording to GIF.
agg --font-family "BlexMono Nerd Font Mono" grype.cast grype.gifHere’s the resulting GIF, using the above options. Overall, it looks fine, very much like my terminal appears. Some of the characters are missing or incorrectly displayed, however. For example, the animated braille characters are used while grype is parsing the container image.

asciinema – or rather agg (the cast-to-GIF converter) has a few options for customizing the resulting video. There are a small number of themes, the ability to configure the window size (in rows/columns), font family, and size, and set various speed and delay-related options.
Overall, asciinema is very capable, fast, and easy to use. The upstream developers are currently porting it from Python to Rust, so I’d consider this an active project. But it wasn’t entirely giving me all the options I wanted. It’s still a useful utility to keep in your toolbelt.
vhs
vhs has a novel approach using ‘tape’ files which describe the recording as a sequence of Type, Enter and Sleep statements.
The initial tape file can be created with vhs record and then edited in any standard text editor to modify commands, choice of shell, sleep durations, and other configuration settings. The vhs cassette.tape command will configure the session, then run the commands in a virtual (hidden) terminal.
Once the end of the ‘tape’ is reached, vhs generates the GIF, and optionally, an MP4 video. The tape file can be iterated on to change the theme, font family, size, and other settings, then re-running vhs cassette.tape creates a whole new GIF.
vhs Usage
- Create a .tape file with
vis record --shell bash > cassette.tape. - Run commands.
- Type
exitwhen finished.
vhs will write the commands and timings to the cassette.tape file, for example:
$ cat cassette.tape
Sleep 1.5s
Type "./grype ubuntu:latest"
Enter
Sleep 3s- Optionally edit the tape file
- Generate the GIF
$ vhs cassette.tape
File: ./cassette.tape
Sleep 1.5s
Type ./grype ubuntu:latest
Enter 1
Sleep 3s
Creating ...
Host your GIF on vhs.charm.sh: vhs publish <file>.gif
Below is the resulting default GIF, which looks fantastic out of the box, even before playing with themes, fonts and prompts.

vhs Benefits
vhs is very configurable, with some useful supported commands in the .tape file. The support for themes, fonts, resolution and ‘special’ key presses, makes it very flexible for scripting a terminal based application recording.
vhs Limitations
vhs requires the tape author to specify how long to Sleep after each command – or assume the initial values created with vhs record are correct. vhs does not (yet) auto-advance when a command finishes. This may not be a problem if the command you’re recording has a reliable runtime. Still, it might be a problem if the duration of a command is dependent on prevailing conditions such as the network or disk performance.
What do you think? Do you like animated terminal output, or would you prefer a video, interactive tool, or just a plain README.md. Let me know on our community discourse, or leave a comment wherever you read this blog post.
Shift Security Left with Anchore Enterprise
In this guide we present a battle-tested, shift- left developer workflow with the help of Anchore Enterprise. The workflow infrastructure will include GitLab as the continuous integration (CI) pipeline, Anchore Enterprise as the vulnerability scanner and Jira as the remediation tracking solution.
Introducing the Anchore Data Service
Expert Series: Solving Real-World Challenges in FedRAMP Compliance
Accelerate FedRAMP Compliance on Amazon EKS with Anchore
Automated vulnerability management & transparent security saves 75% time
Adopting the DoD Software Factory Model: Insights & How Tos

Carahsoft: Automated policy enforcement for CMMC with Anchore
Automate Container Vulnerability Scanning in CI with Anchore
Achieve container vulnerability scanning nirvana in your CI pipeline with Anchore Enterprise and your preferred CI platform, whether it’s GitHub, GitLab, or Jenkins. Identifying vulnerabilities, security issues, and compliance policy failures early in the software development process is crucial. It’s certainly preferable to uncover these issues during development rather than having them discovered by a customer or during an external audit.
Early detection of vulnerabilities ensures that security and compliance are integrated into your development workflow, reducing the risk of breaches and compliance violations. This proactive approach not only protects your software but also saves time and resources by addressing issues before they escalate.
Enabling CI Integration
At a high level, the steps to connect any CI platform to Enterprise are broadly the same, with implementation details differing between each vendor.
- Enable network connectivity between CI and Enterprise
- Capture Enterprise configuration for AnchoreCTL
- Craft an automation script to operate after the build process
- Install AnchoreCTL
- Capture built container details
- Use AnchoreCTL to submit container details to Enterprise
Once SBOM generation is integrated into the CI pipeline, and they’re submitted to Anchore Enterprise, the following features can quickly be leveraged:
- Known vulnerabilities with severity, and fix availability
- Search for accidental ‘secrets’ sharing such as private API keys
- Scan for malware like trojans and viruses
- Policy enforcement to comply with standards like FedRAMP, CISA and DISA
- Remediation by notifying developers and other agents via standard tools like GitHub issues, JIRA, and Slack
- Scheduled reporting on container insights
CI Integration by Example
Taking GitHub Actions as an example, we can outline the requirements and settings to get up and running with automated SBOM generation and vulnerability management.
Network connectivity
AnchoreCTL uses port 8228 for communication with the Anchore Enterprise SBOM ingest and management API. Ensure the Anchore Enterprise host, where this is configured, is accessible on that port from GitHub. This is site specific and may require firewall, VLAN and other site-specific changes.
Required configuration
AnchoreCTL requires only three environment variables, typically set as GitHub secrets.
ANCHORECTL_URL– the URL of the Anchore Enterprise API endpoint. e.g. http://anchore-enterprise.example.com:8228ANCHORECTL_USERNAME– the user account in Anchore Enterprise, that theanchorectlwill authenticate usingANCHORECTL_PASSWORD– the password for the account, set on the Anchore Enterprise instance
On the GitHub repository go to Settings -> Secrets and Variables -> Actions.
Under the ‘Variables’ tab, add ANCHORECTL_URL & ANCHORECTL_USERNAME, and set their values. In the ‘Secrets’ tab, add ANCHORECTL_PASSWORD and set the value.
Automation script
Below are the sample snippets from a GitHub action that should be placed in the repository under .github/workflows to enable SBOM generation in Anchore Enterprise. In this example,
First, our action needs a name:
name: Anchore Enterprise Centralized ScanPick one or more from this next section, depending on when you require the action to be triggered. It could be based on pushes to the main or other named branches, on a timed schedule, or manually.
Commonly when configuring an action for the first time, manual triggering is used until proven working, then timed or branch automation is enabled later.
on:
  ## Action runs on a push the branches listed
  push:
    branches:
      - main
  ## Action runs on a regular schedule
  schedule:
      ## Run at midnight every day
    - cron: '0 0 * * *'
  ## Action runs on demand build
  workflow_dispatch:
    inputs:
      mode:
        description: 'On-Demand Build'
In the env section we pass in the settings gathered and configured inside the GitHub web UI earlier. Additionally the optional ANCHORECTL_FAIL_BASED_ON_RESULTS boolean defines (if true) whether we want the the entire action to be failed based on scan results. This may be desirable, to block further processing if any vulnerabilities, secrets or malware are identified.
env:
  ANCHORECTL_URL: ${{ vars.ANCHORECTL_URL }}
  ANCHORECTL_USERNAME: ${{ vars.ANCHORECTL_USERNAME }}
  ANCHORECTL_PASSWORD: ${{ secrets.ANCHORECTL_PASSWORD }}
  ANCHORECTL_FAIL_BASED_ON_RESULTS: false
Now we start the actual body of the action, which comprises two jobs, ‘Build’ and ‘Anchore’. The ‘Build’ example here will use externally defined steps to checkout the code in the repo and build a container using docker, then push the resulting image to the container registry. In this case we build and publish to the GitHub Container Registry (ghcr), however, we could publish elsewhere.
jobs:

  Build:
    runs-on: ubuntu-latest
    steps:

    - name: "Set IMAGE environmental variables"
      run: |
        echo "IMAGE=${REGISTRY}/${GITHUB_REPOSITORY}:${GITHUB_REF_NAME}" >> $GITHUB_ENV

    - name: Checkout Code
      uses: actions/checkout@v3

    - name: Log in to the Container registry
      uses: docker/login-action@v2
      with:
        registry: ${{ env.REGISTRY }}
        username: ${{ github.actor }}
        password: ${{ secrets.GITHUB_TOKEN }}

    - name: Set up Docker Buildx
      uses: docker/setup-buildx-action@v2

    - name: build local container
      uses: docker/build-push-action@v3
      with:
        tags: ${{ env.IMAGE }}
        push: true
        load: false
The next job actually generates the SBOM, let’s break this down. First, the usualy boilerplate, but note this job depends on the previous ‘Build’ job having already run.
  Anchore:
    runs-on: ubuntu-latest
    needs: Build

    steps:
The same registry settings are used here as were used in the ‘Build’ job above, then we checkout the code onto the action runner. The IMAGE variable will be used by the anchorectl command later to submit into Anchore Enterprise.
    - name: "Set IMAGE environment variables"
      run: |
        echo "IMAGE=${REGISTRY}/${GITHUB_REPOSITORY}:${GITHUB_REF_NAME}" >> $GITHUB_ENV

    - name: Checkout Code
      uses: actions/checkout@v3
Installing the AnchoreCTL binary inside the action runner is required to send the request to the Anchore Enterprise API. Note the version number specified as the past parameter, should match the version of Enterprise.
    - name: Install Latest anchorectl Binary
      run: |
        curl -sSfL https://anchorectl-releases.anchore.io/anchorectl/install.sh | sh -s -- -b ${HOME}/.local/bin v5.7.0
        export PATH="${HOME}/.local/bin/:${PATH}"
The Connectivity check is a good way to ensure anchorectl is installed correctly, and configured to connect to the right Anchore Enterprise instance.
    - name: Connectivity Check
      run: |
        anchorectl version
        anchorectl system status
        anchorectl feed list
Now we actually queue the image up for scanning by our Enterprise instance. Note the use of --wait to ensure the GitHub Action pauses until the backend Enterprise instance completes the scan. Otherwise the next steps would likely fail, as the scan would not yet be complete.
    - name: Queue Image for Scanning by Anchore Enterprise
      run: |
        anchorectl image add --no-auto-subscribe --wait --dockerfile ./Dockerfile --force ${IMAGE}
Once the backend Anchore Enterprise has completed the vulnerability, malware, and secrets scan, we use anchorectl to pull the list of vulnerabilities and display them as a table. This can be viewed in the GitHub Action log, if required.
    - name: Pull Vulnerability List
      run: |
        anchorectl image vulnerabilities ${IMAGE}
Finally, the image check will pull down the results of the policy compliance as defined in your Anchore Enterprise. This will likely be a significantly shorter output than the full vulnerability list, depending on your policy bundle.
If the environment variable ANCHORECTL_FAIL_BASED_ON_RESULTS was set true earlier in the action, or -f is added to the command below, the action will return as a ‘failed’ run.
    - name: Pull Policy Evaluation
      run: |
        anchorectl image check --detail ${IMAGE}
That’s everything. If configured correctly, the action will run as required, and directly leverage the vulnerability, malware and secrets scanning of Anchore Enterprise.
Not just GitHub
While the example above is clearly GitHub specific, a similar configuration can be used in GitLab pipelines, Jenkins, or indeed any CI system that supports arbitrary shell scripts in automation.
Conclusion
By integrating Anchore Enterprise into your CI pipeline, you can achieve a higher level of security and compliance for your software development process. Automating vulnerability scanning and SBOM management ensures that your software is secure, compliant, and ready for deployment.
Automate your SBOM management with Anchore Enterprise. Get instant access with a 15-day free trial.
AnchoreCTL Setup and Top Tips
Introduction
Welcome to the beginners guide to AnchoreCTL, a powerful command-line tool designed for seamless interaction with Anchore Enterprise via the Anchore API. Whether you’re wrangling SBOMs, managing Kubernetes runtime inventories, or ensuring compliance at scale, AnchoreCTL is your go-to companion.
Overview
AnchoreCTL enables you to efficiently manage and inspect all aspects of your Anchore Enterprise deployments. It serves both as a human-readable configuration tool and a CLI for automation in CI/CD environments, making it indispensable for DevOps, security engineers, and developers.
If you’re familiar with Syft and Grype, AnchoreCTL will be a valuable addition to your toolkit. It offers enhanced capabilities to manage tens, hundreds, or even thousands of images and applications across your organization.
In this blog series, we’ll explore top tips and practical use cases to help you leverage AnchoreCTL to its fullest potential. In this part, we’ll review the basics of getting started with AnchoreCTL. In subsequent posts, we will dive deep on container scanning, SBOM Management and Vulnerability Management.
We’ll start by getting AnchoreCTL installed and learning about its configuration and use. I’ll be using AnchoreCTL on my macOS laptop, connected to a demo of Anchore Enterprise running on another machine.
Get AnchoreCTL
AnchoreCTL is a command-line tool available for macOS, Linux and Windows. The AnchoreCTL Deployment docs cover installation and deployment in detail. Grab the release of AnchoreCTL that matches your Anchore Enterprise install.
At the time of writing, the current release of AnchoreCTL and Anchore Enterprise is v5.6.0. Both are updated on a monthly cadence, and yours may be newer or older than what we’re using here. The AnchoreCTL Release Notes contain details about the latest, and all historical releases of the utility.
You may have more than one Anchore Enterprise deployment on different releases. As AnchoreCTL is a single binary, you can install multiple versions on a system to support all the deployments in your landscape.
macOS / Linux
This following snippet will install the binary in a directory of your choosing. On my personal workstation, I use $HOME/bin, but anywhere in your $PATH is fine. Placing the application binary in /usr/local/bin/ makes sense in a shared environment.
$ # Download the macOS or Linux build of anchorectl
$ curl -sSfL  https://anchorectl-releases.anchore.io/anchorectl/install.sh  | sh -s -- -b $HOME/bin v5.6.0
Windows
The Windows install snippet grabs the zip file containing the binary. Once downloaded, unpack the zip and copy the anchorectl command somewhere appropriate.
$ # Download the Windows build of anchorectl
$ curl -o anchorectl.zip https://anchorectl-releases.anchore.io/anchorectl/v5.6.0/anchorectl_5.6.0_windows_amd64.zip
Setup
Quick check
Once AnchoreCTL is installed, check it’s working with a simple anchorectl version. It should print output similar to this:
$ # Show the version of the anchorectl command line tool
$ anchorectl version
Application:        anchorectl
Version:            5.6.0
SyftVersion:        v1.4.1
BuildDate:          2024-05-27T18:28:23Z
GitCommit:          7c134b46b7911a5a17ba1fa5f5ffa4e3687f170b
GitDescription:     v5.6.0
Platform:           darwin/arm64
GoVersion:          go1.21.10
Compiler:           gc
Configure
The anchorectl command has a --help option that displays a lot of useful information beyond just the list of command line options reference. Below are the first 15 lines to illustrate what you should see. The actual output is over 80 lines, so we’ve snipped it down here.
$ # Show the top 15 lines of the help
$ anchorectl --help | head -n 15
Usage:
  anchorectl [command]

Application Config:

  (search locations: .anchorectl.yaml, anchorectl.yaml, .anchorectl/config.yaml, ~/.anchorectl.yaml, ~/anchorectl.yaml, $XDG_CONFIG_HOME/anchorectl/config.yaml)

  # the URL to the Anchore Enterprise API (env var: "ANCHORECTL_URL")
  url: ""

  # the Anchore Enterprise username (env var: "ANCHORECTL_USERNAME")
  username: ""

  # the Anchore Enterprise user's login password (env var: "ANCHORECTL_PASSWORD")
On launch, the anchorectl binary will search for a yaml configuration file in a series of locations shown in the help above. For a quick start, just create .anchorectl.yaml in your home directory, but any of the listed locations are fine.
Here is my very basic .anchorectl.yaml which has been configured with the minimum values of url, username and password to get started. I’ve pointed anchorectl at the Anchore Enterprise v5.6.0 running on my Linux laptop ‘ziggy’, using the default port, username and password. We’ll see later how we can create new accounts and users.
$ # Show the basic config file
$ cat .anchorectl.yml
url: "http://ziggy.local:8228"
username: "admin"
password: "foobar"
Config Check
The configuration can be validated with anchorectl -v. If the configuration is syntactically correct, you’ll see the online help displayed, and the command will exit with return code 0. In this example, I have truncated the lengthy anchorectl -v output.
$ # Good config
$ cat .anchorectl.yml
url: "http://ziggy.local:8228"
username: "admin"
password: "foobar"

$ anchorectl -v
[0000]  INFO
anchorectl version: 5.6.0
Usage:  anchorectl [command]

⋮

      --version         version for anchorectl
Use "anchorectl [command] --help" for more information about a command.

$ echo $?
0
In this example, I omitted a closing quotation mark on the url: line, to force an error.
$ # Bad config
$ cat .anchorectl.yml
url: "http://ziggy.local:8228
username: "admin"
password: "foobar"

$ anchorectl -v

⋮
error: invalid application config: unable to parse config="/Users/alan/.anchorectl.yml": While parsing config: yaml: line 1: did not find expected key

$ echo $?
1
Connectivity Check
Assuming the configuration file is syntactically correct, we can now validate the correct url, username and password are set for the Anchore Enterprise system with an anchorectl system status. If all is going well, we’ll get a report similar to this:
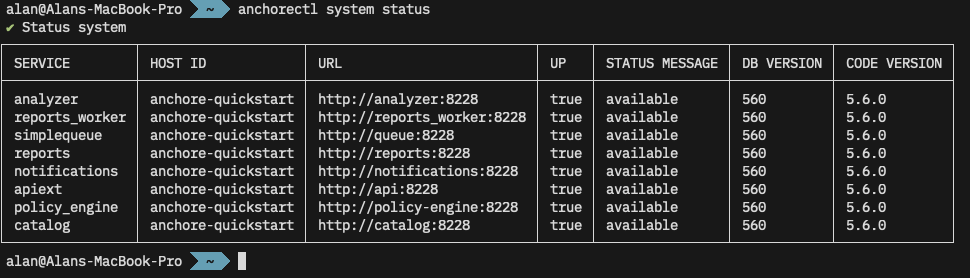
anchore system status shows the services running on my Anchore Enterprise.Multiple Configurations
You may also use the -c or --config option to specify the path to a configuration file. This is useful if you communicate with multiple Anchore Enterprise systems.
$ # Show the production configuration file
$ cat ./production.anchore.yml
url: "http://remotehost.anchoreservers.com:8228"
username: "admin"
password: "foobar"

$ # Show the development configuration file, which points to a diff PC
$ cat ./development.anchore.yml
url: "http://workstation.local:8228"
username: "admin"
password: "foobar"

$ # Connect to remote production instance
$ anchorectl -c ./production.anchorectl.yml system status
✔ Status system⋮

$ # Connect to developer workstation
$ anchorectl -c ./development.anchorectl.yml system status
✔ Status system⋮
Environment Variables
Note from the --help further up that AnchoreCTL can be configured with environment variables instead of the configuration file. This can be useful when the tool is deployed in CI/CD environments, where these can be set using the platform ‘secret storage’.
So, without any configuration file, we can issue the same command but setting options via environment variables. I’ve truncated the output below, but note the ✔ Status system indicating a successful call to the remote system.
$ # Delete the configuration to prove we aren't using it
$ rm .anchorectl.yml
$ anchorectl system status
⠋
error: 1 error occurred:  * no enterprise URL provided

$ # Use environment variables instead
$ ANCHORECTL_URL="http://ziggy.local:8228" \
  ANCHORECTL_USERNAME="admin" \
  ANCHORECTL_PASSWORD="foobar" \
  anchorectl system status
✔ Status system⋮
Of course, in a CI/CD environment such as GitHub, GitLab, or Jenkins, these environment variables would be set in a secure store and only set up as the job running anchorectl it initiated.
Users
Viewing Accounts & Users
In the examples above, I’ve been using the default username and password for a demo Anchore Enterprise instance. AnchoreCTL can be used to query and manage the system’s accounts and users. Documentation for these activities can be found in the user management section of the docs.
$ # Show list of accounts on the remote instance
$ anchorectl account list
✔ Fetched accounts
┌───────┬─────────────────┬─────────┐
│ NAME  │ EMAIL           │ STATE   │
├───────┼─────────────────┼─────────┤
│ admin │ admin@myanchore │ enabled │
└───────┴─────────────────┴─────────┘
We can also list existing users on the system:
$ # Show list of users (if any) in the admin account
$ anchorectl user list --account admin
✔ Fetched users
┌──────────┬──────────────────────┬───────────────────────┬────────┬──────────┬────────┐
│ USERNAME │ CREATED AT           │ PASSWORD LAST UPDATED │ TYPE   │ IDP NAME │ SOURCE │
├──────────┼──────────────────────┼───────────────────────┼────────┼──────────┼────────┤
│ admin    │ 2024-06-10T11:48:32Z │ 2024-06-10T11:48:32Z  │ native │          │        │
└──────────┴──────────────────────┴───────────────────────┴────────┴──────────┴────────┘
Managing Acounts
AnchoreCTL can be used to add (account add), enable (account enable), disable (account disable) and remove (account delete) accounts from the system:
$ # Create a new account
$ anchorectl account add dev_team_alpha
✔ Added account
Name: dev_team_alpha
Email:
State: enabled

$ # Get a list of accounts
$ anchorectl account list
✔ Fetched accounts
┌────────────────┬─────────────────┬─────────┐
│ NAME           │ EMAIL           │ STATE   │
├────────────────┼─────────────────┼─────────┤
│ admin          │ admin@myanchore │ enabled │
│ dev_team_alpha │                 │ enabled │
│ dev_team_beta  │                 │ enabled │
└────────────────┴─────────────────┴─────────┘

$ # Disable an account before deleting it
$ anchorectl account disable dev_team_alpha
✔ Disabled accountState: disabled

$ # Delete the account
$ anchorectl account delete dev_team_alpha
✔ Deleted account
No results

$ # Get a list of accounts
$ anchorectl account list
✔ Fetched accounts
┌────────────────┬─────────────────┬──────────┐
│ NAME           │ EMAIL           │ STATE    │
├────────────────┼─────────────────┼──────────┤
│ admin          │ admin@myanchore │ enabled  │
│ dev_team_alpha │                 │ deleting │
│ dev_team_beta  │                 │ enabled  │
└────────────────┴─────────────────┴──────────┘
Managing Users
Users exist within accounts, but usernames are globally unique since they are used for authenticating API requests. Any user in the admin account can perform user management in the default Anchore Enterprise configuration using the native authorizer.
For more information on configuring other authorization plugins, see Authorization Plugins and Configuration in our documentation.
Users can also be managed via AnchoreCTL. Here we create a new dev_admin_beta user under the dev_team_beta account and give then the role full-control as an administrator of the team. We’ll set a password of CorrectHorseBatteryStable for the admin user, but pass that via the environment rather than echo it out in the command line.
$ # Create a new user from the dev_team_beta account
$ ANCHORECTL_USER_PASSWORD=CorrectHorseBatteryStable \
  anchorectl user add --account dev_team_beta dev_admin_beta \
  --role full-control

  ✔ Added user      dev_admin_beta
  Username: dev_admin_beta
  Created At: 2024-06-12T10:25:23Z
  Password Last Updated: 2024-06-12T10:25:23Z
  Type: native
  IDP Name:
  Source:
Let’s check that worked:
$ # Check that the new user was created
$ anchorectl user list --account dev_team_beta
✔ Fetched users
┌────────────────┬──────────────────────┬───────────────────────┬────────┬──────────┬────────┐
│ USERNAME       │ CREATED AT           │ PASSWORD LAST UPDATED │ TYPE   │ IDP NAME │ SOURCE │
├────────────────┼──────────────────────┼───────────────────────┼────────┼──────────┼────────┤
│ dev_admin_beta │ 2024-06-12T10:25:23Z │ 2024-06-12T10:25:23Z  │ native │          │        │
└────────────────┴──────────────────────┴───────────────────────┴────────┴──────────┴────────┘
That user is now able to use the API.
$ # List users from the dev_team_beta account
$ ANCHORECTL_USERNAME=dev_admin_beta \
  ANCHORECTL_PASSWORD=CorrectHorseBatteryStable \
  ANCHORECTL_ACCOUNT=dev_team_beta \
  anchorectl user list
  ✔ Fetched users
  ┌────────────────┬──────────────────────┬───────────────────────┬────────┬──────────┬────────┐
  │ USERNAME       │ CREATED AT           │ PASSWORD LAST UPDATED │ TYPE   │ IDP NAME │ SOURCE │
  ├────────────────┼──────────────────────┼───────────────────────┼────────┼──────────┼────────┤
  │ dev_admin_beta │ 2024-06-12T10:25:23Z │ 2024-06-12T10:25:23Z  │ native │          │        │
  └────────────────┴──────────────────────┴───────────────────────┴────────┴──────────┴────────┘
Using AnchoreCTL
We now have AnchoreCTL set-up to talk to our Anchore Enterprise, and a user other than admin to connect as let’s actually use it to scan a container. We have two options here, ‘Centralized Analysis’ and ‘Distributed Analysis’.
In Centralized Analysis, any container we request will be downloaded and analyzed by our Anchore Enterprise. If we choose Distributed Analysis, the image will be analyzed by anchorectl itself. This is covered in much more detail in the Vulnerability Management section of the docs.
Currently we have no images submitted for analysis:
$ # Query Enterprise to get a list of container images and their status
$ ANCHORECTL_USERNAME=dev_admin_beta \
  ANCHORECTL_PASSWORD=CorrectHorseBatteryStable \
  ANCHORECTL_ACCOUNT=dev_team_beta \
  anchorectl image list

  ✔ Fetched images
  ┌─────┬────────┬──────────┬────────┐
  │ TAG │ DIGEST │ ANALYSIS │ STATUS │
  ├─────┼────────┼──────────┼────────┤
  └─────┴────────┴──────────┴────────┘
Let’s submit the latest Debian container from Dockerhub to Anchore Enterprise for analysis. The backend Anchore Enterprise deployment will then pull (download) the image, and analyze it.
$ # Request that enterprise downloads and analyzes the debian:latest image
$ ANCHORECTL_USERNAME=dev_admin_beta \
  ANCHORECTL_PASSWORD=CorrectHorseBatteryStable \
  ANCHORECTL_ACCOUNT=dev_team_beta \
  anchorectl image add docker.io/library/debian:latest

 ✔ Added Image
 docker.io/library/debian:latest
 Image:
 status:           not-analyzed (active)
 tag:              docker.io/library/debian:latest
 digest:           sha256:820a611dc036cb57cee7...
 id:               7b34f2fc561c06e26d69d7a5a58...
Initially the image starts in a state of not-analyzed. Once it’s been downloaded, it’ll be queued for analysis. When the analysis begins, the status will change to analyzing after which it will change to analyzed. We can check the status with anchorectl image list.
$ # Check the status of the container image we requested
$ ANCHORECTL_USERNAME=dev_admin_beta \
  ANCHORECTL_PASSWORD=CorrectHorseBatteryStable \
  ANCHORECTL_ACCOUNT=dev_team_beta \
  anchorectl image list

✔ Fetched images
┌─────────────────────────────────┬────────────────────────────────┬───────────┬────────┐
│ TAG                             │ DIGEST                         │ ANALYSIS  │ STATUS │
├─────────────────────────────────┼────────────────────────────────┼───────────┼────────┤
│ docker.io/library/debian:latest │ sha256:820a611dc036cb57cee7... │ analyzing │ active │
└─────────────────────────────────┴────────────────────────────────┴───────────┴────────┘
After a short while, the image has been analyzed.
$ # Check the status of the container image we requested
$ ANCHORECTL_USERNAME=dev_admin_beta \
  ANCHORECTL_PASSWORD=CorrectHorseBatteryStable \
  ANCHORECTL_ACCOUNT=dev_team_beta \
  anchorectl image list
 ✔ Fetched images
┌─────────────────────────────────┬────────────────────────────────┬───────────┬────────┐
│ TAG                             │ DIGEST                         │ ANALYSIS  │ STATUS │
├─────────────────────────────────┼────────────────────────────────┼───────────┼────────┤
│ docker.io/library/debian:latest │ sha256:820a611dc036cb57cee7... │ analyzed  │ active │
└─────────────────────────────────┴────────────────────────────────┴───────────┴────────┘
Results
Once analysis is complete, we can inspect the results, again with anchorectl.
Container contents
First, let’s see what Operating System packages Anchore found in this container with anchorectl image content docker.io/library/debian:latest -t os
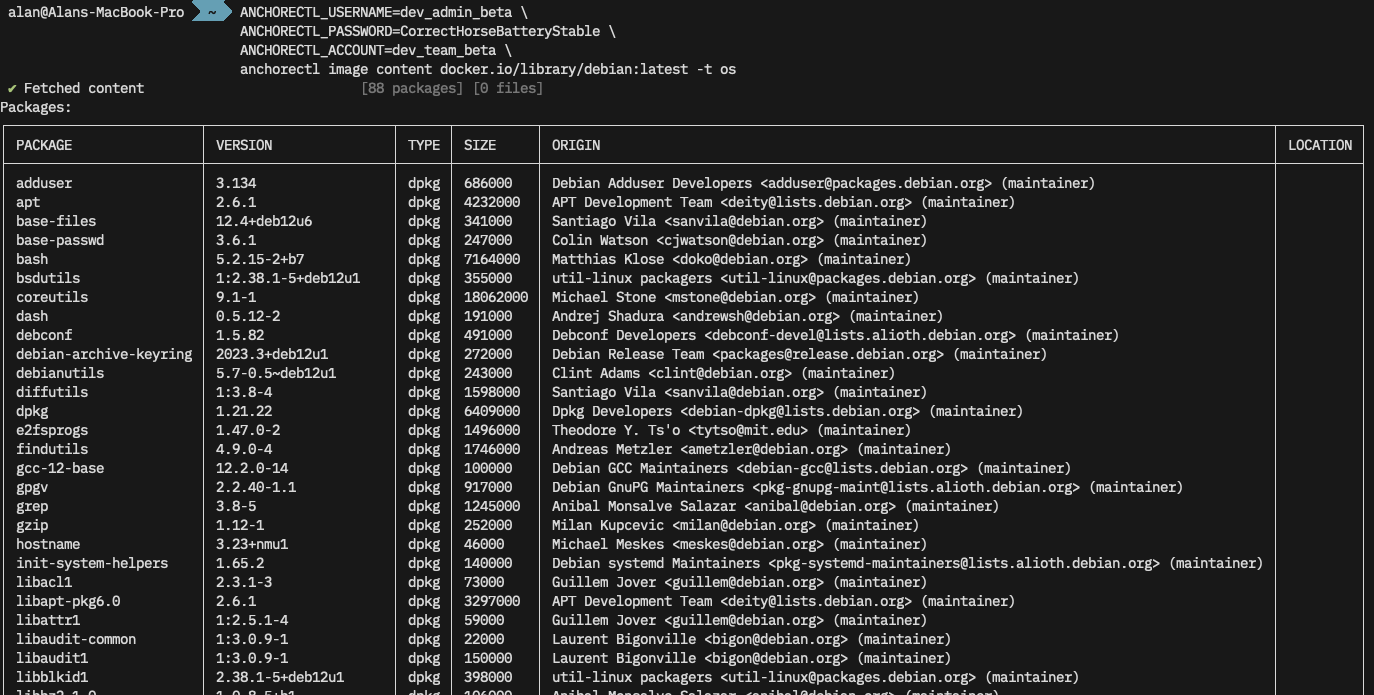
SBOM
We can also pull the Software Bill of Materials (SBOM) for this image from Anchore with anchorectl image sbom docker.io/library/debian:latest -o table. We can use -f to write this to a file, and -o syft-json (for example) to output in a different format.
$ # Get a list of OS packages in the image
$ ANCHORECTL_USERNAME=dev_admin_beta \
  ANCHORECTL_PASSWORD=CorrectHorseBatteryStable \
  ANCHORECTL_ACCOUNT=dev_team_beta \
  anchorectl image sbom docker.io/library/debian:latest -o table

✔ Fetched SBOM  docker.io/library/debian:latest
NAME                    VERSION                TYPE
adduser                 3.134                  deb
apt                     2.6.1                  deb
base-files              12.4+deb12u6           deb
⋮
util-linux              2.38.1-5+deb12u1       deb
util-linux-extra        2.38.1-5+deb12u1       deb
zlib1g                  1:1.2.13.dfsg-1        deb
Vulnerabilities
Finally let’s have a quick look to see if any OS vulnerabilities were found in this image with anchorectl image vulnerabilities docker.io/library/debian:latest -t os. This is a lot of super-wide output, click through to see the full size image.

Conclusion
So far we’ve introduced AnchoreCTL, shown it’s is easy to install, configure and test. It can be used both locally on developer workstations, and in CI/CD environments such as GitHub, GitLab and Jenkins. We’ll cover the integration of AnchoreCTL with source forges in a later post.
AnchoreCTL is a powerful tool which can be used to automate the management of scanning container contents, generating SBOMs, and analyzing for vulnerabilities.
Find out more about AnchoreCTL in our documentation, and request a demo of Anchore Enterprise.
75% time savings with vulnerability detection by Anchore
High volume image scanning & vulnerability management for the Iron Bank

Easy Compliance is Continuous Compliance
DevSecOps – Editorial Roundtable
Four Years of Syft Development in 4 Minutes at 4K
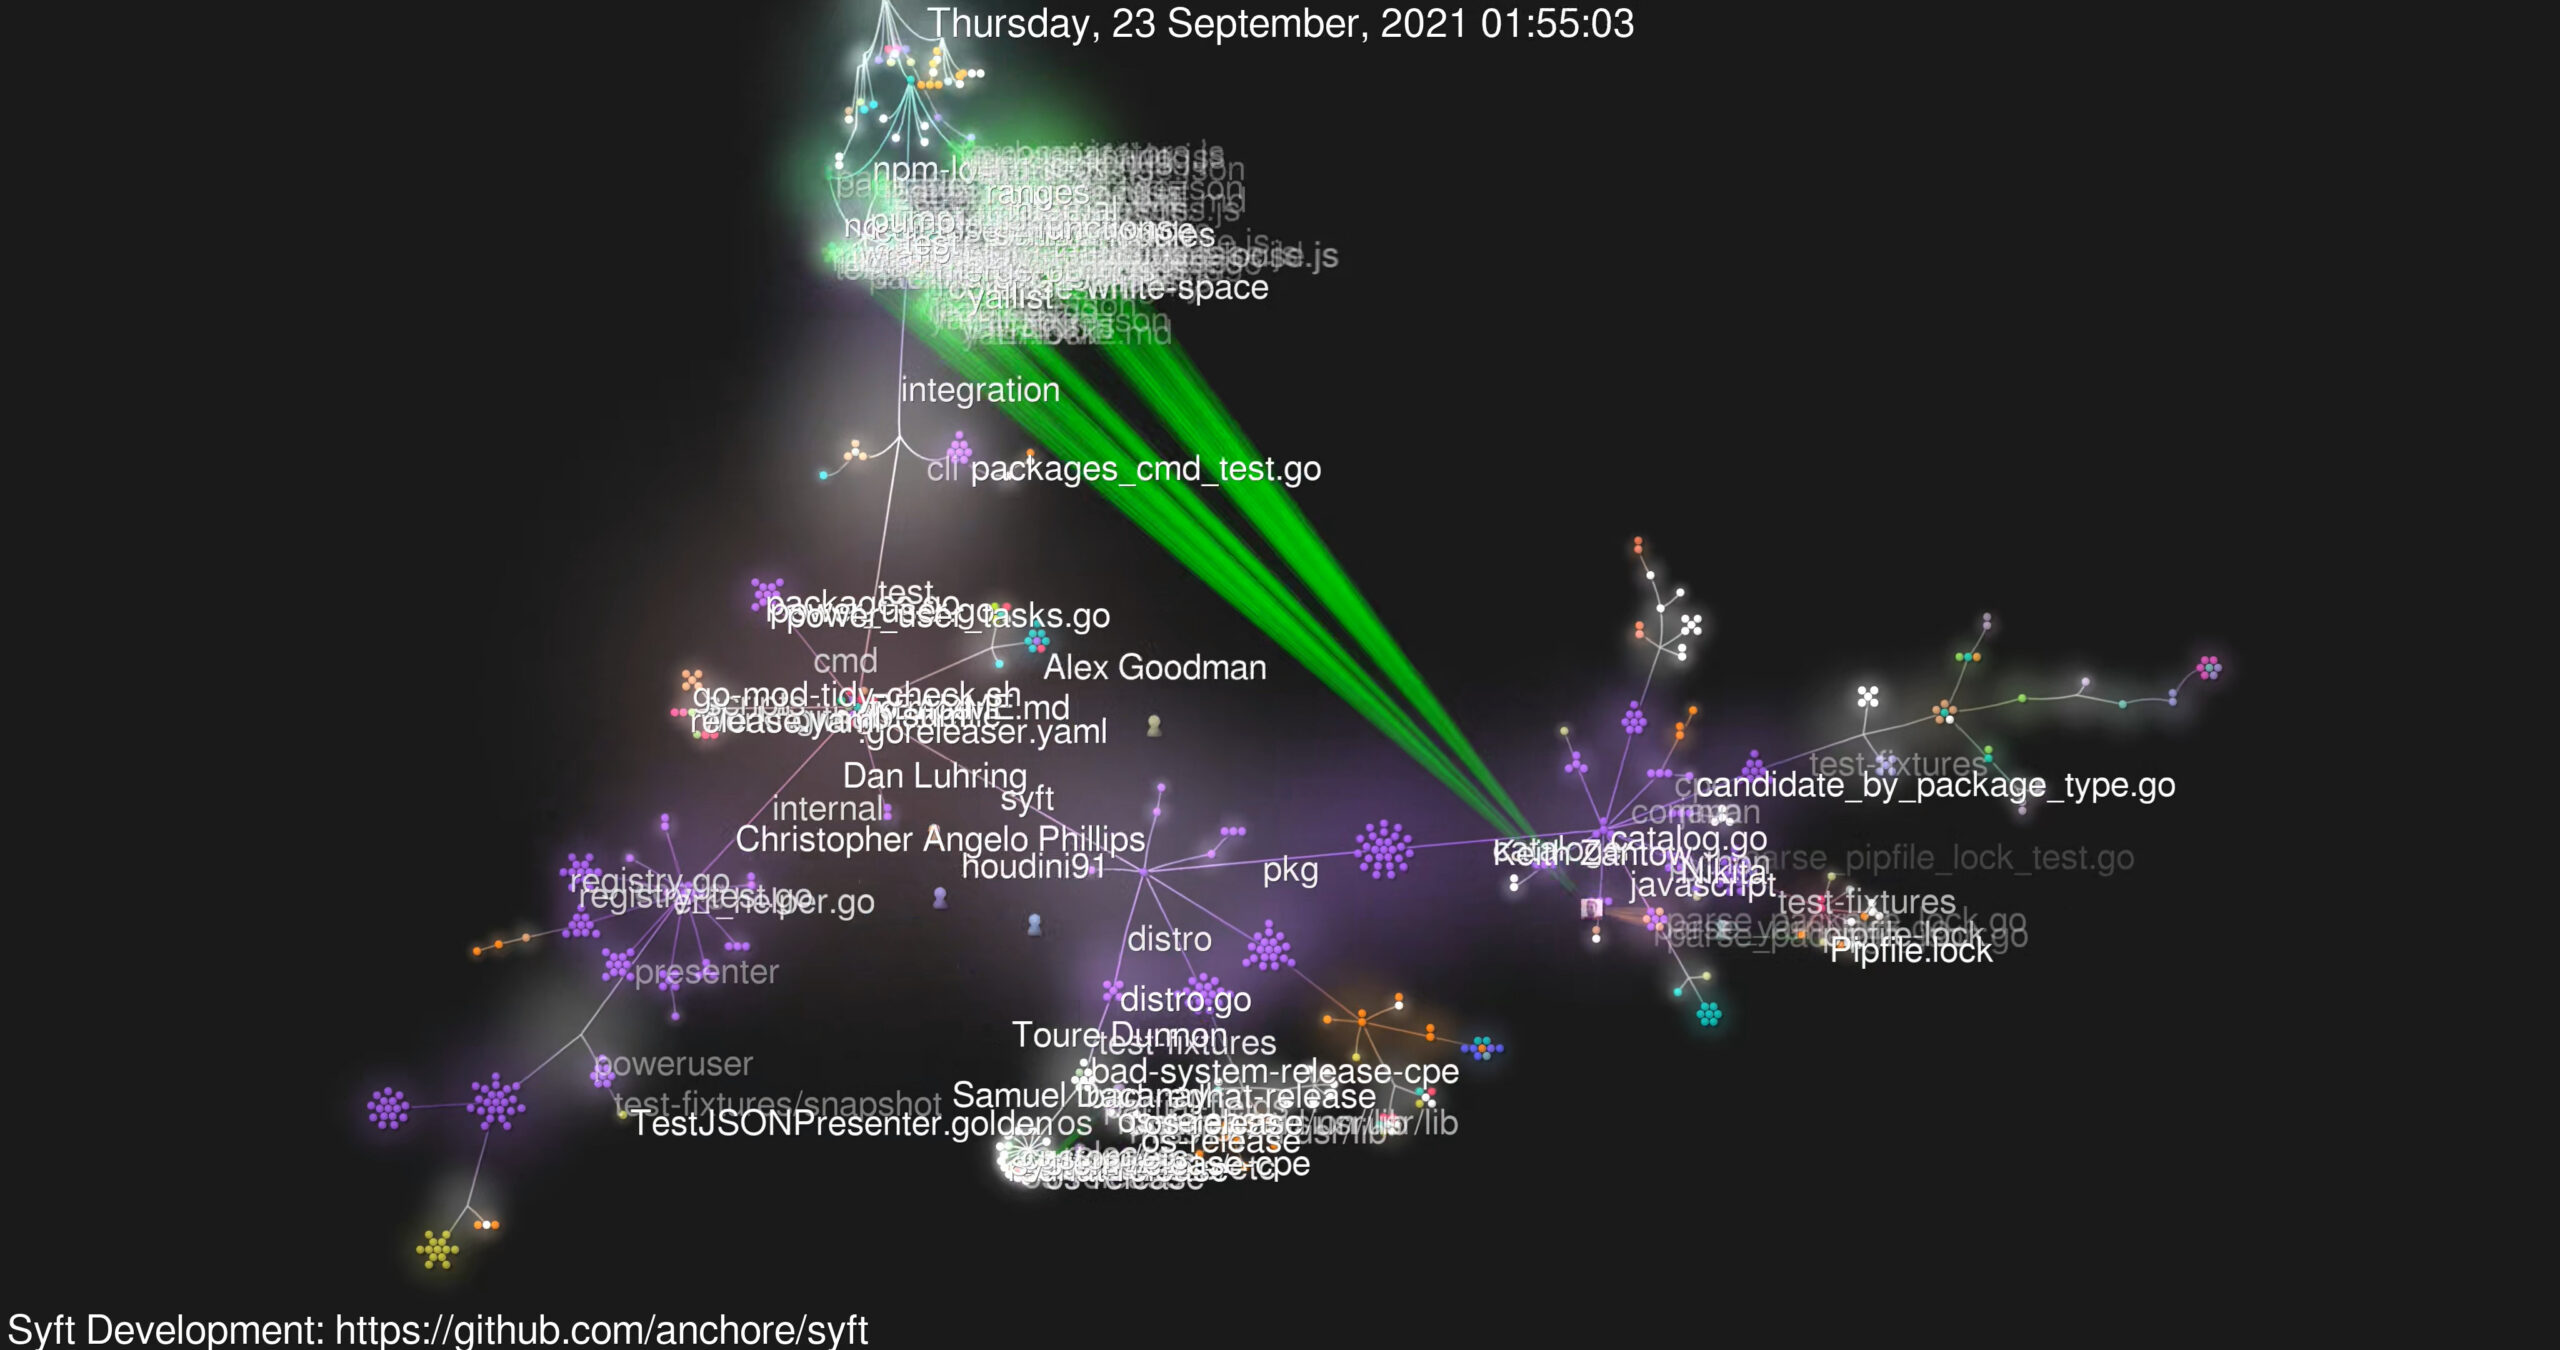
Our open-source SBOM and vulnerability scanning tools Syft and Grype, recently turned four years old. So I did what any nerd would do: render an animated visualization of the development using the now-venerable Gource. Initially, I wanted to render these videos at 120Hz framerate, but that didn’t go well. Read on to find out how that panned out.
My employer (perhaps foolishly) gave me the keys to our Anchore YouTube and Anchore Vimeo accounts. You can find the video I rendered on YouTube or embedded below.
For those unaware, Gource is a popular open-source project by Andrew Caudwell. Its purpose is to visualize development with pretty OpenGL-rendered videos. You may have seen these animated glowing renders before, as Gource has been around for a while now.
Syft is Anchore’s command-line tool and library for generating a software bill of materials (SBOM) from container images and filesystems. Grype is our vulnerability scanner for container images and filesystems. They’re both fundamental components of our Anchore Enterprise platform but are also independently famous.
Generating the video
Plenty of guides online cover how to build Gource visualizations, which are pretty straightforward. Gource analyses the git log of changes in a repository to generate frames of animation which can be viewed or saved to a video. There are settings to control various aspects of the animation, which are well documented in the Gource Wiki.
By default, while Gource is running, a window displaying the animation will appear on your screen. So, if you want to see what the render will look like, most of the defaults are fine when running Gource directly.
Tweak the defaults
I wanted to limit the video duration, and render at a higher resolution than my laptop panel supports. I also wanted the window to be hidden while the process runs.
tl;dr Here’s the full command line I used to generate and encode the 4K video in the background.
$ /usr/bin/xvfb-run --server-num=99 -e /dev/stdout \
  -s '-screen 0 4096x2160x24 ' /usr/bin/gource \
  --max-files 0 --font-scale 4 --output-framerate 60 \
  -4096x2160 --auto-skip-seconds 0.1 --seconds-per-day 0.16 \
  --bloom-multiplier 0.9 --fullscreen --highlight-users \
  --multi-sampling --stop-at-end --high-dpi \
  --user-image-dir ../faces/ --start-date 2020-05-07 \
  --title 'Syft Development https://github.com/anchore/syft' \
  -o - \
  ffmpeg -y -r 60 -f image2pipe -vcodec ppm -i - \
  -vcodec libx264 -preset veryfast -pix_fmt yuv420p \
  -crf 1 -threads 0 -bf 0 ../syft-4096x2160-60.mkv
Let’s take a step back and examine the preparatory steps and some interesting points to note.
Preparation
The first thing to do is to get Gource and ffmpeg. I’m using Ubuntu 24.04 on my ThinkPad Z13, so a simple sudo apt install gource ffmpeg works.
Grab the Syft and/or Grype source code.
$ mkdir -p ~/Videos/gource/
$ cd ~/Videos/gource
$ git clone https://github.com/anchore/syft
$ git clone https://github.com/anchore/grype
Gource can use avatar images in the videos which represent the project contributors. I used gitfaces for this. Gitfaces is available from PyPI, so can be installed with pip install -U gitfaces or similar. Once installed, generate the avatars from within the project folder.
$ cd ~/Videos/gource/syft
$ mkdir ../faces
$ gitfaces . ../faces
Do this for each project you wish to render out. I used a central ../faces folder as there would be some duplication between the projects I’m rendering. However, not everyone has an avatar, so they’ll show up as an anonymous “head and shoulders” in the animation.
Test render
Perform a quick test to ensure Gource is installed correctly and the avatars are working.
$ cd ~/Videos/gource/syft
$ /usr/bin/gource --user-image-dir ../faces/
A default-sized window of 1052×834 should appear with nicely rendered blobs and lines. If you watch it for any appreciable length, you’ll notice it can be boring in the gaps between commits. Gource has some options to improve this.
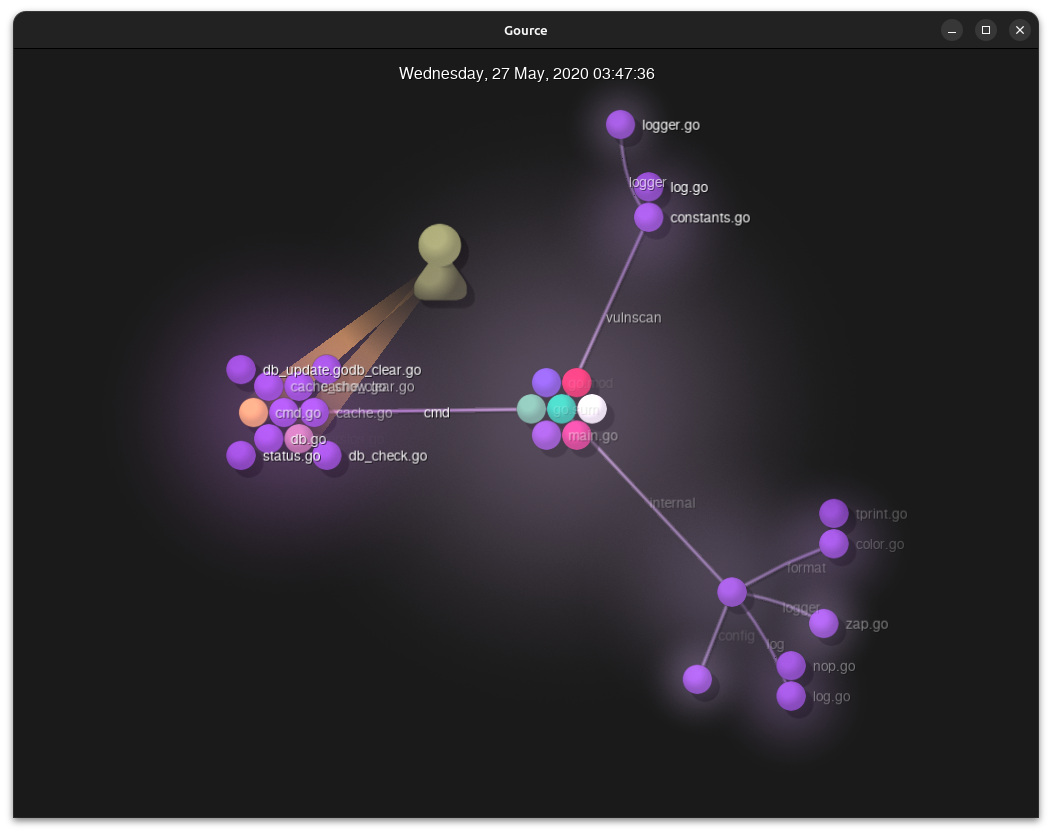
The --auto-skip-seconds option defines when Gource will skip to the next entry in the git log while there is no activity. The default is 3 seconds, which can be reduced. With --seconds-per-day we can set the render speed so we don’t get a very long video.
I used 0.1 and 0.16, respectively. The result is a shorter, faster, more dynamic video. The Gource Wiki details many other options for Gource.
Up the resolution!
While the default 1052×834 video size is fine for a quick render, I wanted something much bigger. Using the ‘4 years in 4 minutes at 4K’ heading would be fun, so I went for 4096×2160. My laptop doesn’t have a 4K display (it’s 2880×1800 natively), so I decided to render it in the background, saving it to a video.
To run it in the background, I used xvfb-run from the xvfb package on my Ubuntu system. A quick sudo apt install xvfb installed it. To run Gource inside xvfb we simply prefix the command line like this:
(this is not the full command, just a snippet to show the xvfb syntax)
$ /usr/bin/xvfb-run --server-num=99 -e /dev/stdout \
  -s '-screen 0 4096x2160x24 ' /usr/bin/gource -4096x2160
Note that the XServer’s resolution matches the video’s, and we use the fullscreen option in Gource to use the whole virtual display. Here we also specify the color bit-depth of the XServer – in this case 24.
Create the video
Using ffmpeg—the Swiss army knife of video encoding—we can turn Gource’s output into a video. I used the x264 codec with some reasonable options. We can run these as two separate commands: one to generate a (huge) series of ppm images and the second to compress that into a reasonable file size.
$ /usr/bin/xvfb-run --server-num=99 -e /dev/stdout \
  -s '-screen 0 4096x2160x24 ' /usr/bin/gource \
  --max-files 0 --font-scale 4 --output-framerate 60 \
  -4096x2160 --auto-skip-seconds 0.1 --seconds-per-day 0.16 \
  --bloom-multiplier 0.9 --fullscreen --highlight-users \
  --multi-sampling --stop-at-end --high-dpi \
  --user-image-dir ../faces/ --start-date 2020-05-07 \
  --title 'Syft Development: https://github.com/anchore/syft' \
  -o ../syft-4096x2160-60.ppm

$ ffmpeg -y -r 60 -f image2pipe -vcodec ppm \
  -i ../syft-4096x2160-60.ppm -vcodec libx264 \
  -preset veryfast -pix_fmt yuv420p -crf 1 \
  -threads 0 -bf 0 ../syft-4096x2160-60.mkv
Four years of commits as uncompressed 4K60 images will fill the disk pretty fast. So it’s preferable to chain the two commands together so we save time and don’t waste too much disk space.
$ /usr/bin/xvfb-run --server-num=99 -e /dev/stdout \
  -s '-screen 0 4096x2160x24 ' /usr/bin/gource \
  --max-files 0 --font-scale 4 --output-framerate 60 \
  -4096x2160 --auto-skip-seconds 0.1 --seconds-per-day 0.16 \
  --bloom-multiplier 0.9 --fullscreen --highlight-users \
  --multi-sampling --stop-at-end --high-dpi \
  --user-image-dir ../faces/ --start-date 2020-05-07 \
  --title 'Syft Development: https://github.com/anchore/syft' \
  -o - ffmpeg -y -r 60 -f image2pipe -vcodec ppm -i - \
  -vcodec libx264 -preset veryfast -pix_fmt yuv420p \
  -crf 1 -threads 0 -bf 0 ../syft-4096x2160-60.mkv
On my ThinkPad Z13 equipped with an AMD Ryzen 7 PRO 6860Z CPU, this takes around 42 minutes and generates a ~10GB mkv video. Here’s what the resource utilisation looks like while this is running. Fully maxed out all the CPU cores. Toasty!
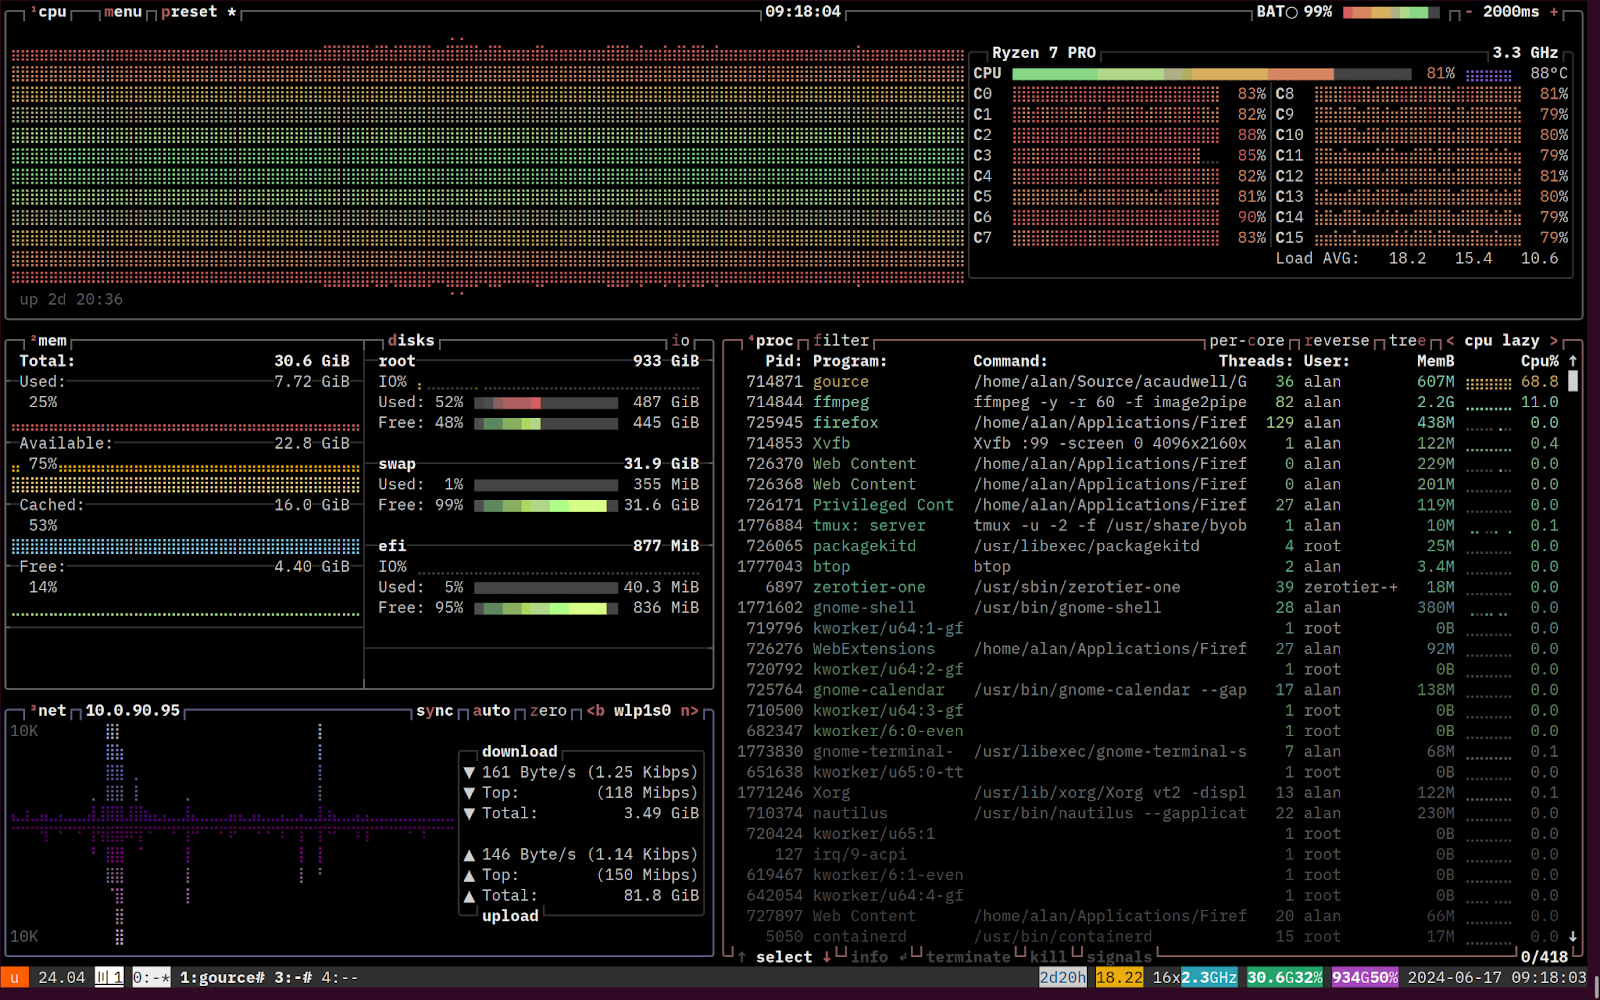
Challenges
More frames
Initially, I considered creating a video at 120fps rather than the default 60fps that Gource generates. However, Gource is limited in code to 25, 30, and 60fps. As an academic exercise, I patched Gource (diff below) to generate visualizations at the higher frame rate.
I’m not a C++ developer, nor do I play one on TV! But with a bit of grep and a small amount of trial and error, I modified and rebuilt Gource to add support for 120fps.
diff --git a/src/core b/src/core
--- a/src/core
+++ b/src/core
@@ -1 +1 @@
-Subproject commit f7fa400ec164f6fb36bcca5b85d2d2685cd3c7e8
+Subproject commit f7fa400ec164f6fb36bcca5b85d2d2685cd3c7e8-dirty
diff --git a/src/gource.cpp b/src/gource.cpp
index cf86c4f..755745f 100644
--- a/src/gource.cpp
+++ b/src/gource.cpp
@@ -153,7 +153,7 @@ Gource::Gource(FrameExporter* exporter) {
     root = 0;

     //min physics rate 60fps (ie maximum allowed delta 1.0/60)
-    max_tick_rate = 1.0 / 60.0;
+    max_tick_rate = 1.0 / 120.0;
     runtime = 0.0f;
     frameskip = 0;
     framecount = 0;
@@ -511,7 +511,7 @@ void Gource::setFrameExporter(FrameExporter* exporter, int video_framerate) {
     this->frameskip  = 0;

     //calculate appropriate tick rate for video frame rate
-    while(gource_framerate<60) {
+    while(gource_framerate<120) {
         gource_framerate += video_framerate;
         this->frameskip++;
     }
I then re-ran Gource with --output-framerate 120 and ffmpeg with -r 120, which successfully generated the higher frame-rate files.
$ ls -lh
-rw-rw-r-- 1 alan alan 7.3G Jun 15 21:42 syft-2560x1440-60.mkv
-rw-rw-r-- 1 alan alan 8.9G Jun 15 22:14 grype-2560x1440-60.mkv
-rw-rw-r-- 1 alan alan  13G Jun 16 22:56 syft-2560x1440-120.mkv
-rw-rw-r-- 1 alan alan  16G Jun 16 22:33 grype-2560x1440-120.mkv
As you can see and probably expect on some test renders, with these settings, double the frames means double the size. I could have fiddled with ffmpeg to use better-optimized options, or a different codec, but decided against it.
There’s an even more significant issue here. There are precious few places to host high-frame-rate videos; few people have the hardware, bandwidth, and motivation to watch them. So, I rolled back to 60fps for subsequent renders.
More pixels
While 4K (4096×2160) is fun and fits the story of “4 years in 4 minutes at 4K”, I did consider trying to render out at 8K (7680×4320). After all, I had time on my hands at the weekend and spare CPU cycles, so why not?
Sadly, the hardware x264 encoder in my ThinkPad Z13 has a maximum canvas size of 4096×4096, which is far too small for 8K. I could have encoded using software rather than hardware acceleration, but that would have been ludicrously more time-consuming.
I do have an NVIDIA card but don’t believe it’s new enough to do 8K either, being a ‘lowly’ (these days) GTX 2080Ti. My work laptop is an M3 MacBook Pro. I didn’t attempt rendering there because I couldn’t fathom getting xvfb working to do off-screen rendering in Gource on macOS.
I have another four years to figure this out before my ‘8 years of Syft in 8 minutes at 8K’ video, though!
Minor edits
Once Gource and ffmpeg did their work, I used Kdenlive to add some music and our stock “top and tail” animated logo to the video and then rendered it for upload. The default compression settings in Kdenlive dramatically reduced the file size to something more manageable and uploadable!
Conclusion
Syft and Grype are – in open source terms – relatively young, with a small, dedicated team working on them. As such, the Gourse renders aren’t as busy or complex as more well-established projects with bigger teams.
We certainly welcome external contributions over on the Syft and Grype repositories. We also have a new Anchore Community Discourse where you can discuss the projects and this article.
If you’d like to see how Syft and Grype are integral to your SBOM generation, vulnerability and policy enforcement tools, contact us and watch the guided tour.
I always find these renders technically neat, beautiful and relaxing to watch. The challenges of rendering them also led me down some interesting technical paths. I’d love to hear feedback and suggestions over on the Anchore Community Discourse
How to Secure Your Kubernetes Software Supply Chain at Scale
SBOM & Vulnerability Scanning with Anchore and Palette
Reduce Risk for Software Supply Chain Attacks: Best Practices for Container Security
Learn about 5 key strategies for enhancing container security, one of the main attack surfaces in dynamic software development practices.
VIPERR Workshop
| The Actionable Framework for Software Supply Chain Security |
Carahsoft DevSecOps Conference 2024
Upstream – a Tidelift expedition
Adapting to the new normal at NVD with Anchore Vulnerability Feed
SSDF Attestation 101: A Practical Guide for Software Producers
This ebook sheds light on the recently increased security requirements by the US government and helps companies understand the 4 main requirements for SSDF Attestation.