Open source software (OSS) brings a wealth of benefits; speed, innovation, cost savings. But when serving customers in highly regulated industries like defense, energy, or finance, a new complication enters the picture—compliance.
Imagine your DevOps-fluent engineering team has been leveraging OSS to accelerate product delivery, and suddenly, a major customer hits you with a security compliance questionnaire. What now?
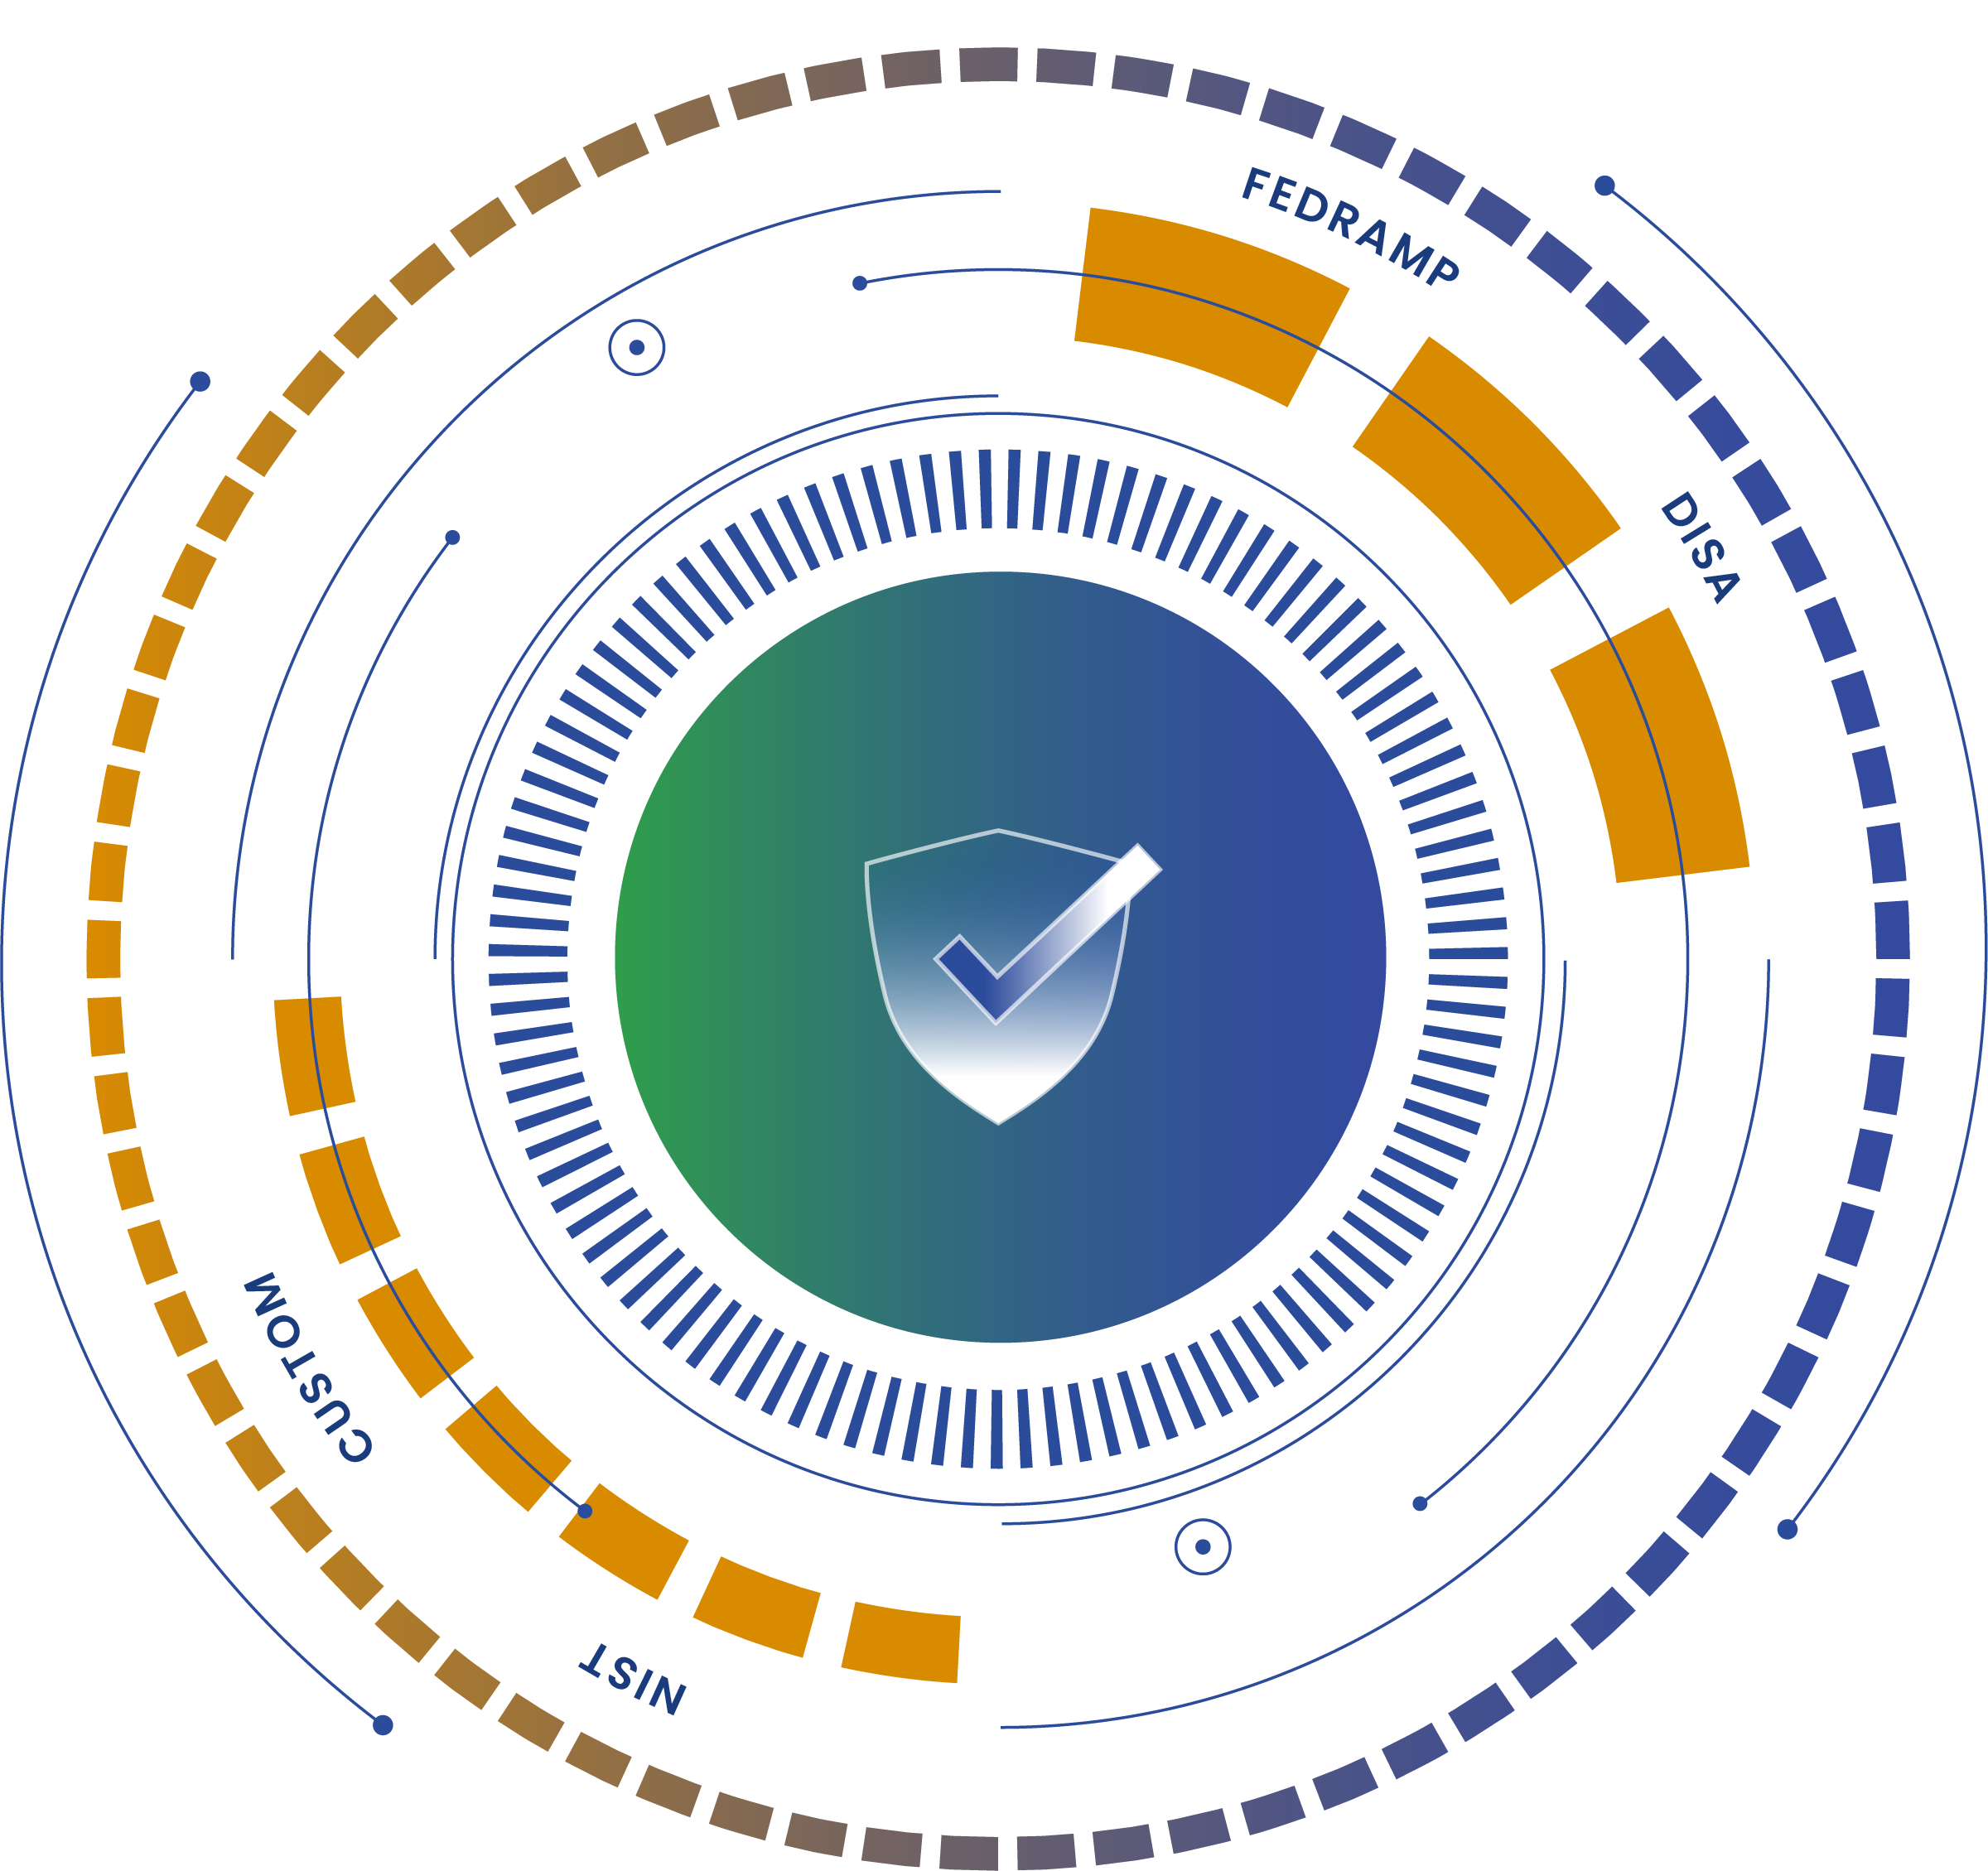
Regulatory compliance isn’t just about managing the risks of OSS for your business anymore; it’s about providing concrete evidence that you meet standards like FedRAMP and the Secure Software Development Framework (SSDF).
The tricky part is that the OSS “suppliers” making up 70-90% of your software supply chain aren’t traditional vendors—they don’t have the same obligations or accountability, and they’re not necessarily aligned with your compliance needs.
So, who bears the responsibility? You do.
The OSS your engineering team consumes is your resource and your responsibility. This means you’re not only tasked with managing the security risks of using OSS but also with proving that both your applications and your OSS supply chain meet compliance standards.
In this post, we’ll explore why you’re ultimately responsible for the OSS you consume and outline practical steps to help you use OSS while staying compliant.
Learn about CISA’s SSDF attestation form and how to meet compliance.
What does it mean to use open source software in a regulated environment?
Highly regulated environments add a new wrinkle to the OSS security narrative. The OSS developers that author the software dependencies that make up the vast majority of modern software supply chains aren’t vendors in the traditional sense. They are more of a volunteer workforce that allow you to re-use their work but it is a take it or leave it agreement. You have no recourse if it doesn’t work as expected, or worse, has vulnerabilities in it.
So, how do you meet compliance standards when your software supply chain is built on top of a foundation of OSS?
Who is the vendor? You are!
Whether you have internalized this or not the open source software that your developers consume is your resource and thus your responsibility.
This means that you are shouldered with the burden of not only managing the security risk of consuming OSS but also having to shoulder the burden of proving that both your applications and the your OSS supply chain meets compliance.
Open source software is a natural resource
Before we jump into how to accomplish the task set forth in the previous section, let’s take some time to understand why you are the vendor when it comes to open source software.
The common idea is that OSS is produced by a 3rd-party that isn’t part of your organization, so they are the software supplier. Shouldn’t they be the ones required to secure their code? They control and maintain what goes in, right? How are they not responsible?
To answer that question, let’s think about OSS as a natural resource that is shared by the public at large, for instance the public water supply.
This shouldn’t be too much of a stretch. We already use terms like upstream and downstream to think about the relationship between software dependencies and the global software supply chain.
Using this mental model, it becomes easier to understand that a public good isn’t a supplier. You can’t ask a river or a lake for an audit report that it is contaminant free and safe to drink.
Instead the organization that processes and provides the water to the community is responsible for testing the water and guaranteeing its safety. In this metaphor, your company is the one processing the water and selling it as pristine bottled water.
How do you pass the buck to your “supplier”? You can’t. That’s the point.
This probably has you asking yourself, if I am responsible for my own OSS supply chain then how to meet a compliance standard for something that I don’t have control over? Keep reading and you’ll find out.
How do I use OSS and stay compliant?
While compliance standards are often thought of as rigid, the reality is much more nuanced. Just because your organization doesn’t own/control the open source projects that you consume doesn’t mean that you can’t use OSS and meet compliance requirements.
There are a few different steps that you need to take in order to build a “reasonably secure” OSS supply chain that will pass a compliance audit. We’ll walk you through the steps below:
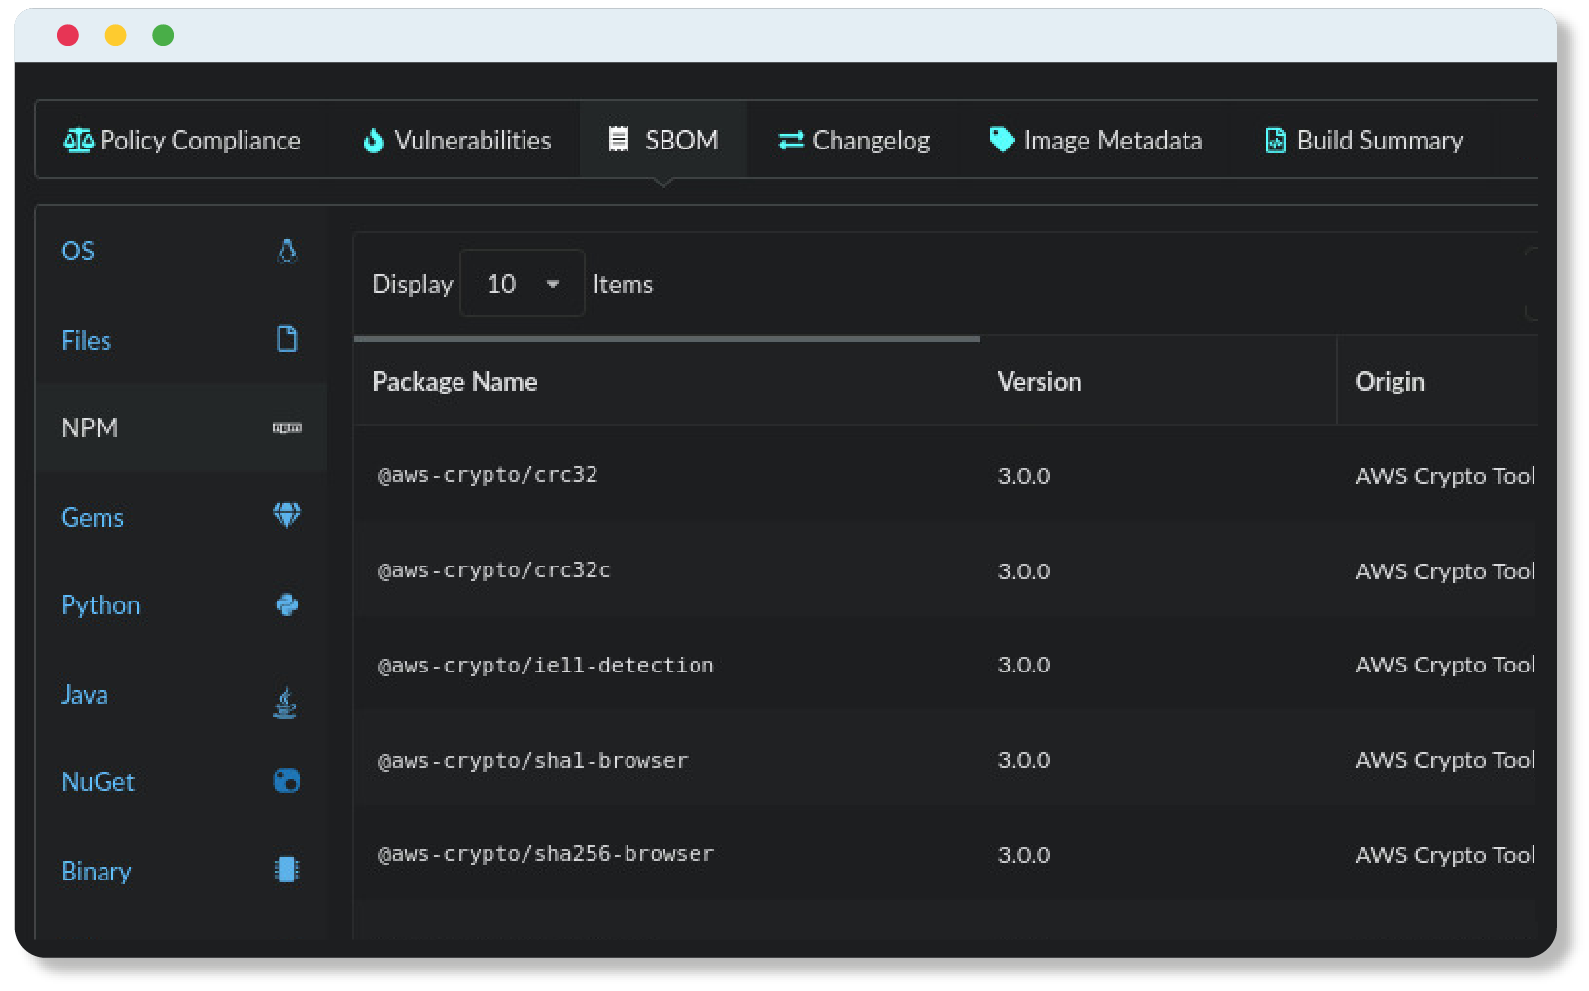
Step 1 — Know what you have (i.e., an SBOM inventory)
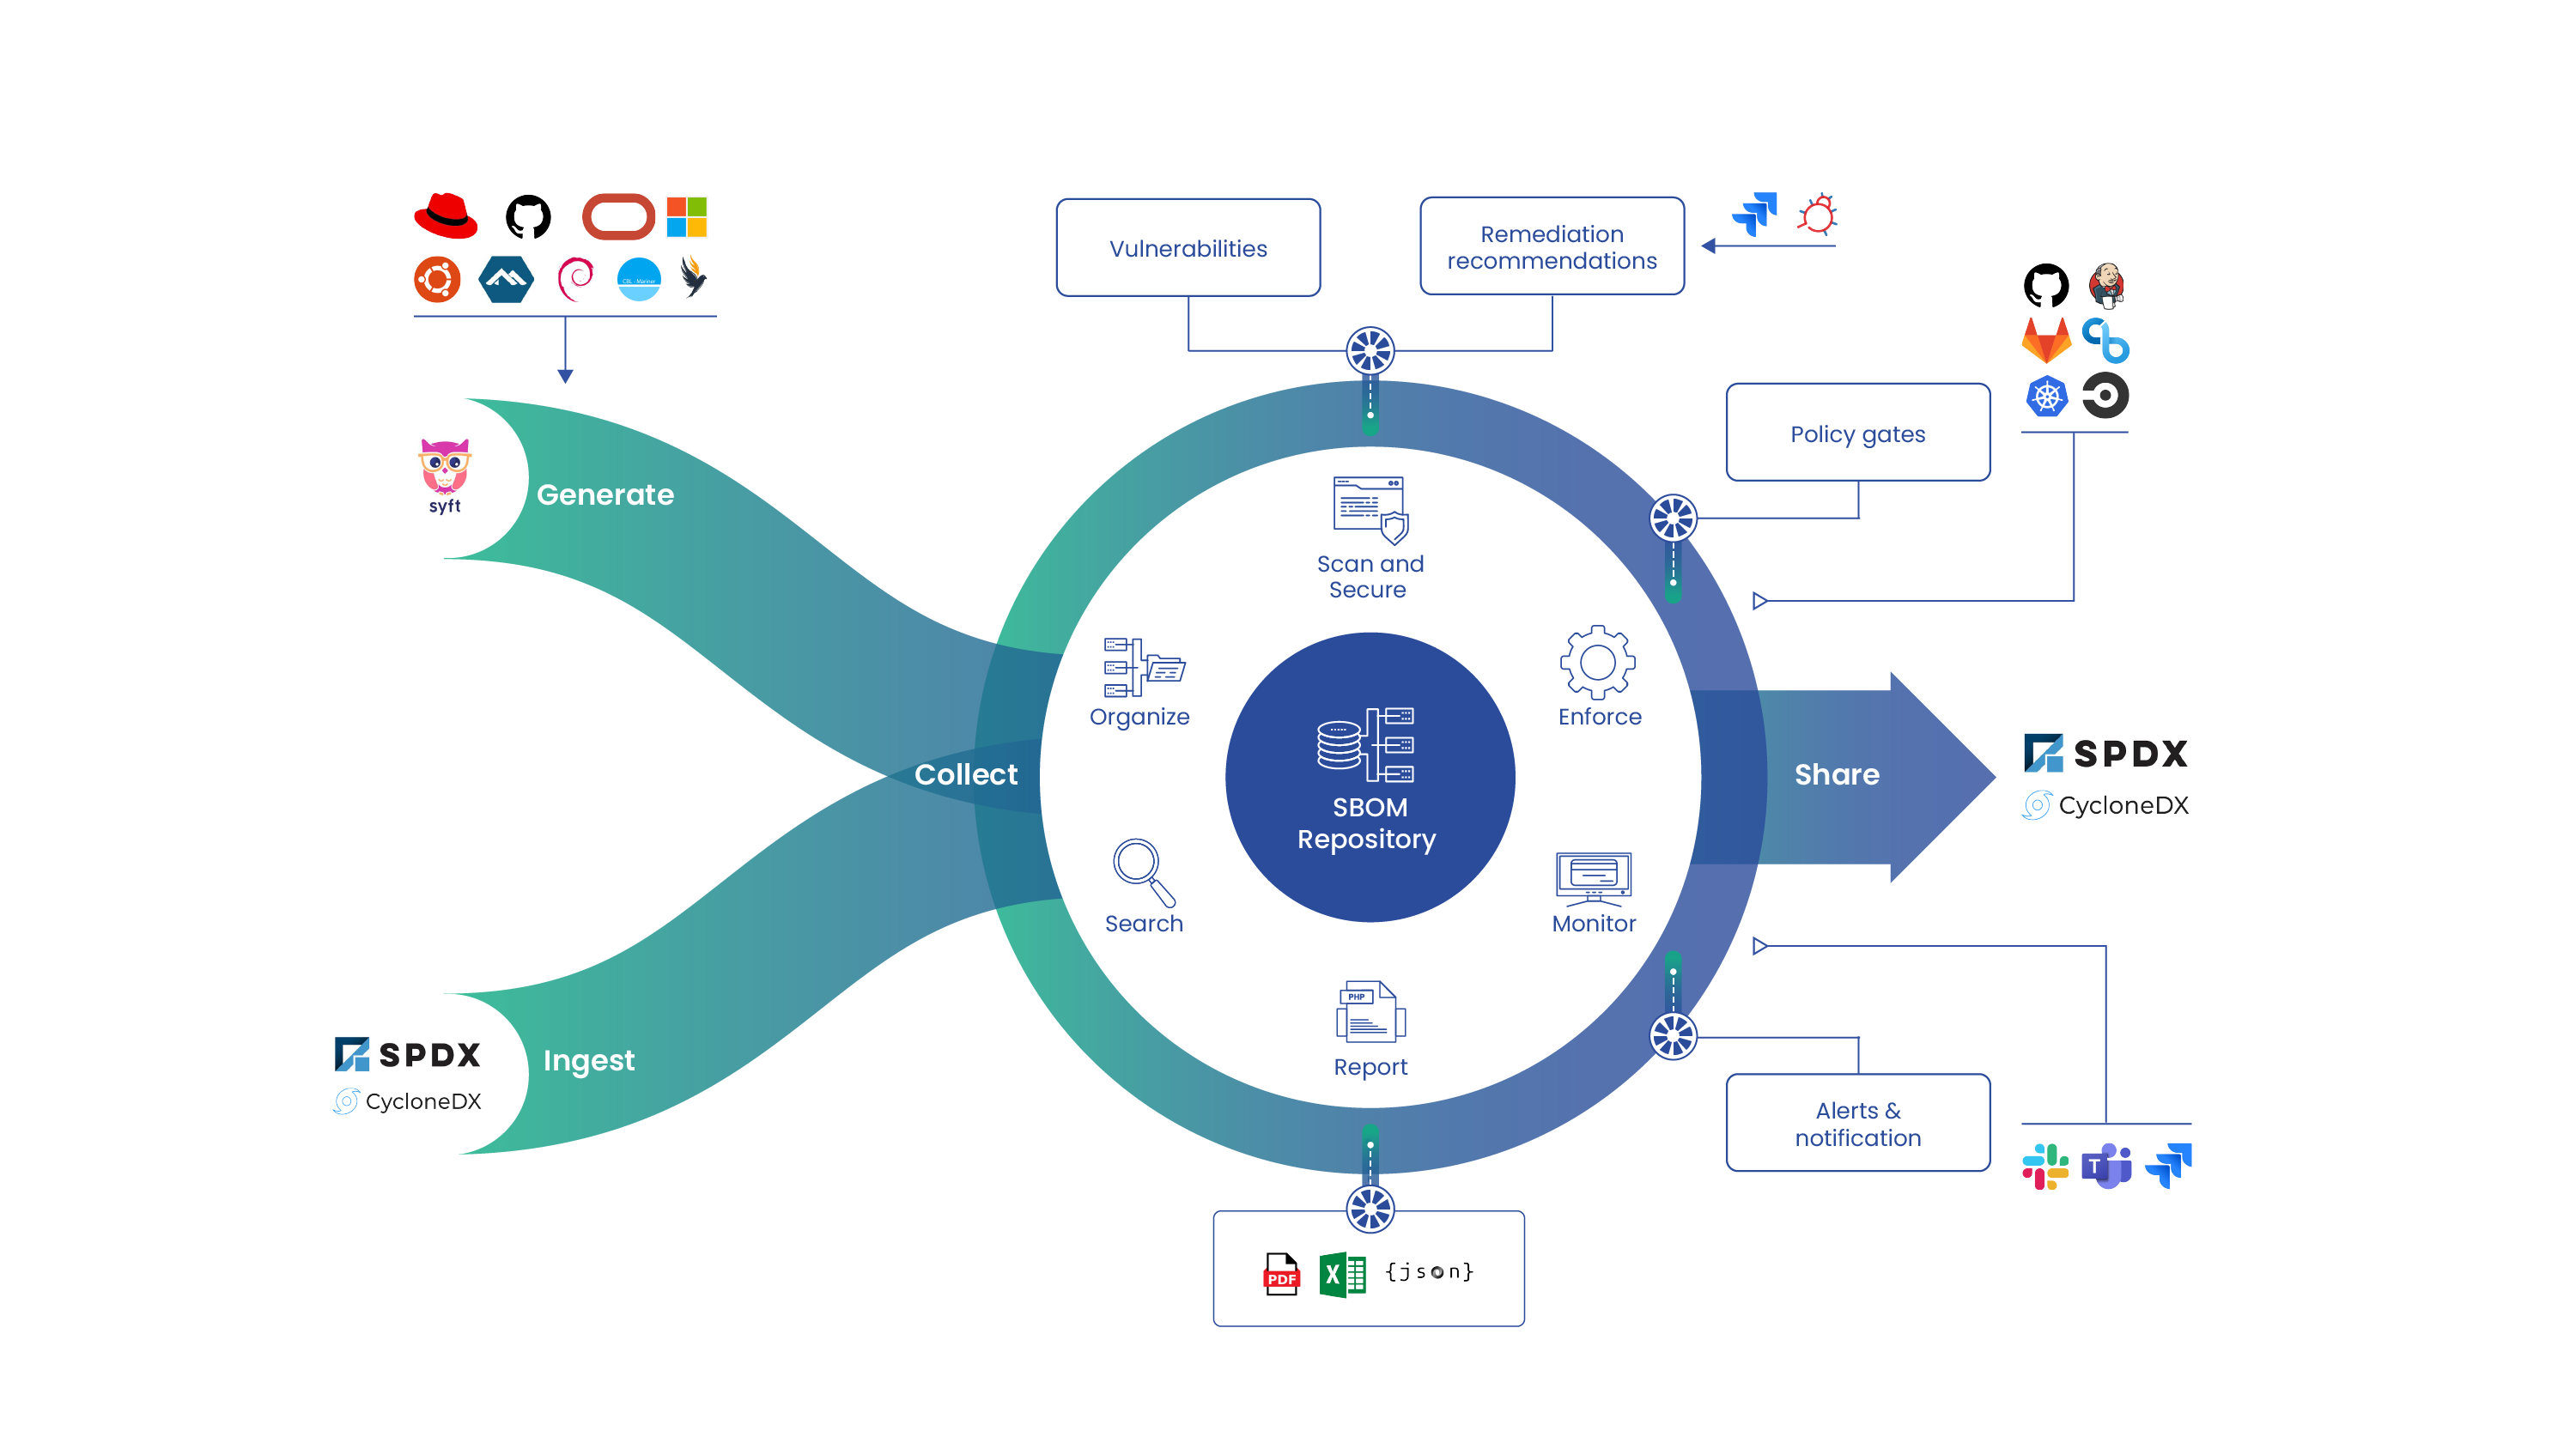
The foundation of the global software supply chain is the SBOM (software bill of materials) standard. Each of the security and compliance functions outlined in the steps below use or manipulate an SBOM.
SBOMs are the foundational component of the global software supply chain because they record the ingredients that were used to produce the application an end-user will consume. If you don’t have a good grasp of the ingredients of your applications there isn’t much hope for producing any upstream security or compliance guarantees.
The best way to create observability into your software supply chain is to generate an SBOM for every single application in your DevSecOps build pipeline—at each stage of the pipeline!
Step 2 — Maintain a historical record of application source code
To meet compliance standards like FedRAMP and SSDF, you need to be able to maintain a historical record of the source code of your applications, including:
- Where it comes from,
- Who created it, and
- Any modifications made to it over time.
SBOMs were designed to meet these requirements. They act as a record of how applications were built and when/where OSS dependencies were introduced. They also double as compliance artifacts that prove you are compliant with regulatory standards.
Governments aren’t content with self-attestation (at least not for long); they need hard evidence to verify that you are trustworthy. Even though SSDF is currently self-attestation only, the federal government is known for rolling out compliance frameworks in stages. First advising on best-practices, then requiring self-attestation, finally external validation via a certification process.
The Cybersecurity Maturity Model Certification (CMMC) is a good example of this dynamic process. It recently transitioned from self-attestation to external validation with the introduction of the 2.0 release of the framework.
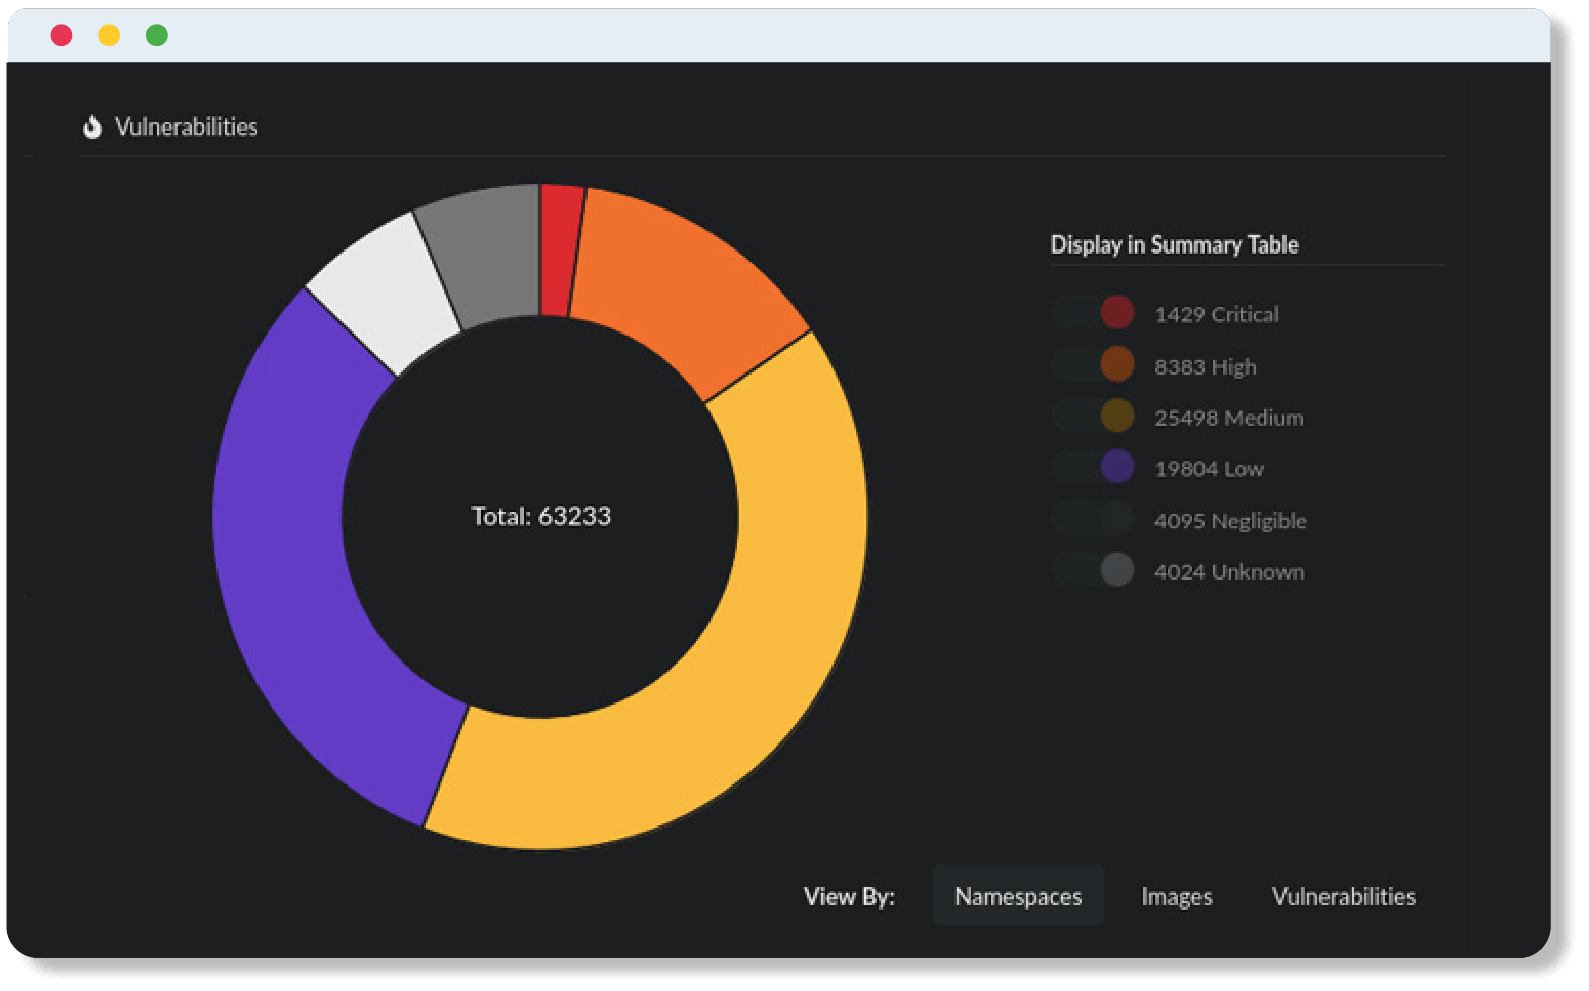
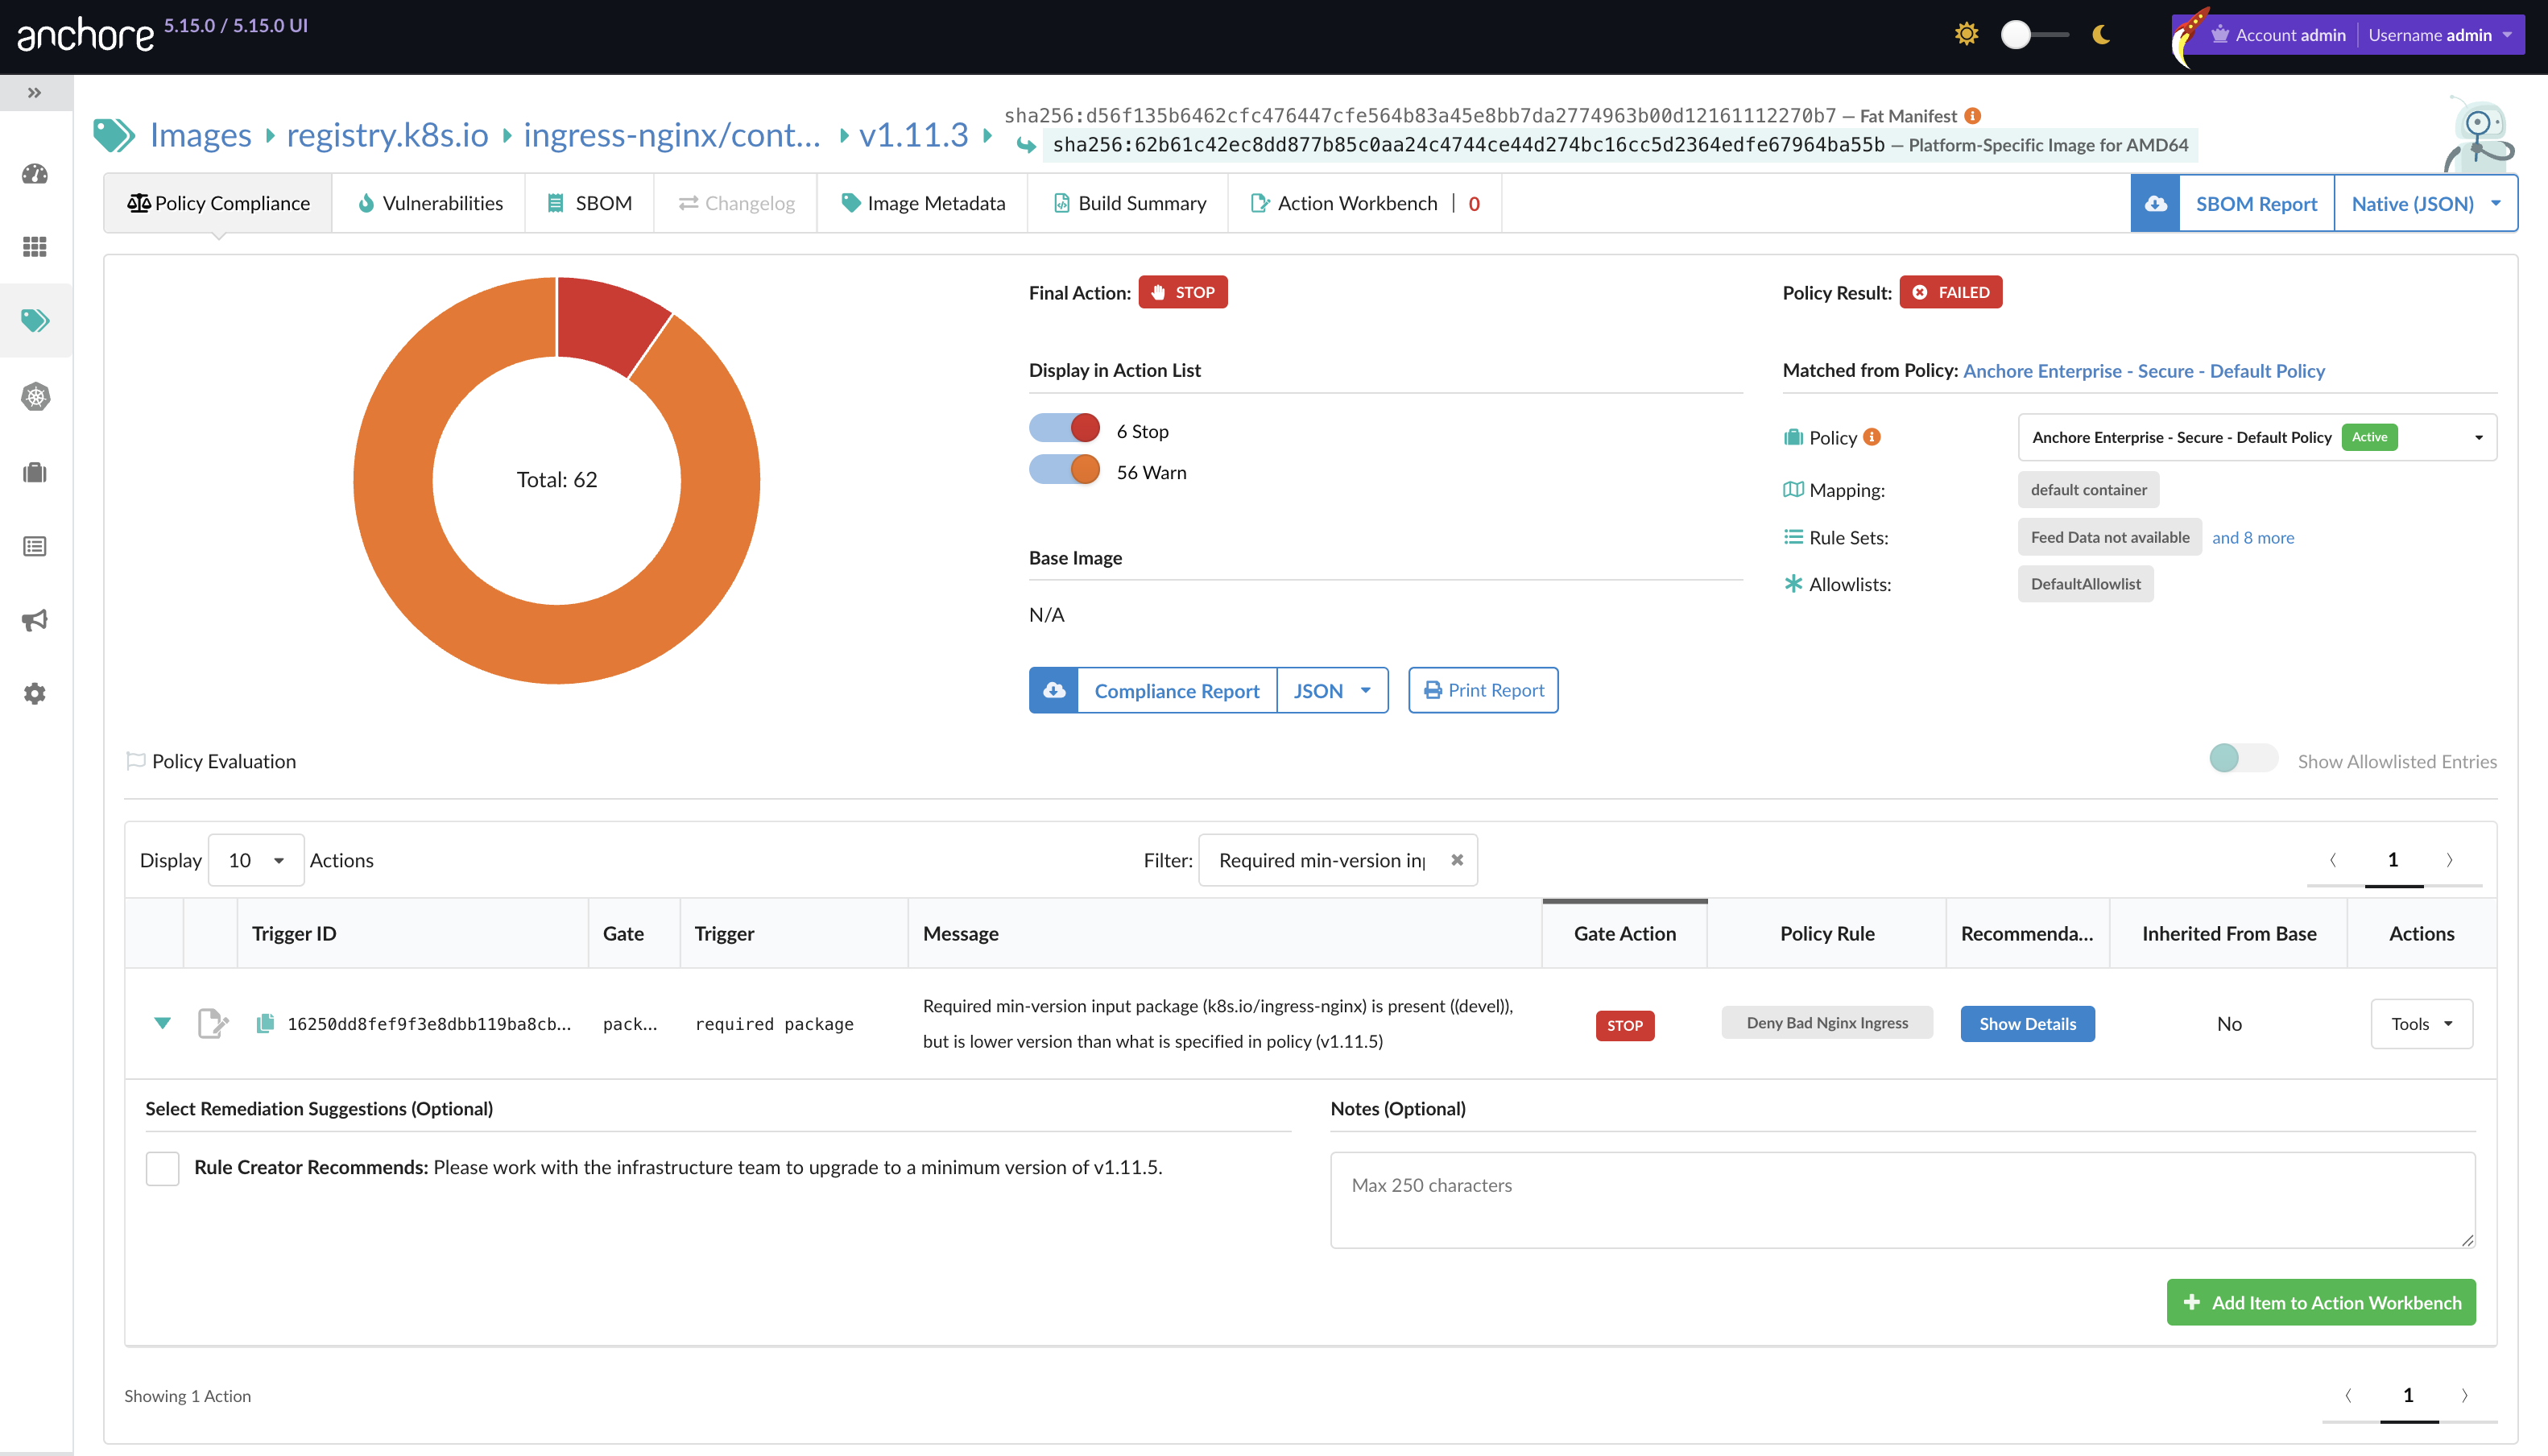
Step 3 — Manage your OSS vulnerabilities
Not only do you need to keep a record of applications as they evolve over time, you have to track the known vulnerabilities of your OSS dependencies to achieve compliance. Just as SBOMs prove provenance, vulnerability scans are proof that your application and its dependencies aren’t vulnerable. These scans are a crucial piece of the evidence that you will need to provide to your compliance officer as you go through the certification process.
Remember the buck stops with you! If the OSS that your application consumes doesn’t supply an SBOM and vulnerability scan (which is essentially all OSS projects) then you are responsible to create them. There is no vendor to pass the blame to for proving that your supply chain is reasonably secure and thus compliant.
Step 4 — Continuous compliance of open source software supply chain
It is important to recognize that modern compliance standards are no longer sprints but marathons. Not only do you have to prove that your application(s) are compliant at the time of audit but you have to be able to demonstrate that it remains secure continuously in order to maintain your certification.
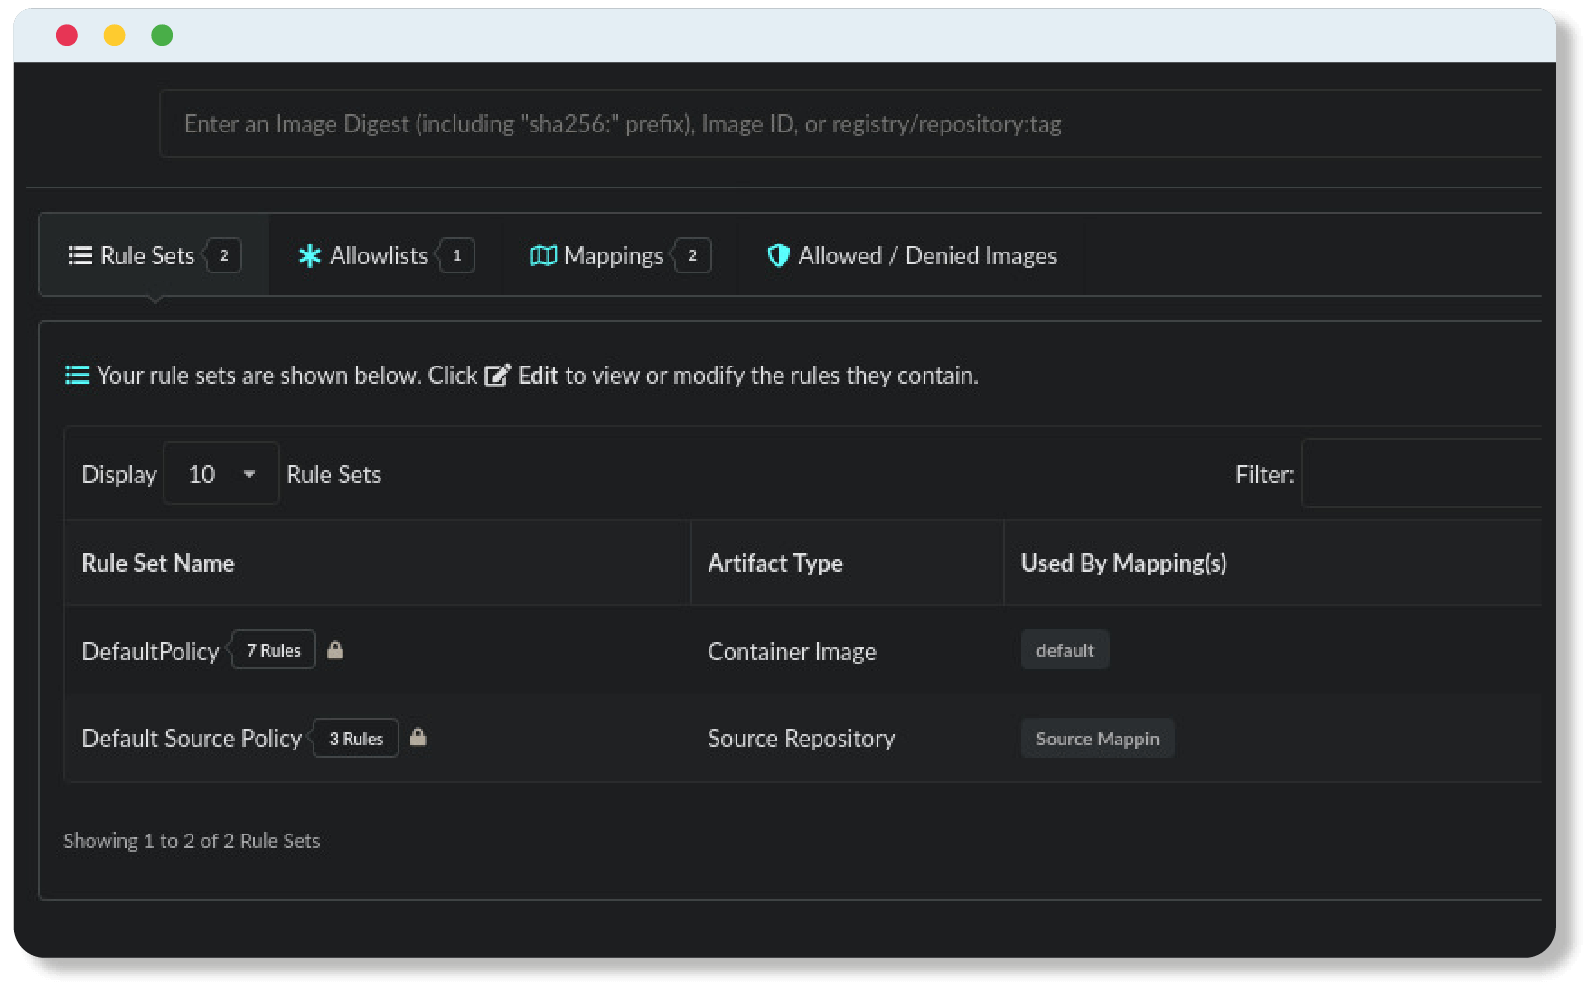
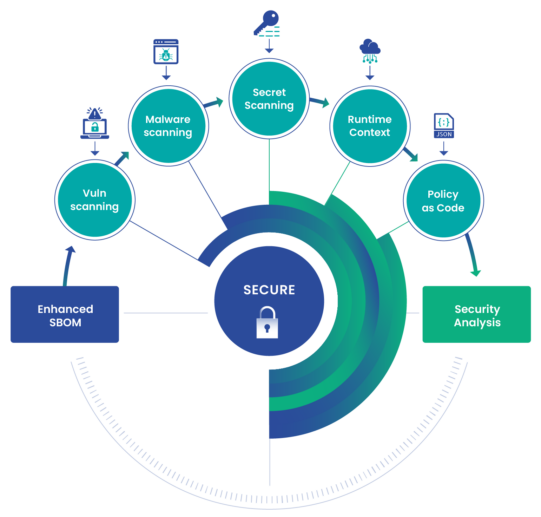
This can be challenging to scale but it is made easier by integrating SBOM generation, vulnerability scanning and policy checks directly into the DevSecOps pipeline. This is the approach that modern, SBOM-powered SCAs advocate for.
By embedding the compliance policy-as-code into your DevSecOps pipeline as policy gates, compliance can be maintained over time. Developers are alerted when their code doesn’t meet a compliance standard and are directed to take the corrective action. Also, these compliance checks can be used to automatically generate the compliance artifacts needed.
You already have an automated DevSecOps pipeline that is producing and delivering applications with minimal human intervention, why not take advantage of this existing tooling to automate open source software compliance in the same way that security was integrated directly into DevOps.
Real-world Examples
To help bring these concepts to life, we’ve outlined some real-world examples of how open source software and compliance intersect:
Open source project has unfixed vulnerabilities
This is far and wide the most common issue that comes up during compliance audits. One of your application’s OSS dependencies has a known vulnerability that has been sitting in the backlog for months or even years!
There are several reasons why an open source software developer might leave a known vulnerability unresolved:
- They prioritize a feature over fixing a vulnerability
- The vulnerability is from a third-party dependency they don’t control and can’t fix
- They don’t like fixing vulnerabilities and choose to ignore it
- They reviewed the vulnerability and decided it’s not likely to be exploited, so it’s not worth their time
- They’re planning a codebase refactor that will address the vulnerability in the future
These are all rational reasons for vulnerabilities to persist in a codebase. Remember, OSS projects are owned and maintained by 3rd-party developers who control the repository; they make no guarantees about its quality. They are not vendors.
You, on the other hand, are a vendor and must meet compliance requirements. The responsibility falls on you. An OSS vulnerability management program is how you meet your compliance requirements while enjoying the benefits of OSS.
Need to fill out a supplier questionnaire
Imagine you’re a cloud service provider or software vendor. Your sales team is trying to close a deal with a significant customer. As the contract nears signing, the customer’s legal team requests a security questionnaire. They’re in the business of protecting their organization from financial risk stemming from their supply chain, and your company is about to become part of that supply chain.
These forms are usually from lawyers, very formal, and not focused on technical attacks. They just want to know what you’re using. The quick answer? “Here’s our SBOM.”
Compliance comes in the form of public standards like FedRAMP, SSDF, NIST, etc., and these less formal security questionnaires. Either way, being unable to provide a full accounting of the risks in your software supply chain can be a speed bump to your organization’s revenue growth and success.
Integrating SBOM scanning, generation, and management deeply into your DevSecOps pipeline is key to accelerating the sales process and your organization’s overall success.
Prove provenance
CISA’s SSDF Attestation form requires that enterprises selling software to the federal government can produce a historical record of their applications. Quoting directly: “The software producer [must] maintain provenance for internal code and third-party components incorporated into the software to the greatest extent feasible.”
If you want access to the revenue opportunities the U.S. federal government offers, SSDF attestation is the needle you have to thread. Meeting this requirement without hiring an army of compliance engineers to manually review your entire DevSecOps pipeline demands an automated OSS component observability and management system.
Often, we jump to cryptographic signatures, encryption keys, trust roots—this quickly becomes a mess. Really, just a hash of the files in a database (read: SBOM inventory) satisfies the requirement. Sometimes, simpler is better.
Discover the “easy button” to SSDF Attestation and OSS supply chain compliance in our previous blog post.
Takeaways
OSS Is Not a Vendor—But You Are! The best way to have your OSS cake and eat it too (without the indigestion) is to:
- Know Your Ingredients: Maintain an SBOM inventory of your OSS supply chain.
- Maintain a Complete Historical Record: Keep track of your application’s source code and build process.
- Scan for Known Vulnerabilities: Regularly check your OSS dependencies.
- Continuous Compliance thru Automation: Generate compliance records automatically to scale your compliance process.
There are numerous reasons to aim for open source software compliance, especially for your software supply chain:
- Balance Gains Against Risks: Leverage OSS benefits while managing associated risks.
- Reduce Financial Risk: Protect your organization’s existing revenue.
- Increase Revenue Opportunities: Access new markets that mandate specific compliance standards.
- Avoid Becoming a Cautionary Tale: Stay ahead of potential security incidents.
Regardless of your motivation for wanting to use OSS and use it responsibly (i.e., securely and compliantly), Anchore is here to help. Reach out to our team to learn more about how to build and manage a secure and compliant OSS supply chain.
Learn the container security best practices to reduce the risk of software supply chain attacks.