Introduction to Kubernetes Security

Background

Over the past couple of years, the software community has seen the rise of Kubernetes. First developed by Google, Kubernetes is the most popular open-source container management tool which automates container deployment, container scaling, and container load balancing. A few of the major features and benefits of Kubernetes are:

  • Automatic Binpacking
  • Service Discovery & Load Balancing
  • Storage Orchestration
  • Self Healing
  • Horizontal Scaling

Kubernetes is also backed by a large community and hosted by the Cloud Native Computing Foundation. When organizations increase their use of containers some of the challenges they being to run into include: Automated scaling up and down of containers, container management and deployment, distributing load between containers, etc. To address these issues, it generally becomes necessary to implement a container orchestration platform to reduce operational burden. Kubernetes can be run on-premises or on any one of the major cloud providers (AWS, Azure, GCP, IBM Cloud).

Given that Kubernetes is already being used widely in production environments, securing these workloads should be a top priority. In this post, I will discuss a handful of common Kubernetes security basics and best practices to administer in order to avoid your clusters becoming compromised.

Need a better solution for Kubernetes vulnerability scanning and image security? Anchore can help.

Staying Up to Date

As with any software component, updating to the latest version of the software will greatly reduce the risk of your system being compromised. When running unpatched software components with known vulnerabilities, hackers are typically well-aware, and ready to exploit these weaknesses. One of the more recently well-known vulnerabilities discovered in Kubernetes was CVE-2018-1002105. If you are running managed Kubernetes in a cloud provider, these managed service providers make it simple to upgrade to the latest version. In addition to running the latest version of Kubernetes, it is imperative to stay up to date on the software components that make up the applications you are running. Providing your teams with the necessary tools for SAST for proprietary source code and container image scanning at the CI or container registry layer will help ensure that you are not running vulnerable software in Kubernetes environments.

Note: This includes the security and hardening of the underlying hosts. In a similar vein, make sure that Docker itself is also configured, secure, and best practices for Docker development are also being followed.

Resource Quotas

Take advantage of being able to define resource quotas for your Kubernetes resources. If resources are left unbounded, they have the potential to lead to total cluster unavailability and potentially draw on hardware resources as well. For more information on this, check out the Resource Quotas documentation.

Role-based Access Control

Kubernetes RBAC allows users to exercise fine-grained control over how users access the API resources running on your cluster. Cloud providers will likely have RBAC enabled by default, but it is a good practice to check to verify that your Kubernetes deployment has enabled this feature. Generally speaking, it is good practice to apply the principle of least privilege to make sure users and services only have the access needed to do their jobs. You can create RBAC permission that applies to your entire cluster, or to specific namespaces within your cluster. For more information of RBAC in Kubernetes, I recommend reading the Kubernetes documentation on Using RBAC Authorization. If you are using a cloud provider to manager Kubernetes I also recommend reading up on how each of these providers works with access and authentication as you may occasionally run into permission issues:

Role API

In the Kubernetes RBAC API, a role contains rules that represent a set of permissions. Below is an example Role in the default namespace that can be used to grant read access to pods:

kind: Role
apiVersion: rbac.authorization.k8s.io/v1
metadata:
  namespace: default
  name: pod-reader
rules:
- apiGroups: [""] # "" indicates the core API group
  resources: ["pods"]
  verbs: ["get", "watch", "list"]t

Principle of Least Privilege a Step Further

Above I mentioned applying the principle of least privilege to RBAC in Kubernetes. However, this same principle can be applied to your software components as well. By restricting access so components can only access the information and resources they need to operate correctly, the blast radius of attack is greatly reduced should one occur.

Enable Audit Logging

Kubernetes auditing provides a security-relevant chronological set of records documenting the sequence of activities that have affected the system by individual users, administrators or other components of the system. The logs will help to answer the following questions: What happened? When did it happen? Who initiated it? On what did it happen? Where was it observed? From where was it initiated? To where was it going? Additionally, shipping these logs off the server and connecting to Splunk, Elasticsearch, Kafka, etc. to generate dashboards and alerts for suspicious activity will help with monitoring.

Create and Use Namespaces

Namespaces are essentially virtual clusters inside of your Kubernetes cluster. You can have multiple namespaces inside a single Kubernetes cluster, and they are all logically isolated from each other. Namespaces help with team organization, security, and performance. Kubernetes namespaces greatly help with organization as different development teams may have different environments and systems they will be working with. The creation of separate namespaces for teams, projects, and environments, will reduce the risk of a team accidentally overwriting or disrupting a service without realizing it. On the security side, imagine a scenario where a development team would like to maintain a space in the cluster with certain, more relaxed permissions, where they can build and run their application. The operations team would also like to maintain a space on the cluster where they can enforce strict procedures on who can or cannot manipulate the set of Pods, Services, and Deployments. By creating two namespaces, one for development, and one for production, these sets of permissions can be abstracted from each other while still allowing both teams to take advantage of the existing Kubernetes cluster.

Note: In many cases, the creation and use of namespaces in Kubernetes can actually increase performance as the Kubernetes API will have a smaller set of objects to work with.

Create and Define Cluster Network Policies

In Kubernetes, a network policy is a specification of how groups of pods are allowed to communicate with each other and other network endpoints. Network Policies allow users to limit connections between Pods, this reduces the compromise radius. An example of a basic network policy would be: Block traffic from other namespaces by default. If you are further interested in network security for Kubernetes, I recommend taking a look at Calico which is an open-source networking and network security solutions for containers, virtual machines, and native host-based workloads.

A Change in Security

Docker and Kubernetes have changed the way organizations need to implement best practices, policies, and security controls. With the increased adoption of microservices and containers, applications and their environments have become increasingly dynamic. Container technologies allow for rapid development and deployment of applications, and traditional security models are not sufficiently scalable to meet the required security controls for highly-scalable automated solutions like Kubernetes. Security is every team member’s responsibility as Development, Platform, Network, QA, and Security teams are now required to collaboratively define the practices they would like in place in order to work together in an agile DevSecOps environment.

Introduction to Amazon EKS

Amazon EKS diagram of different EKS workers.

In June of 2018, Amazon announced the general availability of their Elastic Container Service for Kubernetes. Given that at Anchore we deliver our products as Docker container images, it came as no surprise to us that our users and customers would begin deploying our software on EKS. Since Kubernetes, Kubernetes on AWS, and Anchore on EKS adoption have all increased, I thought it best to give EKS a shot.

Getting Started

For the scope of learning purposes, I thought I’d test out creating an EKS cluster, and launching a simple application. If you aren’t completely familiar with Kubernetes I highly recommend checking out the tutorials section of the website just so some of the concepts and verbiage I use make a little more sense. I also recommend reading about kubectl which is the command line interface for running actions against Kubernetes clusters.

In addition to the above reading, I also recommend the following:

Creating a Cluster

There are a couple of ways to create an EKS cluster, with the console or with the AWS CLI.

Create Cluster Using AWS Console

To begin, navigate here and select create cluster.

There are several pieces of information you’ll need to provide AWS for it to create your cluster successfully.

  • Cluster name (should be a unique name for your cluster)
  • Role name
  • VPC and Subnets
  • Security groups

Role name

Here I will need to select the IAM role that will allow Amazon EKS and the Kubernetes control plane to manage AWS resources on my behalf. If you have not already, you should create an EKS service role in the IAM console.

VPC and subnets

Select a VPC and choose the subnets in the selected VPC where the worker nodes will run. If you have not created a VPC, you will need to create one in the VPC console and create subnets as well. AWS has a great tutorial on VPC and Subnet creation here.

Note: Subnets specified must be in at least two different availability zones.

Security groups

Here I choose security groups to apply to network interfaces that are created in my subnets to allow the EKS control plane to communicate with worker nodes.

Once all the necessary requirements have been fulfilled, I can create the cluster.

Create cluster using AWS CLI

I can also create a cluster via the AWS CLI by running the following:

aws eks --region region create-cluster --name devel --role-arn arn:aws:iam::111122223333:role/eks-service-role-AWSServiceRoleForAmazonEKS-EXAMPLEBKZRQR --resources-vpc-config subnetIds=subnet-a9189fe2,subnet-50432629,securityGroupIds=sg-f5c54184

I would simply update --role-arnsubnetIds, and securityGroupIds into the above command.

Once my cluster has been created the console looks like the following:

Amazon EKS clusters screen.

Next I can use the AWS CLI update-kubeconfig command to create or update my kubeconfig for my cluster.

aws eks --region us-east-2 update-kubeconfig --name anchore-demo

Then I test the configuration: kubectl get svc

Which outputs the following:

NAME         TYPE        CLUSTER-IP   EXTERNAL-IP   PORT(S)   AGE
kubernetes   ClusterIP   172.20.0.1   <none>        443/TCP   7m

Launch Worker Nodes

I created and launched worker nodes via the AWS CloudFormation console. It is important to note that Amazon EKS worker nodes are just standard Amazon EC2 instances. To create the stack, I simply selected create stack and added this Amazon S3 template URL, then I just filled out the parameters on the following screens.

Next, I need to enable the worker nodes to join the cluster. I will do so by downloading and editing the AWS authenticator configuration map.

apiVersion: v1
kind: ConfigMap
metadata:
  name: aws-auth
  namespace: kube-system
data:
  mapRoles: |
    - rolearn: <ARN of instance role (not instance profile)>
      username: system:node:{{EC2PrivateDNSName}}
      groups:
        - system:bootstrappers
        - system:nodes

Note – The ARN of instance role is the NodeInstanceRole value you can see in the output of the creation of your CloudFormation stack.

Next, apply the configuration: kubectl apply -f aws-auth-cm.yaml and view the nodes: kubectl get nodes

NAME                                       STATUS    ROLES     AGE       VERSION
ip-10-0-1-112.us-east-2.compute.internal   Ready     <none>    3m        v1.11.5
ip-10-0-1-36.us-east-2.compute.internal    Ready     <none>    3m        v1.11.5
ip-10-0-3-21.us-east-2.compute.internal    Ready     <none>    3m        v1.11.5

I can also view them in the EC2 console:

EC2 console clusters.

Working with Services

In Kubernetes, a LoadBalancer service is a service that points to external load balancers that are not in your Kubernetes clusters. In the case of AWS, and this blog, an external load balancer (ELB) will be created automatically when I create a LoadBalancer service.

In order to do this, I must first define my service like so:

# my-loadbalancer-service.yaml
apiVersion: v1
kind: Service
metadata:
  name: mylbservice
spec:
  type: LoadBalancer
  selector:
    app: nginx
  ports:
    - protocol: TCP
      port: 80
      targetPort: 80

Then I simply create the service.

kubectl create -f my-loadbalancer-service.yaml

To verify, I can describe my service.

kubectl describe service mylbservicet

Which outputs the following:

Name:                     mylbservice
Namespace:                default
Labels:                   <none>
Annotations:              <none>
Selector:                 app=nginx
Type:                     LoadBalancer
IP:                       172.20.16.171
LoadBalancer Ingress:     a0564b91c4b7711e99cfb0a558a37aa8-1932902294.us-east-2.elb.amazonaws.com
Port:                     <unset>  80/TCP
TargetPort:               80/TCP
NodePort:                 <unset>  32005/TCP
Endpoints:                10.0.1.100:80,10.0.1.199:80,10.0.3.19:80
Session Affinity:         None
External Traffic Policy:  Cluster
Events:
  Type    Reason                Age   From                Message
  ----    ------                ----  ----                -------
  Normal  EnsuringLoadBalancer  10m   service-controller  Ensuring load balancer
  Normal  EnsuredLoadBalancer   10m   service-controller  Ensured load balancer

I can see the created load balancer by navigating to the EC2 console and selecting Load Balancers

alt text

Or better yet, hit the LoadBalancer Ingress:

Confirmation of nginx installed and working.

Conclusion

Now I just quickly walked through a simple application deployment on EKS. As you’ve probably gathered, the most challenging part is all the setup. When you are ready to start deploying more complex containerized applications on EKS you now have all the steps needed to get a cluster set up quickly. At Anchore, I’m always excited to work with our users and customers leveraging Amazon EKS to run Anchore. To find out more about how Anchore can be deployed, I highly recommend checking out our helm chart and reading more about Helm on EKS.

There is certainly a learning curve to Amazon EKS that requires a bit of knowledge on several different Amazon services in order to manage Kubernetes clusters effectively. By far the longest piece of this was getting the cluster set up. Any AWS-heavy users should be thrilled about the ability to make running containerized workloads in Kubernetes easy and cost-effective on the most popular cloud provider. With AWS still reigning as the top public cloud provider, it is only fitting Amazon created a service to adhere to the tremendous amount of container and Kubernetes adoption over the past two years.

Operational Awareness and Performance Tuning For Anchore Part 2

If you haven’t read Part 1 please do so before reading this article as we rely heavily on concepts and vocabulary established in that article. In this article, we’ll dive more deeply into matching metrics gathered in our first part with opportunities to tune the performance of a given Anchore deployment.

Just to refresh, the steps for image analysis and evaluation in Anchore Engine is as follows:

1) The Image is downloaded.
2) The Image is unpacked.
3) The Image is analyzed locally.
4) The result of the analysis is uploaded to core services.
5) The analysis data that was uploaded to core services is then evaluated during a vulnerability scan or policy evaluation.

Steps 1-3 are the most intensive operational costs for Anchore. Package, file and image analysis is both CPU and Disk intensive as operations. Making sure we’re on a host that has good disk throughput and high single-thread CPU performance will help greatly here.

Overall deployment performance depends on a few things: how the services interact and can scale together, how performant the database service is in response to the rest of the services, and how each service is provisioned with their own resources.

How To Improve Step 1: Enable Layer Caching

It is very likely that many of your images share common layers, especially if a standard base image is being used to build services. Performance can be improved by using caching on each of those layers contained in your image manifest. Anchore has a setting that enables a layer-specific caching for analyzers in order to reduce operational cost over time. In your Prometheus analysis, look at anchore_analysis_time_seconds for insight into when layer caching would be beneficial.

To enable the cache you can define a temp directory the config.yaml for each analyzer, shown below. We should make sure that whatever you define should have the same throughput considerations as scaling the overall container throughput: Make sure you have fast SSD or local disk to each analyzer, as the cache layer is not shared between nodes, and is ephemeral.

If we have set the following mount for a tmp_dir:

tmp_dir: '/scratch'

Then in order to utilize /scratch within the container make sure config.yaml is updated to use /scratch as the temporary directory for image analysis. We suggest the temporary directory should be sized to at least 3 times the uncompressed image size to be analyzed. To enable the layer caching, let’s enable the “layer_cache_enable” parameter and the “layer_cache_max_gigabytes” parameter as follows:

analyzer:
    enabled: True
    require_auth: True
    cycle_timer_seconds: 1
    max_threads: 1
    analyzer_driver: 'nodocker'
    endpoint_hostname: '${ANCHORE_HOST_ID}'
    listen: '0.0.0.0'
    port: 8084
    layer_cache_enable: True
    layer_cache_max_gigabytes: 4

In this example, the cache is set to 4 gigabytes. The temporary volume should be sized to at least 3 times the uncompressed image size + 4 gigabytes. The minimum size for the cache is 1 gigabyte and the cache uses a least recently used (LRU) policy. The cache files will be stored in the anchore_layercache directory of the /tmp_dir volume.

How To Improve Steps 2-3: Improve Service I/O Throughput

This is pretty straight forward: better throughput performance for CPU and disk will improve the most I/O and CPU intensive tasks of Anchore’s analysis process. High single-thread CPU performance and fast disk read/write speeds for each Anchore analyzer service will speed up the steps where we pull, extract and do file analysis of any given container image. On premise, this may mean a beefier CPU spec and SSDs in your bare metal. In the cloud, you may be choosing to not run EBS to back your analyzer tmp directories and selecting for higher compute instances.

How To Improve Step 4: Scaling Anchore Engine Components

This tip is to address a very wide scope of performance, so there’s a wide scope of metrics to be watching, but in general scaling analyzer services and core services according to a consistent ratio is one way to ensure throughput overall can be maintained. In general, we suggest 1 core service for every 4 analyzers. Keeping this scale means that we can ensure throughput for core services grows with the number of analyzers.

How To Improve Step 5: Tune Max Connection Settings For Postgres

One of the most common questions about deploying Anchore in production is how to architect the Postgres instance used by Anchore Engine. While Anchore has installation methods that include a Postgres service container in our docker-compose YAML and helm chart, we do expect that production deployments will not use that Postgres container and instead will utilize a Postgres service, either on-premises or in the cloud (such as RDS, etc.) Using a cloud service like Using something like RDS is not only an easy way to control allocated resources to your DB instance but RDS specifically also automatically configures Postgres with pretty good settings for the chosen instance type out of the box.

For a more in-depth guide on tuning your Postgres deployments, you’ll want to consult with Postgres documentation or use a tool like pg_tune. For this guide’s purpose, we can check the performance stats in the DB with “select * from pg_stat_activity;” executed in your Postgres container.

When you are looking at Postgres performance stats from your pg_stat_activity table, you want to pay attention to connection statistics. Every Anchore service touches the database, and every service has a config YAML file where you can set client pool connections with a default set to 30. The setting on the anchore services side control how many client connections each service can make concurrently. In the Postgres configuration, max connections control how many clients total can connect at once. Anchore uses sql alchemy, which employs a connection pooling technique, so each service may allocate connection pool size number of client connections.

For example, in pg_stat_database we can see numbackends. We can from that number and the max_connections setting in pg_settings infer how close we are to forcing connection waits. This is because the percentage of max connections in use is numbackends as a percentage of max_connections. In a nutshell, with Anchore database client connections setting at 300, and deployment with 100 Anchore services, that could lead to 30000 client connections to the database. Without adjusting max_connections, this could lead to a serious bottleneck.

We typically recommend leaving the Anchore client max connection setting at its defaults and bumping up the max connections in Postgres configuration appropriately. With the client default at 30, the corresponding max connections setting for our deployment of 100 Anchore services should be at least 3000 (30 * 100). As long as your database has enough resources to handle incoming connections then the Anchore service pool won’t bottleneck.

I want to caution that this guide isn’t the comprehensive list of things that can be tuned to help performance. It is intended to address a wide audience and is based on the most common performance issues we’ve seen in the field.

Going Deeper with Anchore Policies, Using Whitelists

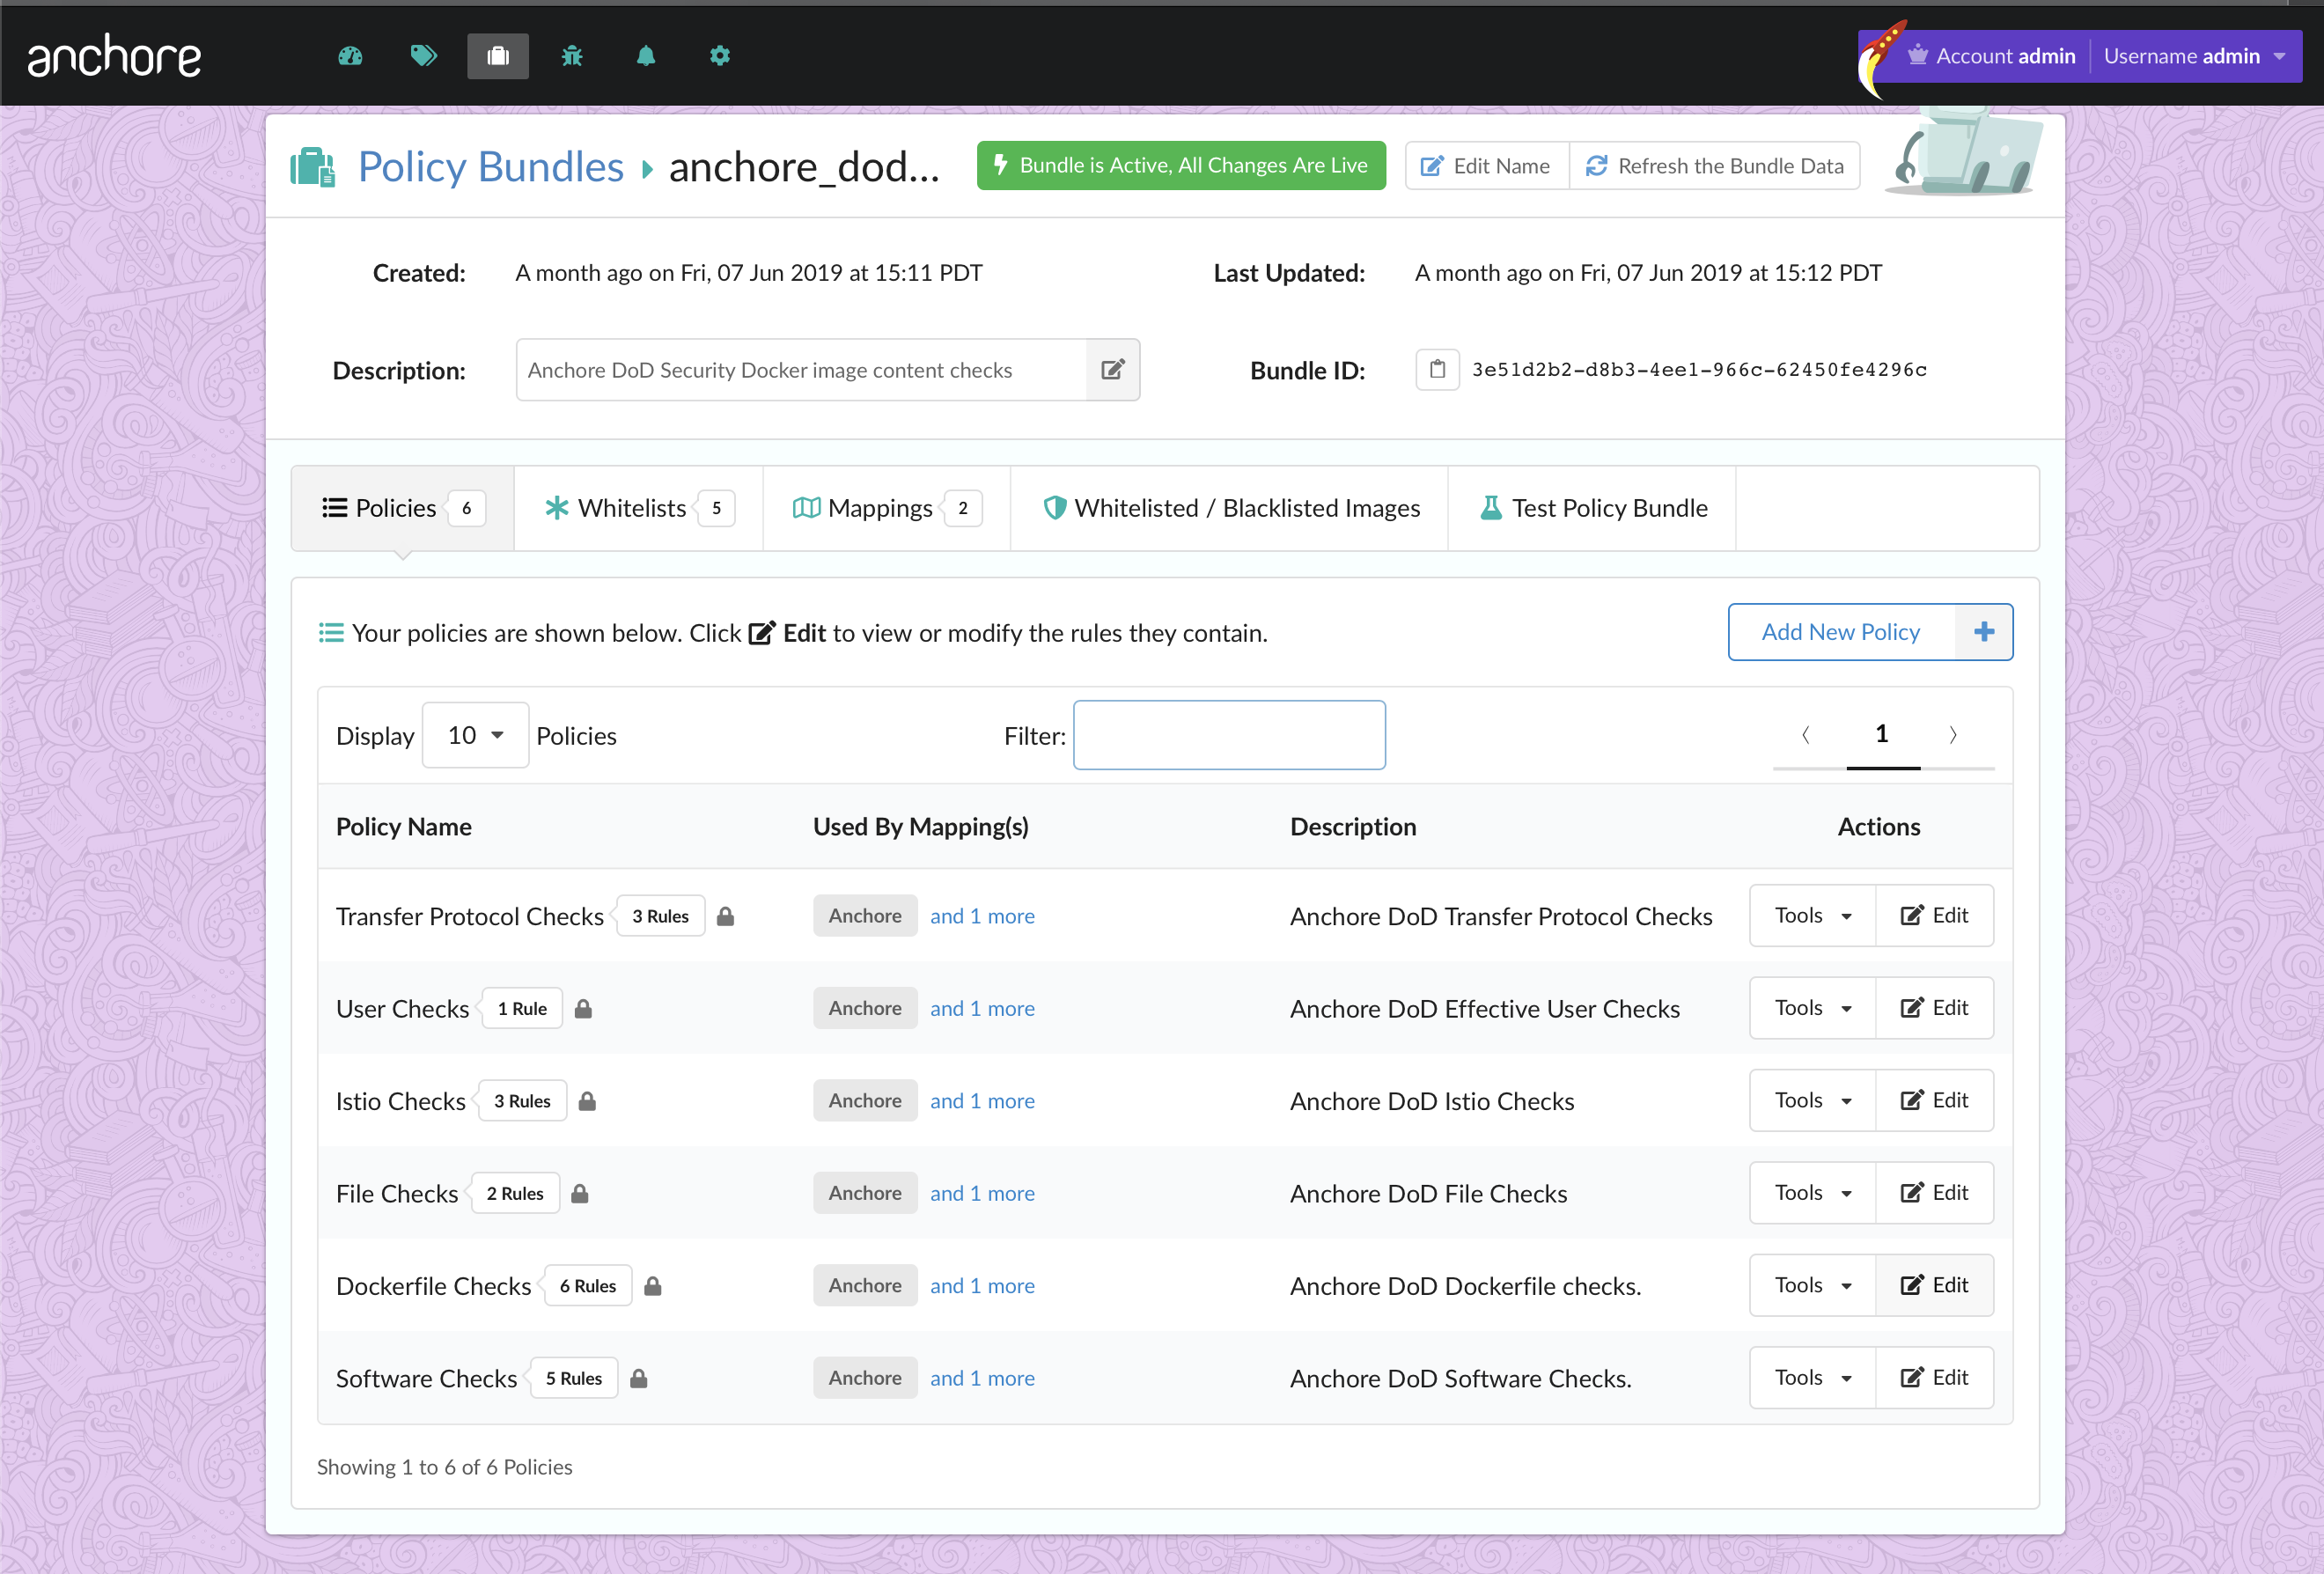
At Anchore we are consistently working with our users and customers to help them gain better insight into the contents of their container images, and more importantly, helping them create rules to enforce security, compliance, and best practices. The enforcement element is achieved through Anchore policy evaluations, and more specifically, the rules are defined within the policies component of a policy bundle.

Anchore policy bundles are the unit of policy definition and evaluation. Anchore users may have multiple policy bundles, but for policy evaluation, the user must specify a bundle to be evaluated or default to the bundle currently marked as active. One of the components of a policy bundle is whitelists. A whitelist is a set of exclusion rules for trigger matches found during policy evaluation. A whitelist defines a specific gate and trigger_id that should have its action recommendation statically set to go. When a policy rule result is whitelisted, it is still present in the output of the policy evaluation, but its action is set to go and it is indicated that there was a whitelist match. The overarching idea is to give developers, operations, and security team members an effective mechanism for ignoring vulnerability matches that are known to be false positives or ignoring vulnerabilities on specific packages (if they have been patched), or any other agreed-upon reason for creating a whitelist rule.

Whitelists in Anchore Enterprise

Within the Anchore Enterprise UI, navigating to the Whitelists tab will show the lists of whitelists that are currently present in the current policy bundle.

Anchore Enterprise whitelists tab for policy bundles.

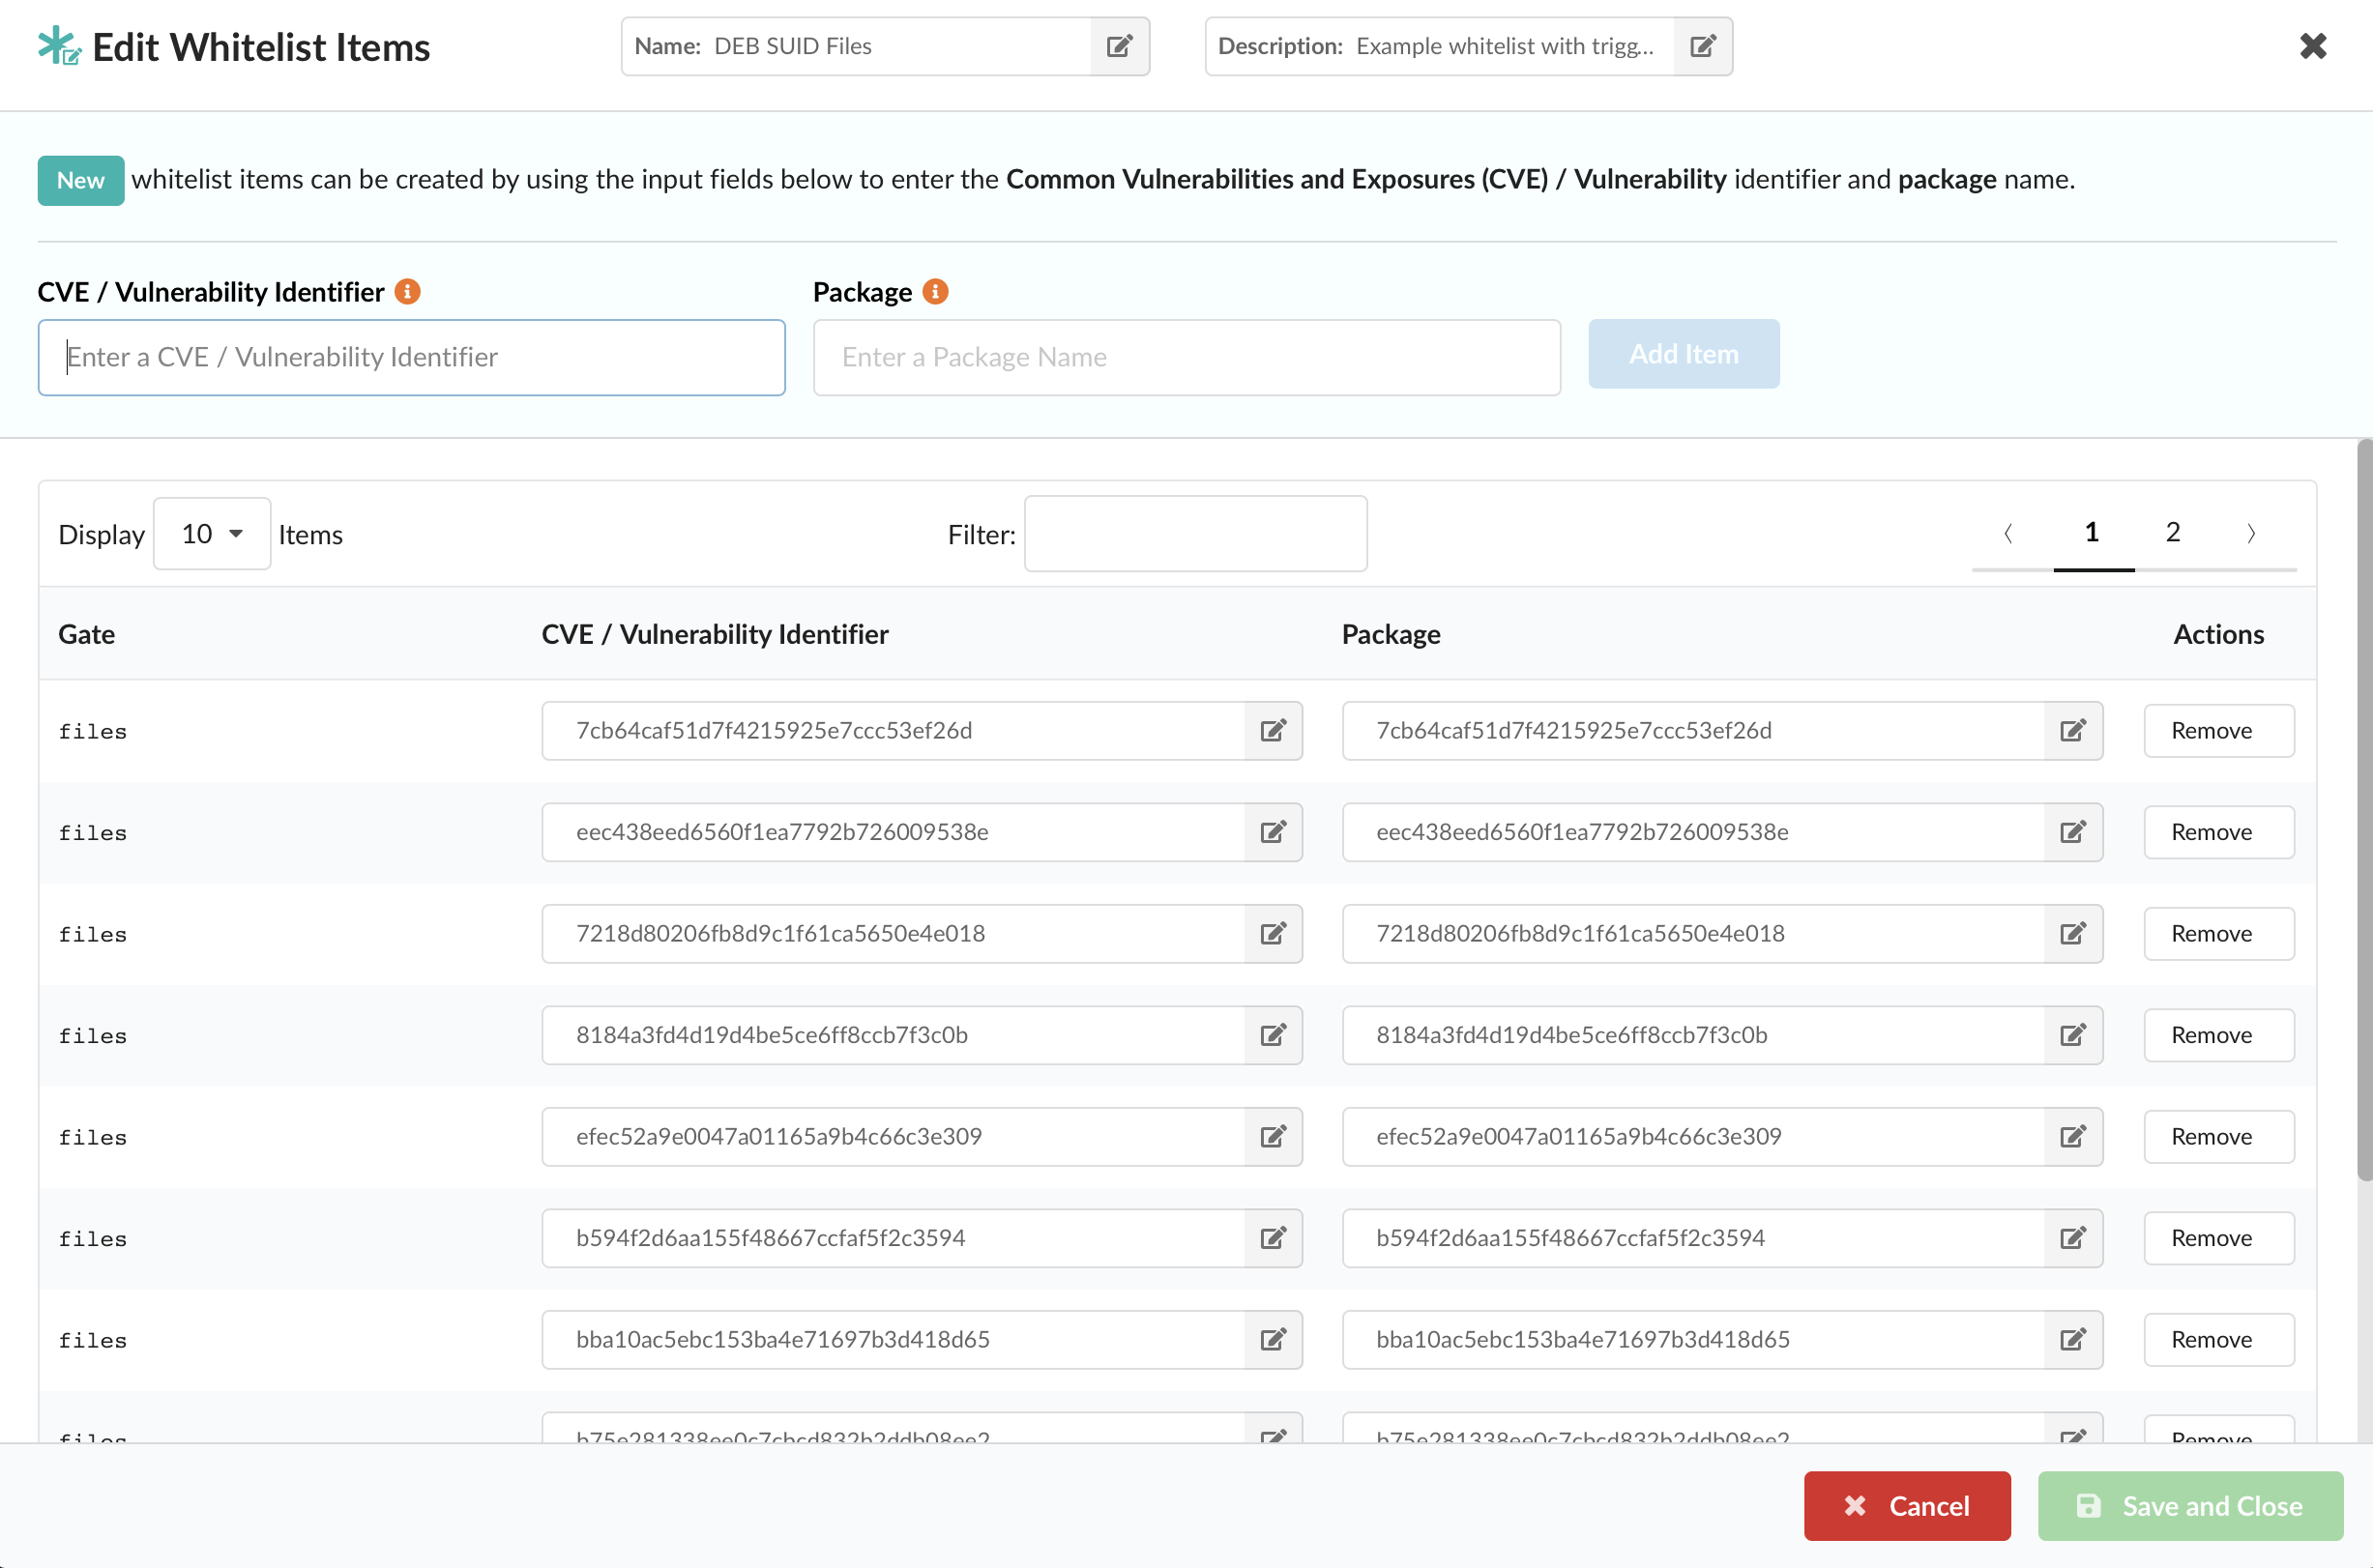
Selecting the edit button on the far right under the action column will bring up the whitelist editor where users have the ability to create new whitelist entries or modify existing ones.

Anchore whitelist editor for list items.

The example whitelist above is represented as JSON below:

{
  "comment": "Default global whitelist",
  "id": "37fd763e-1765-11e8-add4-3b16c029ac5c",
  "items": ,
  "name": "Global Whitelist",
  "version": "1_0"
}

Components of a Whitelist in Anchore


  • Gate: The gate to whitelist matches from (ensures trigger_ids are not matched in the wrong context).
  • Trigger Id: The specific trigger result to match and whitelist. This id is gate/trigger specific as each trigger may have its own trigger_id format. Most commonly, the CVE trigger ids produced by the vulnerability package gate-trigger. The trigger_id may include wildcards for partial matches as shown with the second item.
  • Id: An identifier for the whitelist rule. It only needs to be unique within the whitelist object itself.

It is important to note that if a whitelist item matches a policy trigger output, the action for that particular output is set to go and the policy evaluation result will inform the user that the trigger output was matched for a whitelist item.

Uploading a Whitelist in Anchore Enterprise

Through the UI, Anchore users have the option to upload a whitelist by selecting the Upload Whitelist button which brings up the following:

Uploading a whitelist to Anchore platform.

Viewing Whitelisted Entries

Anchore users can view the whitelisted entries in the Policy Evaluation table as shown below:

View whitelist entries in the Anchore policy evaluation tab.

Additionally, users can optionally Add / Remove a particular whitelist item as shown below:

Add or remove whitelist items from Anchore.

Conclusion

When working with the security risks associated with both the operating system and non-operating system packages, ignoring issues is sometimes a necessary action. At Anchore, the goal is to provide teams a solid means of managing vulnerabilities and packages that may need to be suppressed. Due to the fact that working with whitelists and policies carries a certain level of risk, Anchore Enterprise provides role-based access control to make policy editing only available to users who have been assigned the appropriate level of permissions. In the example below, the current user only has ‘read-only’ access and cannot make any changes to the whitelist.

Anchore policy bundles on platform.

When working with whitelisted items, it is important to remember that this does not mean there are no longer security issues, only that these particular items now have a go output associated with them. Remember to use carefully and in moderation. Lastly, as with any CVE remediation and policy rule creation, consult across your development, security, and operations teams to collectively come up with acceptable actions that best suit your organization’s security and compliance requirements.

Further information on Anchore Enterprise can be found on our website.

Operational Awareness & Performance Tuning For Anchore

This series will focus on topics taken directly from customer interactions, community discussion and practical, real-world use of Anchore Engine deployments. The goal will hopefully be to provide lessons learned from real-world deployments of Anchore.

Part 1: Concepts and Metrics

In the first set of posts in this series, I will walk through how to evaluate and tune your Anchore deployment for better image analysis performance. To do so, we’ll discuss the actions Anchore Engine takes to pull, analyze and evaluate images and how that is affected by configuration and deployment architecture. We’ll also point out how you can get metrics on each of these functions to determine what you can do to improve the performance of your deployment.

Firstly, I want to take a moment and thank the Anchore Community Slack and also the Anchore Engineering team for helping me delve very deeply into this. They’ve been fantastic, and if you haven’t done so yet make sure you join our slack community to keep up to date with the project and product, as well as exchange ideas with the rest of the community.

One thing to understand about Anchore’s approach is that the acts of image analysis (downloading and analyzing the image contents) and of image scanning (for vulnerabilities) are separate steps. Image analysis only needs to happen once for any given image digest. The image digest is a unique ID for a given image content set, and Anchore is capable of watching an image tag in an upstream repository and detect when a new version of the content of that image (the digest) has been associated with a tag.

Vulnerability scans and policy evaluations are performed against any image (digest) that has been analyzed. When updates happen to either a vulnerability feed or a policy bundle, Anchore can re-scan an image to produce the latest vulnerability report or policy evaluation report for any given digest without the need to re-analyze the image (digest).

Put simply, our discovery of the contents of an image digest is separate from our evaluation of the vulnerabilities or policy compliance of the same said image digest. Image analysis (ie: the downloading, unpacking and discovery of contents of an image digest) is a far more expensive operation from an I/O perspective than image scanning (ie: the scanning said image digest analysis data for vulnerabilities or policy evaluation.)

Let’s review what actually happens to a container image (digest) as Anchore Engine consumes and analyzes it:

1) The Image is downloaded.
2) The Image is unpacked.
3) The Image is analyzed locally.
4) The result of the analysis is uploaded to core services.
5) The analysis data that was uploaded to core services is then evaluated during a vulnerability scan or policy evaluation.

The first four steps are what we call image analysis. That last step is image evaluation. Each of those actions has specific performance implications in your deployment.

Most importantly is to know what parts of your deployment require changes to improve performance and to do that we need information. Let’s start by enabling metrics on our Anchore Engine deployment.

To enable the metrics option in Anchore Engine, look to set the following in your Anchore Engine configuration file config.yaml:

metrics:
  enabled: True

Once that is enabled and the services brought up a /metrics route will be exposed on all individual Anchore services that are listening on a network interface and require authentication. You can then configure Prometheus to scrape data from each Anchore service. These are those services:

1) apiext: Running on port 8228 this is the External API service.
2) catalog: Running on port 8082 this is the internal catalog service.
3) simplequeue: Running on port 8083 this is the internal queuing service
4) analyzer: Running on port 8084 this is the service that analyzes the containers pulled into Anchore.
5) policy_engine: Running on port 8087 this is the internal service that provides the policy engine for evaluation and action on the analyzed containers.

Only the external API service is typically enabled for external access. All other services are used only by the Anchore Engine. Prometheus should have network access to each service to be scraped and the Prometheus service should be configured with credentials to access the engine. Here’s an example:

global:
  scrape_interval: 15s
  scrape_timeout: 10s
  evaluation_interval: 15s
alerting:
  alertmanagers:
  - static_configs:
    - targets: []
    scheme: http
    timeout: 10s
scrape_configs:
- job_name: anchore-api
  scrape_interval: 15s
  scrape_timeout: 10s
  metrics_path: /metrics
  scheme: http
  static_configs:
  - targets:
    - anchore-engine:8228
  basic_auth:
    username: admin
    password: foobar

- job_name: anchore-catalog
  scrape_interval: 15s
  scrape_timeout: 10s
  metrics_path: /metrics
  scheme: http
  static_configs:
  - targets:
    - anchore-engine:8082
  basic_auth:
    username: admin
    password: foobar

- job_name: anchore-simplequeue
  scrape_interval: 15s
  scrape_timeout: 10s
  metrics_path: /metrics
  scheme: http
  static_configs:
  - targets:
    - anchore-engine:8083
  basic_auth:
    username: admin
    password: foobar

- job_name: anchore-analyzer
  scrape_interval: 15s
  scrape_timeout: 10s
  metrics_path: /metrics
  scheme: http
  static_configs:
  - targets:
    - anchore-engine:8084
  basic_auth:
    username: admin
    password: foobar

- job_name: anchore-policy-engine
  scrape_interval: 15s
  scrape_timeout: 10s
  metrics_path: /metrics
  scheme: http
  static_configs:
  - targets:
    - anchore-engine:8087
  basic_auth:
    username: admin
    password: foobar

This config file would go into the anchore-prometheus.yaml file created as part of the docker-compose or helm deployment.

The last bit of information you’ll want is metrics on the performance of your postgres service. For Anchore specifically, we want to know mostly about connection statistics and I/O timing. This can be discovered with the execution of something like “select * from pg_stat_activity;” within your DB container. If you need help exploring your postgres instance inside of Docker, here’s a good post to use as reference: https://markheath.net/post/exploring-postgresql-with-docker

Knowing how long it takes your Anchore deployment to scan your images, how the other services are receiving and sending data, and having metrics on the postgres database performance is key to knowing where you can help tune your system.

If you would like to see the metrics from Prometheus you need only hit the API endpoint for the service you want metrics on using an authenticated call. For example, using a docker-compose exec command, it would look like this:

docker-compose exec anchore-engine curl http://admin:foobar@localhost:8087/metrics

That’s a call to get metrics on the policy engine. Refer to the config YAML above to hit the port needed for the service you would require metrics from.

In Part 2 of this series we will go in-depth to break down the functional steps described above to match them with the gathered metrics, and then evaluate how to tune our configuration and deployment accordingly.

Inline scanning with Anchore Engine

Note: Anchore Engine’s feed service will be deprecated in April 2022 (per this announcement) in favor of improved open source tools, Syft and Grype. For full container vulnerability scanning and policy & compliance solutions that address the increasing security demands of the software supply chain, check out Anchore Enterprise.

With Anchore Engine, users can scan container images to generate reports against several aspects of the container image – vulnerability scans, content reports (files, OS packages, language packages, etc), fully customized policy evaluations (Dockerfile checks, OSS license checks, software package checks, security checks, and many more). With these capabilities, users have integrated an anchore-engine image scan into CI/CD build processes for both reporting and/or control decision purposes, as anchore policy evaluations include a ‘pass/fail’ result alongside a full report upon policy execution.

Up until now, the general setup required to achieve such integration has included the requirement to stand up an anchore-engine service, with its API exposed to your CI/CD build process and make thin anchore API client calls from the build process to the centralized anchore-engine deployment. Generally, the flow starts with an API call to ‘add’ an image to anchore-engine via an API call to the engine, at which point the engine will pull the referenced image from a docker v2 registry, and then perform report generation queries and/or policy evaluation calls. This method is still fully supported, and in many cases is a good architecture for integrating anchore into your CI/CD platform. However, there are other use cases where the same result is desired (image scans, policy evaluations, content reports, etc), but for a variety of reasons, it is impractical for the user to operate a centralized, managed and stable anchore-engine deployment that is available to CI/CD build processes.

To accommodate these cases, we are introducing a new way to interact with anchore to get image scans, evaluations, and content reports without requiring a central anchore-engine deployment to be available. We call this new approach ‘inline scan’, to indicate that a single, one-time scan can be performed ‘inline’ against a local container image at any time, without the need for any persistent data or service state between scans. Using this approach (which ultimately uses exactly the same analysis/vulnerability/policy evaluation and reporting functions of anchore-engine), users can achieve an integration with anchore that moves the analysis/scanning work to a local container process that can be run during the container image build pipeline, after an image has been built but before it is pushed to any registry.

With this new functionality, we hope to provide another approach for users to get deep analysis, scanning and policy evaluation capabilities of anchore in situations where operating a central anchore-engine service is impractical.

Using the inline_scan Script

To make using our inline-scan container as easy as possible, we have provided a simple wrapper script called inline_scan. The only requirement to run the inline_scan script is the ability to execute Docker commands & bash. We host a versioned copy of this script that can be downloaded directly with curl and executed in a bash pipeline, providing you image inspection, reporting and policy enforcement with one command.

To run the script on your workstation, use the following command syntax.

curl -s https://ci-tools.anchore.io/inline_scan-v0.6.0 | bash -s -- [options] IMAGE_NAME(s)

Inline_scan Options

-b  [optional] Path to local Anchore policy bundle.
-d  [optional] Path to local Dockerfile.
-v  [optional] Path to directory to be mounted as docker volume. All image archives in directory will be scanned.
-f  [optional] Exit script upon failed Anchore policy evaluation.
-p  [optional] Pull remote docker images.
-r  [optional] Generate analysis reports in your current working directory.
-t  [optional] Specify timeout for image scanning in seconds (defaults to 300s).

Examples

Pull multiple images from DockerHub, scan them all and generate individual reports in ./anchore-reports.

curl -s https://ci-tools.anchore.io/inline_scan-v0.6.0 | bash -s -- -p -r alpine:latest ubuntu:latest centos:latest

Perform a local docker build, then pass the Dockerfile to anchore inline scan. Use a custom policy bundle to ensure Dockerfile compliance, failing the script if anchore policy evaluation does not pass.

docker build -t example-image:latest -f Dockerfile .
curl -s https://ci-tools.anchore.io/inline_scan-v0.6.0 | bash -s -- -f -d Dockerfile -b .anchore-policy.json example-image:latest

Save multiple docker image archives to a directory, then mount the entire directory for analysis using a timeout of 500s.

cd example1/
docker build -t example1:latest .
cd ../example2
docker build -t example2:latest .
cd ..
mkdir images/
docker save example1:latest -o images/example1+latest.tar
docker save example2:latest -o images/example2+latest.tar
curl -s https://ci-tools.anchore.io/inline_scan-v0.6.0 | bash -s -- -v ./images -t 500

Using Anchore Inline Scan in Your Build Pipeline

This same functionality can be utilized on any CI/CD platform that allows the execution of Docker commands. The remainder of this post will be going over implementations of the anchore inline scan on a variety of popular CI/CD platforms.

All of the following examples can be found in this repository.

CircleCI Implementation

CircleCI version 2.0+ allows native docker command execution with the setup_remote_docker job step. By using this functionality combined with an official docker:stable image, we can build, scan, and push our images within the same job. We will also create reports and save them as artifacts within CircleCI. These reports are all created in JSON format, allowing easy aggregation from CircleCI into your preferred reporting tool.

This workflow requires the DOCKER_USER & DOCKER_PASS environment variables to be set in a context called dockerhubin your CircleCI account settings at settings -> context -> create

Config.yml

version: 2.1
jobs:
  build_scan_image:
    docker:
    - image: docker:stable
    environment:
      IMAGE_NAME: btodhunter/anchore-ci-demo
      IMAGE_TAG: circleci
    steps:
    - checkout
    - setup_remote_docker
    - run:
        name: Build image
        command: docker build -t "${IMAGE_NAME}:ci" .
    - run:
        name: Scan image
        command: |
          apk add curl bash
          curl -s https://ci-tools.anchore.io/inline_scan-v0.6.0 | bash -s -- -r "${IMAGE_NAME}:ci"
    - run:
        name: Push to DockerHub
        command: |
          echo "$DOCKER_PASS" | docker login -u "$DOCKER_USER" --password-stdin
          docker tag "${IMAGE_NAME}:ci" "${IMAGE_NAME}:${IMAGE_TAG}"
          docker push "${IMAGE_NAME}:${IMAGE_TAG}"
    - store_artifacts:
        path: anchore-reports/
  
workflows:
  scan_image:
    jobs:
    - build_scan_image:
        context: dockerhub

GitLab Implementation

GitLab allows docker command execution through a docker:dind service container. This job pushes the image to the GitLab registry, using built-in environment variables for specifying the image name and registry login credentials. To prevent premature timeouts, the timeout has been increased to 500s with the -t option. Reports are generated using the -r option, which are then passed as artifacts to be stored in GitLab. Even if you’re not using an aggregation tool for artifacts, the json format allows reports to be parsed and displayed within GitLab pipeline using simple command line tools like jq.

.gitlab-ci.yml

variables:
  IMAGE_NAME: ${CI_REGISTRY_IMAGE}/build:${CI_COMMIT_REF_SLUG}-${CI_COMMIT_SHA}

stages:
- build

container_build:
  stage: build
  image: docker:stable
  services:
  - docker:stable-dind

  variables:
    DOCKER_DRIVER: overlay2

  script:
  - echo "$CI_JOB_TOKEN" | docker login -u gitlab-ci-token --password-stdin "${CI_REGISTRY}"
  - docker build -t "$IMAGE_NAME" .
  - apk add bash curl 
  - curl -s https://ci-tools.anchore.io/inline_scan-v0.6.0 | bash -s -- -r -t 500 "$IMAGE_NAME"
  - docker push "$IMAGE_NAME"
  - |
      echo "Parsing anchore reports."
      for f in anchore-reports/*; do
        if [[ "$f" =~ "content-os" ]]; then
          printf "n%sn" "The following OS packages are installed on ${IMAGE_NAME}:"
          jq '[.content | sort_by(.package) | .[] | {package: .package, version: .version}]' $f || true
        fi
        if [[ "$f" =~ "vuln" ]]; then
          printf "n%sn" "The following vulnerabilities were found on ${IMAGE_NAME}:"
          jq '[.vulnerabilities | group_by(.package) | .[] | {package: .[0].package, vuln: [.[].vuln]}]' $f || true
        fi
      done

  artifacts:
    name: ${CI_JOB_NAME}-${CI_COMMIT_REF_NAME}
    paths:
    - anchore-reports/*

CodeShip Implementation

Docker command execution is enabled by default in CodeShip, which allows the inline_scan script to run on the docker:stable image without any additional configuration. By specifying the -f option on the inline_scan script, this job ensures that an image that fails it’s anchore policy evaluation will not be pushed to the registry. To ensure adherence to the organization’s security compliance policy, a custom policy bundle can be utilized for this scan by passing the -b <POLICY_BUNDLE_FILE> option to the inline_scan script.

This job requires creating an encrypted environment variable file for loading the DOCKER_USER & DOCKER_PASS variables into your job. See – Encrypting CodeShip Environment Variables.

codeship-services.yml

anchore:
  add_docker: true
  image: docker:stable-git
  environment:
    IMAGE_NAME: btodhunter/anchore-ci-demo
    IMAGE_TAG: codeship
  encrypted_env_file: env.encrypted

codeship-steps.yml

- name: build-scan
  service: anchore
  command: sh -c 'apk add bash curl &&
    mkdir -p /build && 
    cd /build &&
    git clone https://github.com/Btodhunter/ci-demos.git . &&
    docker build -t "${IMAGE_NAME}:ci" . &&
    curl -s https://ci-tools.anchore.io/inline_scan-v0.6.0 | bash -s -- -f -b .anchore_policy.json "${IMAGE_NAME}:ci" &&
    echo "$DOCKER_PASS" | docker login -u "$DOCKER_USER" --password-stdin &&
    docker tag "${IMAGE_NAME}:ci" "${IMAGE_NAME}:${IMAGE_TAG}" &&
    docker push "${IMAGE_NAME}:${IMAGE_TAG}"'

Jenkins Pipeline Implementation

Jenkins configured with the Docker, BlueOcean, and Pipeline plugins support docker command execution using the shdirective. By using the -d <PATH_TO_DOCKERFILE> option with the inline_scan script, you can pass your Dockerfile to anchore-engine for policy evaluation. With the -b <PATH_TO_POLICY_BUNDLE> option, a custom policy bundle can be passed to the inline scan to ensure your Dockerfile conforms to best practices.

To allow pushing to a private registry, the dockerhub-creds credentials must be created in the Jenkins server settings at – Jenkins -> Credentials -> System -> Global credentials -> Add Credentials

This example was tested against the Jenkins installation detailed here, using the declarative pipeline syntax – Jenkins Pipeline Docs

Jenkinsfile

pipeline{
    agent {
        docker {
            image 'docker:stable'
        }
    }
    environment {
        IMAGE_NAME = 'btodhunter/anchore-ci-demo'
        IMAGE_TAG = 'jenkins'
    }
    stages {
        stage('Build Image') {
            steps {
                sh 'docker build -t ${IMAGE_NAME}:ci .'
            }
        }
        stage('Scan') {
            steps {        
                sh 'apk add bash curl'
                sh 'curl -s https://ci-tools.anchore.io/inline_scan-v0.6.0 | bash -s -- -d Dockerfile -b .anchore_policy.json ${IMAGE_NAME}:ci'
            }
        }
        stage('Push Image') {
            steps {
                withDockerRegistry([credentialsId: "dockerhub-creds", url: ""]){
                    sh 'docker tag ${IMAGE_NAME}:ci ${IMAGE_NAME}:${IMAGE_TAG}'
                    sh 'docker push ${IMAGE_NAME}:${IMAGE_TAG}'
                }
            }
        }
    }
}

TravisCI Implementation

TravisCI allows docker command execution by default, which makes integrating Anchore Engine as simple as adding the inline_scan script to your existing image build pipeline. This analysis should be performed before pushing the image to your registry of choice.

The DOCKER_USER & DOCKER_PASS environment variables must be setup in the TravisCI console at repository -> settings -> environment variables

.travis.yml

language: node_js

services:
  - docker

env:
  - IMAGE_NAME="btodhunter/anchore-ci-demo" IMAGE_TAG="travisci"

script:
  - docker build -t "${IMAGE_NAME}:ci" .
  - curl -s https://ci-tools.anchore.io/inline_scan-v0.6.0 | bash -s -- "${IMAGE_NAME}:ci"
  - echo "$DOCKER_PASS" | docker login -u "$DOCKER_USER" --password-stdin
  - docker tag "${IMAGE_NAME}:ci" "${IMAGE_NAME}:${IMAGE_TAG}"
  - docker push "${IMAGE_NAME}:${IMAGE_TAG}"

AWS CodeBuild Implementation

AWS CodeBuild supports docker command execution by default. The Anchore inline_scan script can be inserted right into your pipeline before the image is pushed to its registry.

The DOCKER_USERDOCKER_PASSIMAGE_NAME, & IMAGE_TAG environment variables must be set in the CodeBuild console at Build Projects -> <PROJECT_NAME> -> Edit Environment -> Additional Config -> Environment Variables

buildspec.yml

version: 0.2

phases:
  build:
    commands:
      - docker build -t ${IMAGE_NAME}:${IMAGE_TAG} .

  post_build:
    commands:
      - curl -s https://ci-tools.anchore.io/inline_scan-v0.6.0 | bash -s -- ${IMAGE_NAME}:${IMAGE_TAG}
      - echo $DOCKER_PASS | docker login -u $DOCKER_USER --password-stdin
      - docker push ${IMAGE_NAME}:${IMAGE_TAG}

Summary

As you can see from the above examples, the new inline scan makes it easier than ever to implement Anchore Engine image analysis in your Docker build pipeline! You can scan local images before pushing them into a registry, allowing you to inject scans directly into your current workflows. The inline_scan script makes it simple to ensure your Dockerfile meets best practices, perform fine-grained custom policy evaluations, and even pull an image directly from a remote registry for scanning. Anchore inline scan is a zero-friction solution for ensuring that only secure images make it through your build pipeline and get into production. Add it to your pipeline today!

Anchore Engine is an open source project, all issues and contribution details can be found on Github. We look forward to receiving feedback and contributions from our users!

Links

This post has been updated to reflect the newest version of the Anchore Inline Scanner.

Running Anchore Engine on Openshift

In this post, I will run through an installation of Anchore on OpenShift. I’ll also discuss in brief how to use Anchore to scan images.

Getting Started

My environment and tooling consist of the following:

  • CentOS 7 on AWS
  • RedHat OKD version 3.11 in a single node
  • Helm
  • PostgreSQL on RDS (For Anchore external DB)

For the purposes of this post, I will assume a successful installation of OKD and Helm. For more information on installing Helm on OpenShift see here.

Diagram of OKD and Helm installation.

To verify that Helm has been installed and configured successfully, running the command below should yield the following output:

[centos@ip-172-31-7-54 ~]$ helm version
Client: &version.Version{SemVer:"v2.9.1", GitCommit:"20adb27c7c5868466912eebdf6664e7390ebe710", GitTreeState:"clean"}
Server: &version.Version{SemVer:"v2.9.1", GitCommit:"20adb27c7c5868466912eebdf6664e7390ebe710", GitTreeState:"clean"}

Using the Anchore Helm Chart

I will be installing Anchore via Helm and the chart located here.

For my installation, I’ve set up a PostgreSQl database in Amazon RDS that I will configure Anchore to use. Although there is a managed PostgreSQL service that can be installed with the chart, it is recommended to use an external DB for production installations.

Configuring the External db

In order to configure the external db, create a new file named anchore-values.yaml and add the following:

## anchore-values.yaml

postgresql:
  # To use an external DB, uncomment & set 'enabled: false'
  # externalEndpoint, postgresUser, postgresPassword & postgresDatabase are required values for external postgres
  enabled: false
  postgresUser: db_username
  postgresPassword: db_password
  postgresDatabase: anchore_db

  # Specify an external (already existing) postgres deployment for use.
  # Set to the host and port. eg. mypostgres.myserver.io:5432
  externalEndpoint: anchore-db-instance.<123456>.us-east-2.rds.amazonaws.com:5432

For more details on using the Helm chart please consult the GitHub repo.

Installing Anchore

Create a new project via oc new-project anchore-engine.

Give Tiller access to the project you created.

oc policy add-role-to-user edit "system:serviceaccount:${TILLER_NAMESPACE}:tiller" role "edit" added: "system:serviceaccount:tiller:tiller"

Verify you are using the created project.

[centos@ip-172-31-7-54 ~]$  oc login -u test -p test https://console.52.14.129.143:8443
Login successful.

You have access to the following projects and can switch between them with 'oc project <projectname>':

  * anchore-engine
    default
    kube-public
    kube-service-catalog
    kube-system
    management-infra
    openshift
    openshift-console
    openshift-infra
    openshift-logging
    openshift-metrics-server
    openshift-monitoring
    openshift-node
    openshift-sdn
    openshift-template-service-broker
    openshift-web-console
    tiller

Using project "anchore-engine".

Run the following command to install Anchore:

helm install --name <release_name> -f anchore-values.yaml stable/anchore-engine

An initial install will take several minutes to complete. Additionally, it will also take some time to perform its initial data feed sync.

You can run oc get pods to see how things are doing.

[centos@ip-172-31-7-54 ~]$ oc get pods
NAME                                                         READY     STATUS    RESTARTS   AGE
anchore-engine-anchore-engine-analyzer-7d5fc7fb4c-phkt8      1/1       Running   0          1h
anchore-engine-anchore-engine-api-55b785794-tk6qt            1/1       Running   0          1h
anchore-engine-anchore-engine-catalog-65bbfdd7c7-7ldzj       1/1       Running   0          1h
anchore-engine-anchore-engine-policy-8cb4787ff-sdw7v         1/1       Running   0          1h
anchore-engine-anchore-engine-simplequeue-5f7b7f866b-2hn2n   1/1       Running   0          1h

In addition, you can check on the installation via the OpenShift UI.

Installation check via OpenShift user interface.

Exposing the Anchore Engine Service

Create a route in the OpenShift UI to expose the Anchore Engine service:

Anchore Engine exposed in OpenShift UI.

The hostname of this route is what I will set our Anchore CLI URL environment variable to in the step below.

Hostname of route set in Anchore CLI URL environment variable.

Installing the Anchore CLI

I can now install the Anchore CLI to interact with our running Anchore Engine service. There is also a CLI container.

Configure your Anchore CLI environment variables to communicate with the anchore engine API service. Now I can check on the status of the Anchore services by running anchore-cli system status.

[centos@ip-172-31-7-54 ~]$ anchore-cli system status
Service apiext (anchore-engine-anchore-engine-api-55b785794-5qn79, http://anchore-engine-anchore-engine-api:8228): up
Service simplequeue (anchore-engine-anchore-engine-simplequeue-5f7b7f866b-2hn2n, http://anchore-engine-anchore-engine-simplequeue:8083): up
Service policy_engine (anchore-engine-anchore-engine-policy-8cb4787ff-p8tpf, http://anchore-engine-anchore-engine-policy:8087): up
Service analyzer (anchore-engine-anchore-engine-analyzer-7d5fc7fb4c-2z85z, http://anchore-engine-anchore-engine-analyzer:8084): up
Service catalog (anchore-engine-anchore-engine-catalog-65bbfdd7c7-7ldzj, http://anchore-engine-anchore-engine-catalog:8082): up

You can also check on the stats of the vulnerability feeds sync by running the anchore-cli system feeds listcommand.

[centos@ip-172-31-7-54 ~]$ anchore-cli system feeds list
Feed                   Group                  LastSync                          RecordCount        
nvd                    nvddb:2002             2019-02-25T21:35:12.802608        6745               
nvd                    nvddb:2003             2019-02-25T21:35:13.188204        1547               
nvd                    nvddb:2004             2019-02-25T21:35:13.774093        2702               
nvd                    nvddb:2005             2019-02-25T21:35:14.281344        4749               
nvd                    nvddb:2006             2019-02-25T21:39:01.936476        7127               
nvd                    nvddb:2007             2019-02-25T21:39:02.432799        6556               
nvd                    nvddb:2008             2019-02-25T22:29:19.704624        7147               
nvd                    nvddb:2009             2019-02-25T22:29:20.292788        4964               
nvd                    nvddb:2010             2019-02-25T22:29:20.720235        5073               
nvd                    nvddb:2011             2019-02-25T21:30:43.003078        4621               
nvd                    nvddb:2012             2019-02-25T21:35:11.663650        5549               
nvd                    nvddb:2013             2019-02-25T21:39:01.289722        6160               
nvd                    nvddb:2014             2019-02-25T21:42:11.148478        8493               
nvd                    nvddb:2015             2019-02-25T21:44:55.773423        8023               
nvd                    nvddb:2016             2019-02-25T21:48:13.150698        9872               
nvd                    nvddb:2017             2019-02-25T22:03:35.550272        15162              
nvd                    nvddb:2018             2019-02-25T22:26:12.131914        13541              
nvd                    nvddb:2019             2019-02-25T22:29:19.116614        963                
vulnerabilities        alpine:3.3             2019-02-25T21:15:55.103331        457                
vulnerabilities        alpine:3.4             2019-02-25T21:15:55.428108        681                
vulnerabilities        alpine:3.5             2019-02-25T21:15:55.795007        875                
vulnerabilities        alpine:3.6             2019-02-25T21:15:56.135527        918                
vulnerabilities        alpine:3.7             2019-02-25T21:15:53.751574        919                
vulnerabilities        alpine:3.8             2019-02-25T21:15:54.071555        996                
vulnerabilities        amzn:2                 2019-02-25T21:15:54.417658        135                
vulnerabilities        centos:5               2019-02-25T21:15:50.007481        1323               
vulnerabilities        centos:6               2019-02-25T21:15:50.358919        1317               
vulnerabilities        centos:7               2019-02-25T21:15:58.630997        754                
vulnerabilities        debian:10              2019-02-25T21:15:50.692485        19674              
vulnerabilities        debian:7               2019-02-25T21:15:51.141333        20455              
vulnerabilities        debian:8               2019-02-25T21:15:51.509929        21179              
vulnerabilities        debian:9               2019-02-25T21:15:51.872651        19899              
vulnerabilities        debian:unstable        2019-02-25T21:15:56.488092        20427              
vulnerabilities        ol:5                   2019-02-25T21:15:56.879681        1228               
vulnerabilities        ol:6                   2019-02-25T21:15:57.226619        1382               
vulnerabilities        ol:7                   2019-02-25T21:15:57.570317        854                
vulnerabilities        ubuntu:12.04           2019-02-25T21:15:57.931096        14946              
vulnerabilities        ubuntu:12.10           2019-02-25T21:15:48.681891        5652               
vulnerabilities        ubuntu:13.04           2019-02-25T21:15:49.284442        4127               
vulnerabilities        ubuntu:14.04           2019-02-25T21:15:52.520471        17927              
vulnerabilities        ubuntu:14.10           2019-02-25T21:15:54.731972        4456               
vulnerabilities        ubuntu:15.04           2019-02-25T21:15:52.995122        5748               
vulnerabilities        ubuntu:15.10           2019-02-25T21:15:53.357807        6511               
vulnerabilities        ubuntu:16.04           2019-02-25T21:15:58.291030        14906              
vulnerabilities        ubuntu:16.10           2019-02-25T21:15:46.706940        8647               
vulnerabilities        ubuntu:17.04           2019-02-25T21:15:47.111422        9157               
vulnerabilities        ubuntu:17.10           2019-02-25T21:15:47.565082        7935               
vulnerabilities        ubuntu:18.04           2019-02-25T21:15:48.002361        9158               
vulnerabilities        ubuntu:18.10           2019-02-25T21:15:48.332466        7245     

Once the feeds and synced, you can now begin to can vulnerability matches back on any analyzed images that contain vulnerability packages (both os and non-os).

Analyzing an Image

The following commands are useful when analyzing images:

  • anchore-cli image add docker.io/library/nginx:stable (Adds an image for analysis)
  • anchore-cli image wait docker.io/library/nging:stable (Waits for an image to complete analysis)
  • anchore-cli image list (Lists all images)

While these commands are fetching from Docker Hub, you can configure Anchore to scan images in private registries as well. For example, during my installation of OKD, a Docker registry was deployed automatically, as shown below.

Docker registry shown as being deployed automatically.

I can use command Docker commands to push and pull images to and from this registry, and configure Anchore to watch images in this registry for updates.

Get a List of Vulnerabilities

The following commands are useful when looking to obtain a list of vulnerabilities within an analyzed image.

  • anchore-cli image vuln docker.io/library/nginx:stable os (Displays any os vulnerabilities)
  • anchore-cli image vuln docker.io/library/nginx:stable non-os (Displays any non-os vulnerabilities)
  • anchore-cli image vuln docker.io/library/nginx:stable all (Displays all vulnerabilities)

Note: If there are no vulnerabilities returned and you have a healthy Anchore Engine service, the image may not be triggering any vulnerability matches.

Conclusion

I have now successfully installed Anchore Engine on OpenShift with Helm and analyzed my first image. Using the Helm chart definitely made the installation very smooth and the OpenShift UI makes pods and services easy to troubleshoot. What I recommend as a next step is to take a deeper look into Anchore policies, and how you can use them to govern images running through a CI tool to potentially stop vulnerable images from making their way to production environments. You can find out more about policies by checking out our public-facing documentation located here.

Anchore Policies, Understanding the ‘Dockerfile’ Policy Gate

Understanding how to work with policies is a central component of using Anchore container image inspection and enforcement tools effectively. Anchore policies are how users represent which checks to execute on particular images, and how the results of the policy evaluation should be interpreted.

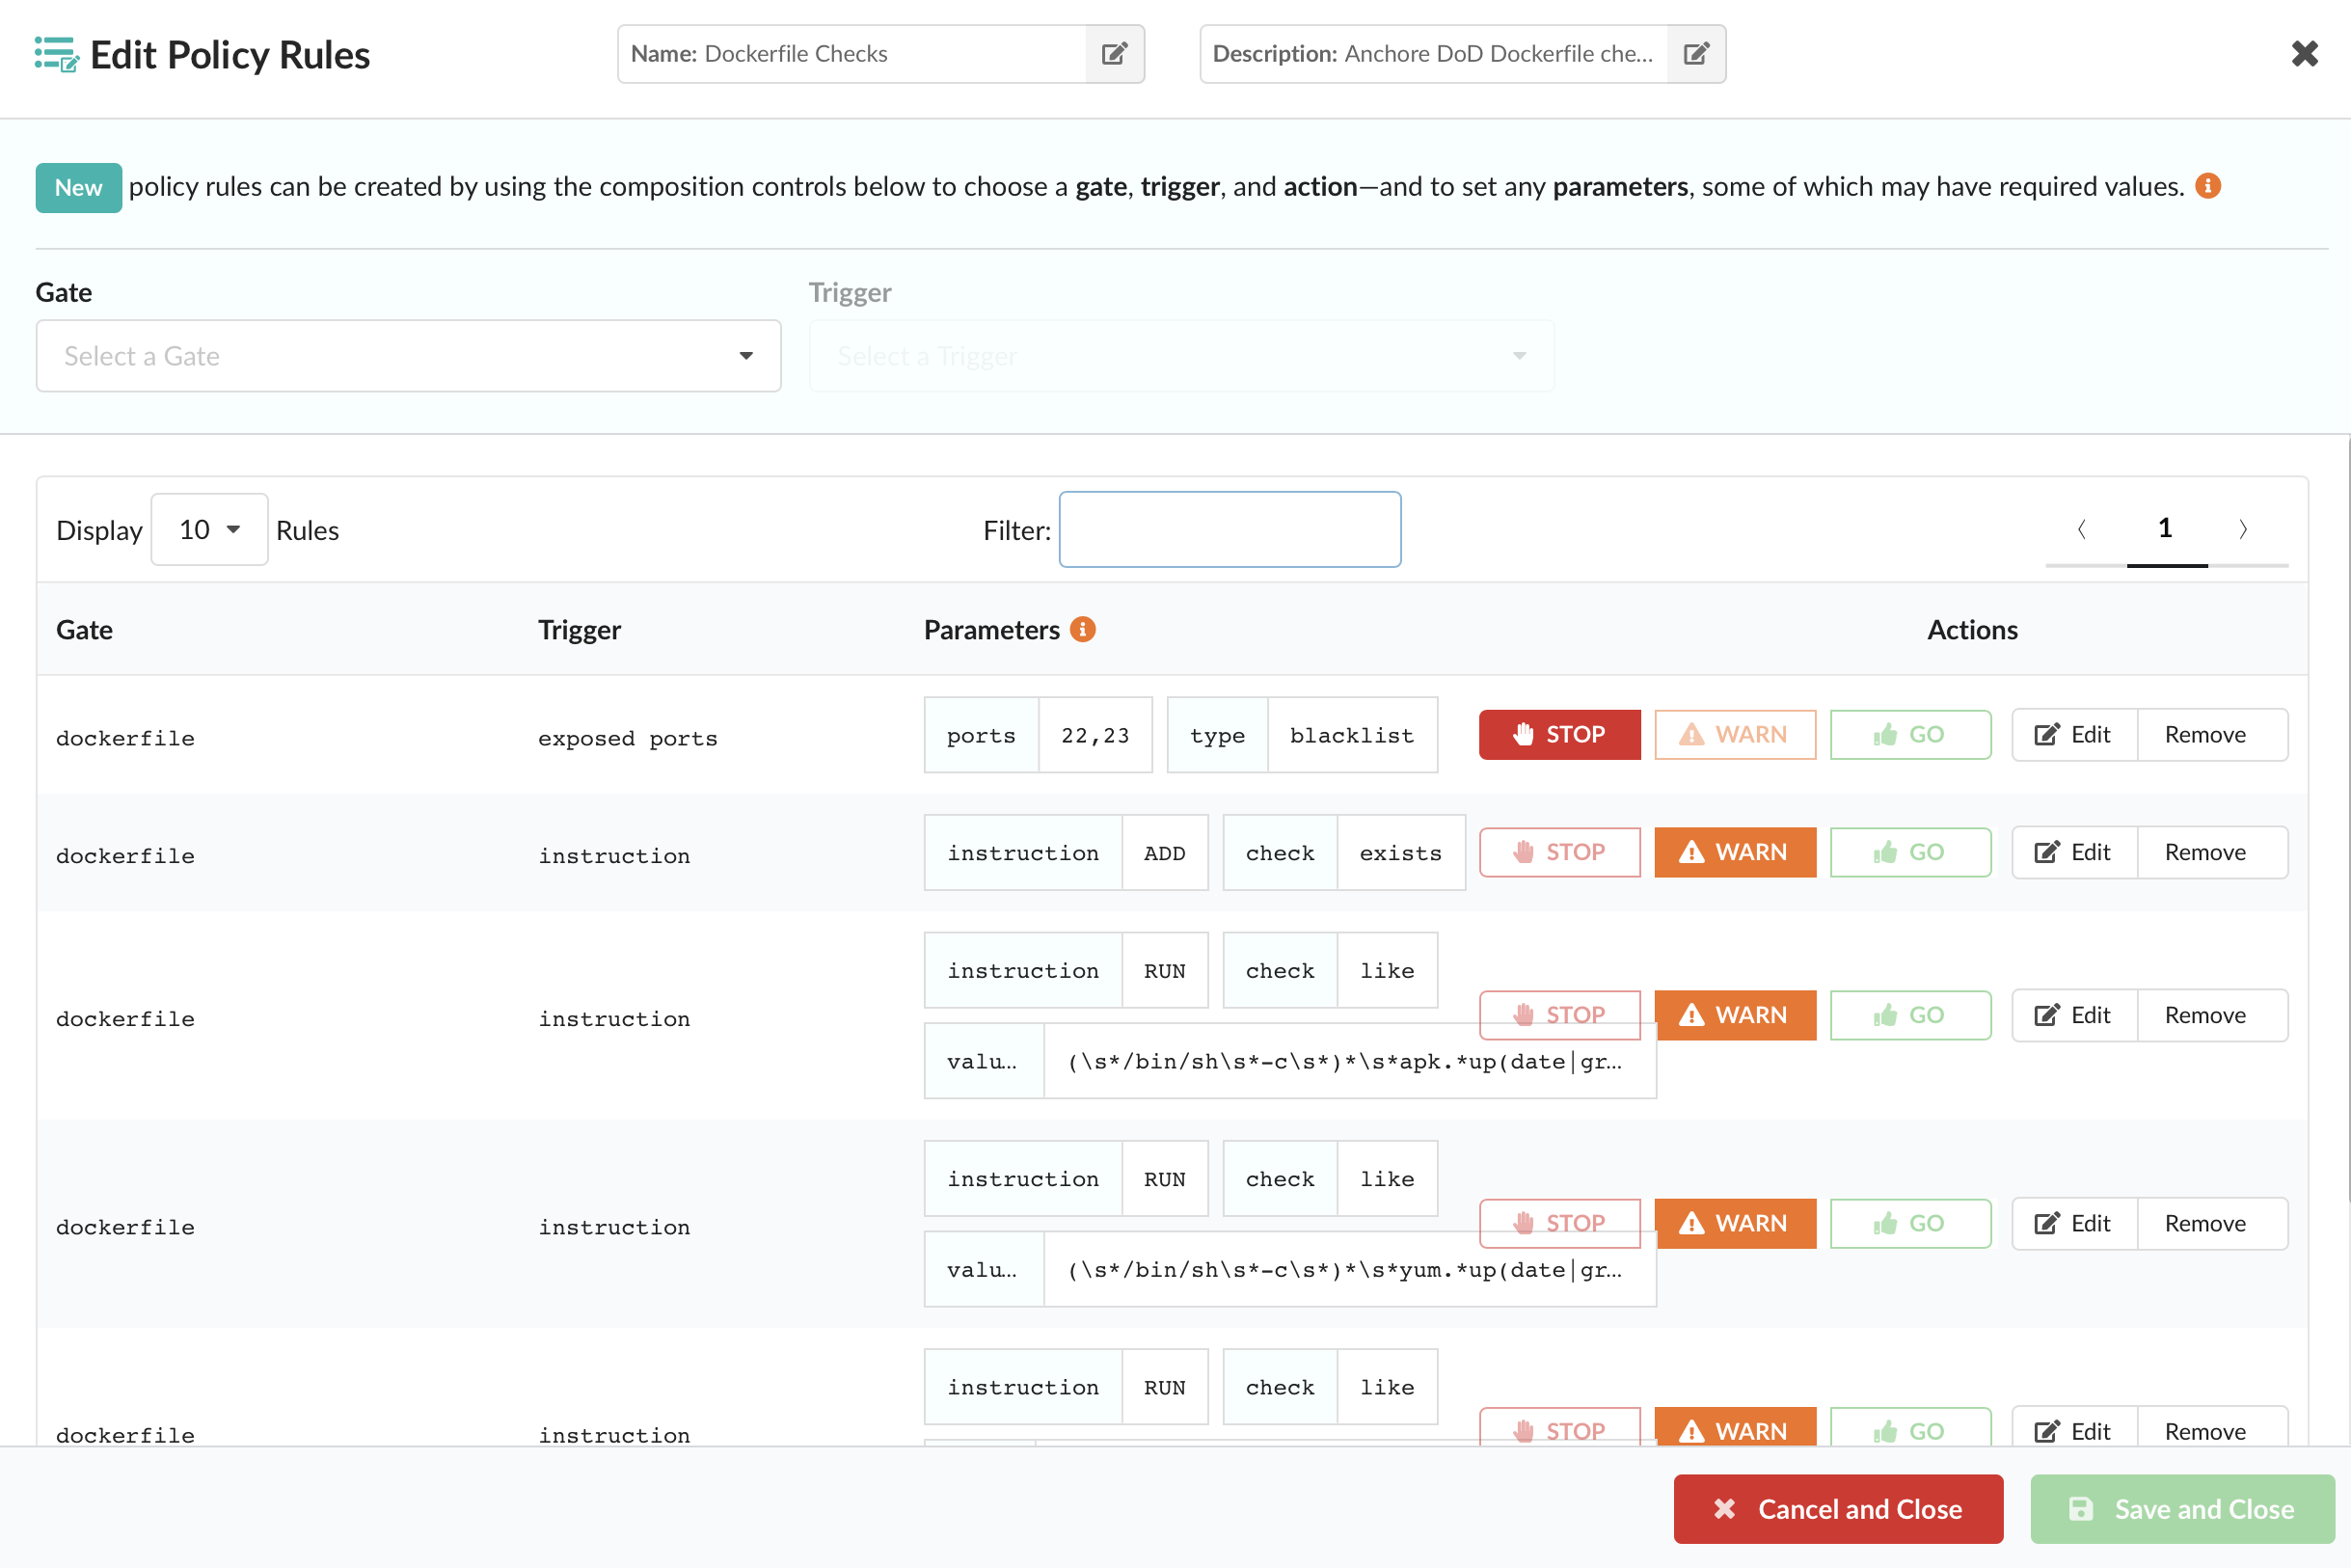
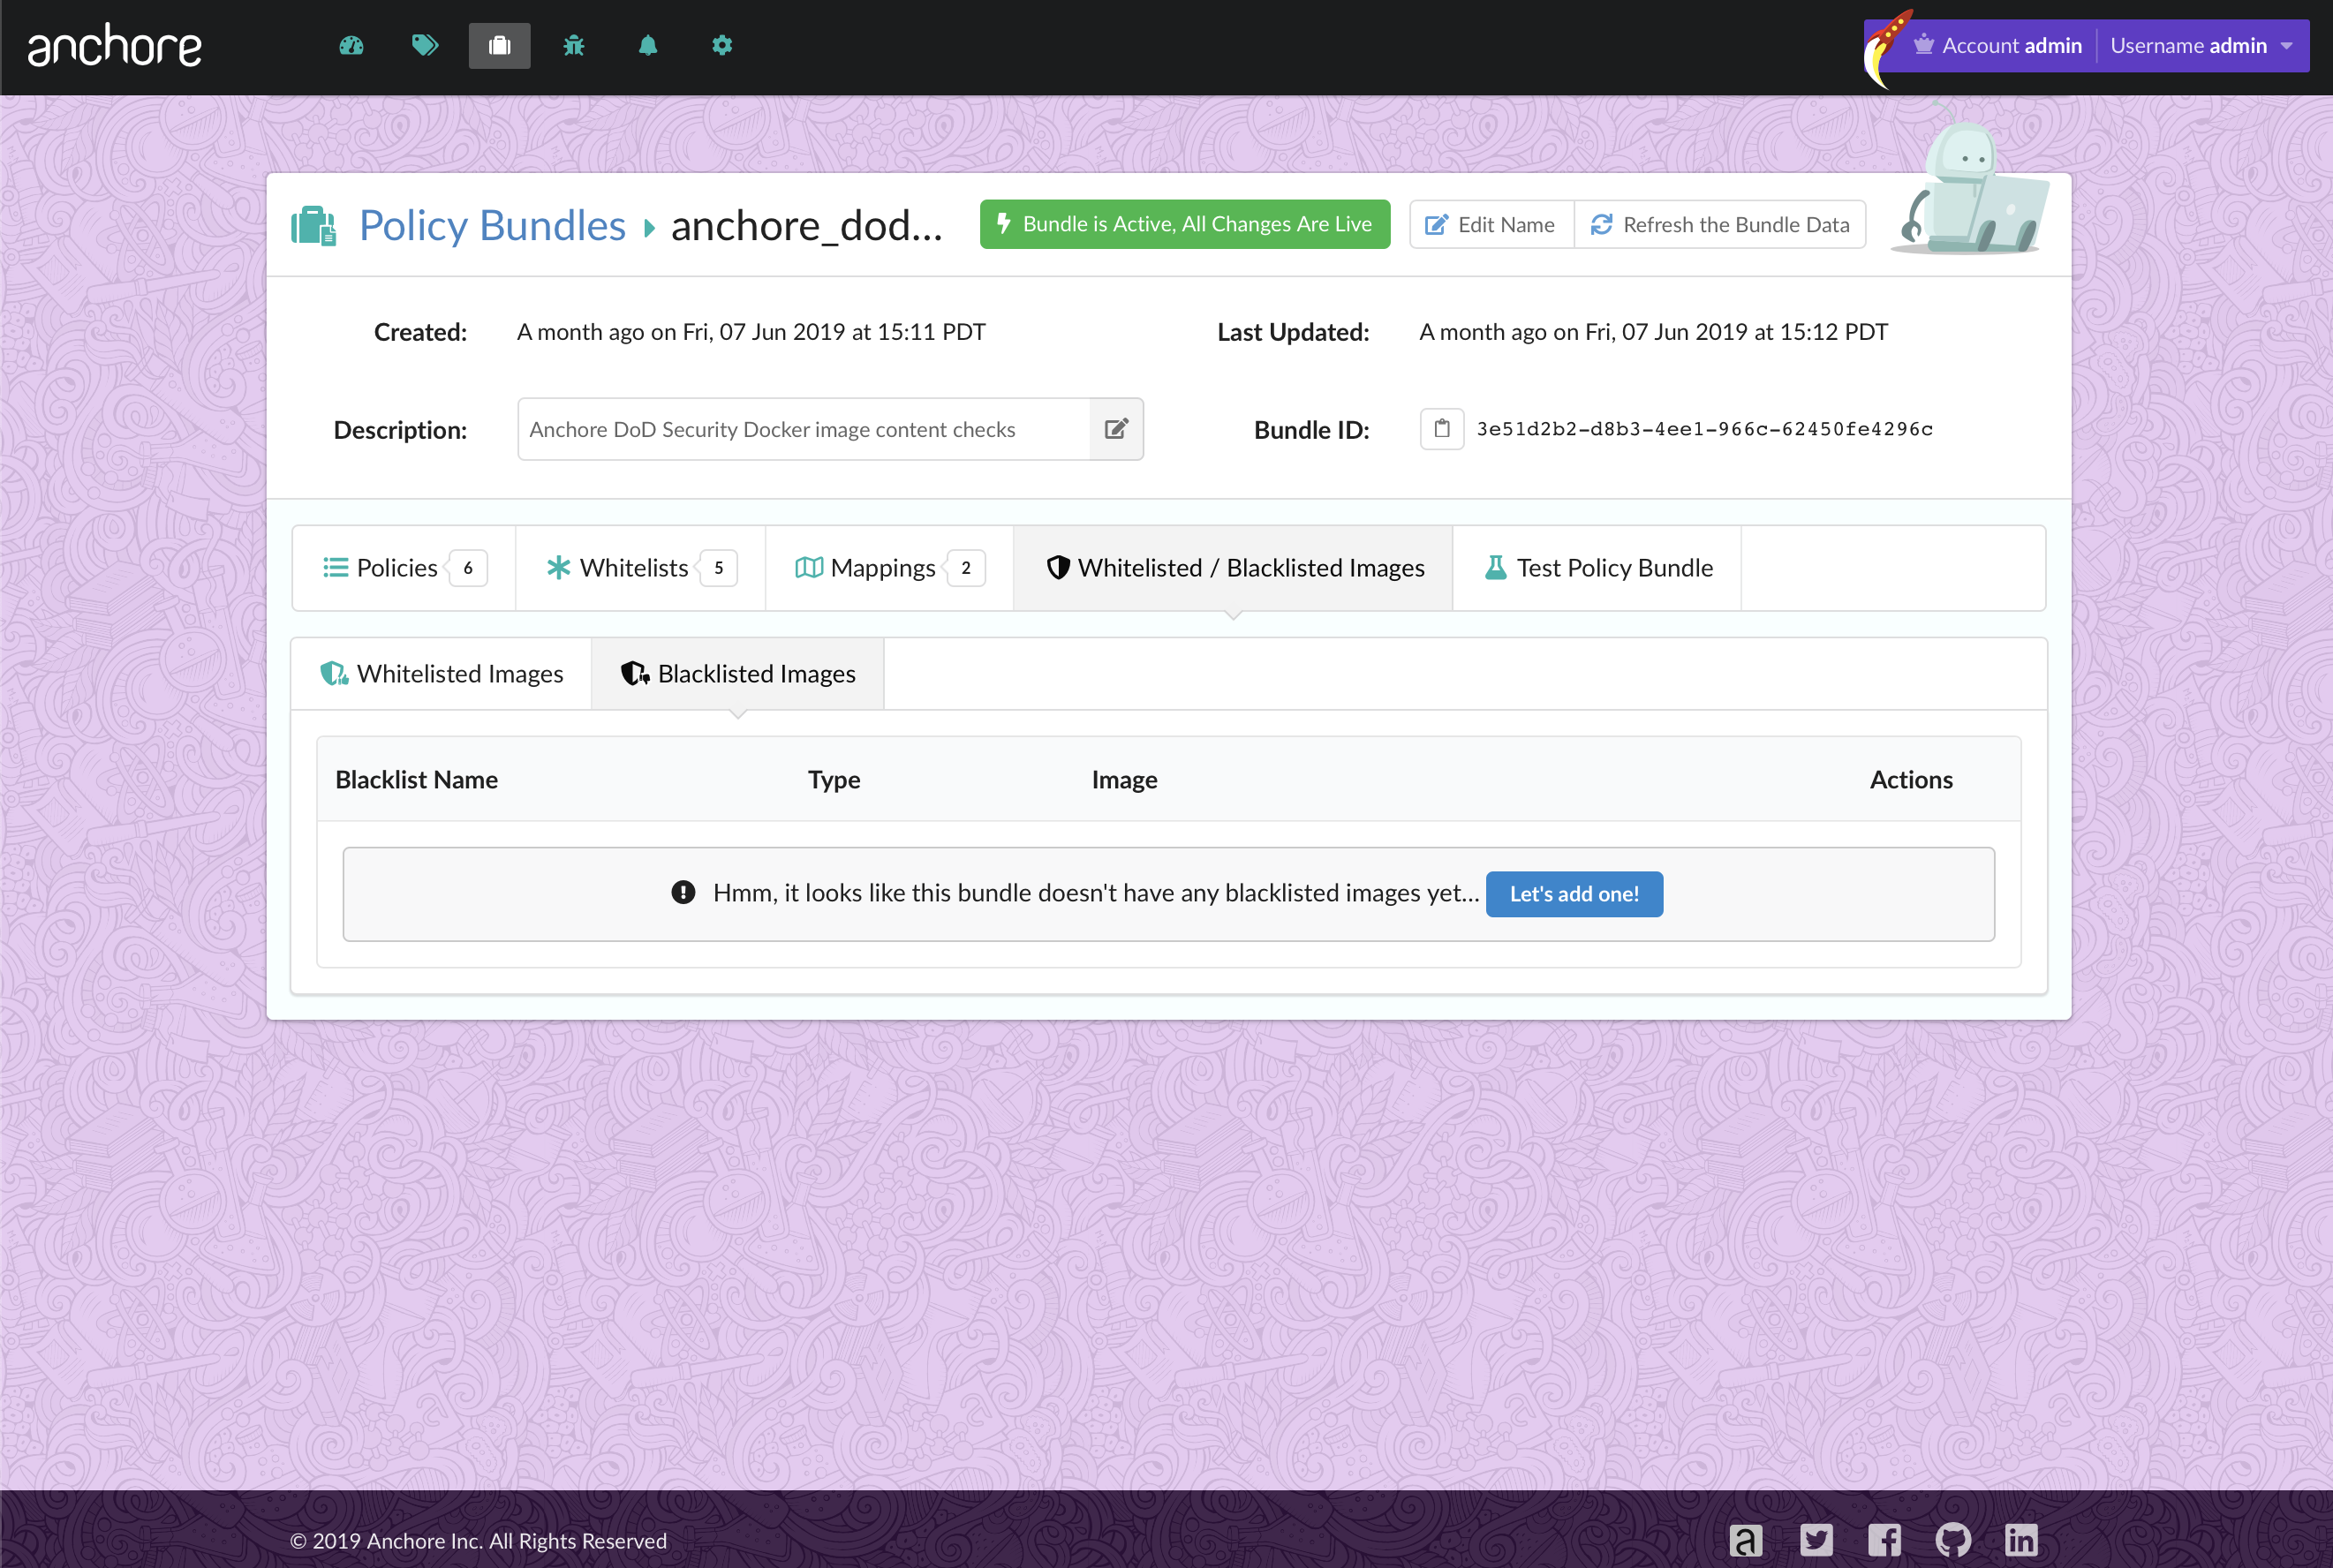
At Anchore, policy bundles are the unit of policy definition and evaluation. A user may have multiple bundles, but for policy evaluation, the user must specify a bundle to be evaluated, or default to the bundle currently marked as active. A policy bundle is a single JSON document, composed of policies, whitelists, mappings, whitelisted images, and blacklisted images.A policy is a named set of rules, represented as a JSON object within a policy bundle, each of which defines a specific check to perform and a resulting action to emit if the check returns a match. These checks are defined as Gates that contain Triggers. In this post, I will focus on the ‘dockerfile’ gate and its triggers.

Why Is A Dockerfile Check Needed

A Dockerfile is a text file that contains all commands, in order, to build a Docker image. In short, it is the blueprint for the container image environment. Since a container is a running instance of an image, it makes sense to incorporate effective mechanisms to check for best practices and potential misconfigurations with the blueprint as early as possible.

Dockerfile Gate

The Dockerfile gate allows uses to perform checks on the content of the Dockerfile or Docker history for an image and make policy actions based on the construction of the image, not just it’s content. Anchore is either given a Dockerfile or infers one from the Docker image layer history.

The actual_dockerfile_only Parameter

The actual versus history impacts the semantics of the Dockerfile gate’s triggers. To allow explicit control of the differences, most triggers in this gate include a parameter: actual_dockerfile_only that if set to true or false will ensure the trigger check is only done on the source of data specified. If actual_dockerfile_only = true, then the trigger will evaluate only if an actual Dockerfile is available for the image and will skip evaluation if not. If actual_dockerfile_only is false or omitted, then the trigger will run on the actual Dockerfile if available, or the history data if the Dockerfile was not provided.

Triggers

Instruction: This trigger evaluates instructions found in the Dockerfile.

Example of policy looking for the presence of the ADD instruction:

{
  "action": "WARN",
  "gate": "dockerfile",
  "id": "c35b7509-b0de-4b7a-9749-47380a2f98f2",
  "params": ,
  "trigger": "instruction"
}

In the above example, if the actual Dockerfile contains the instruction ADD a WARN action will result. Generally speaking, using the instruction COPY versus ADD is considered better practice. Read more about it here.

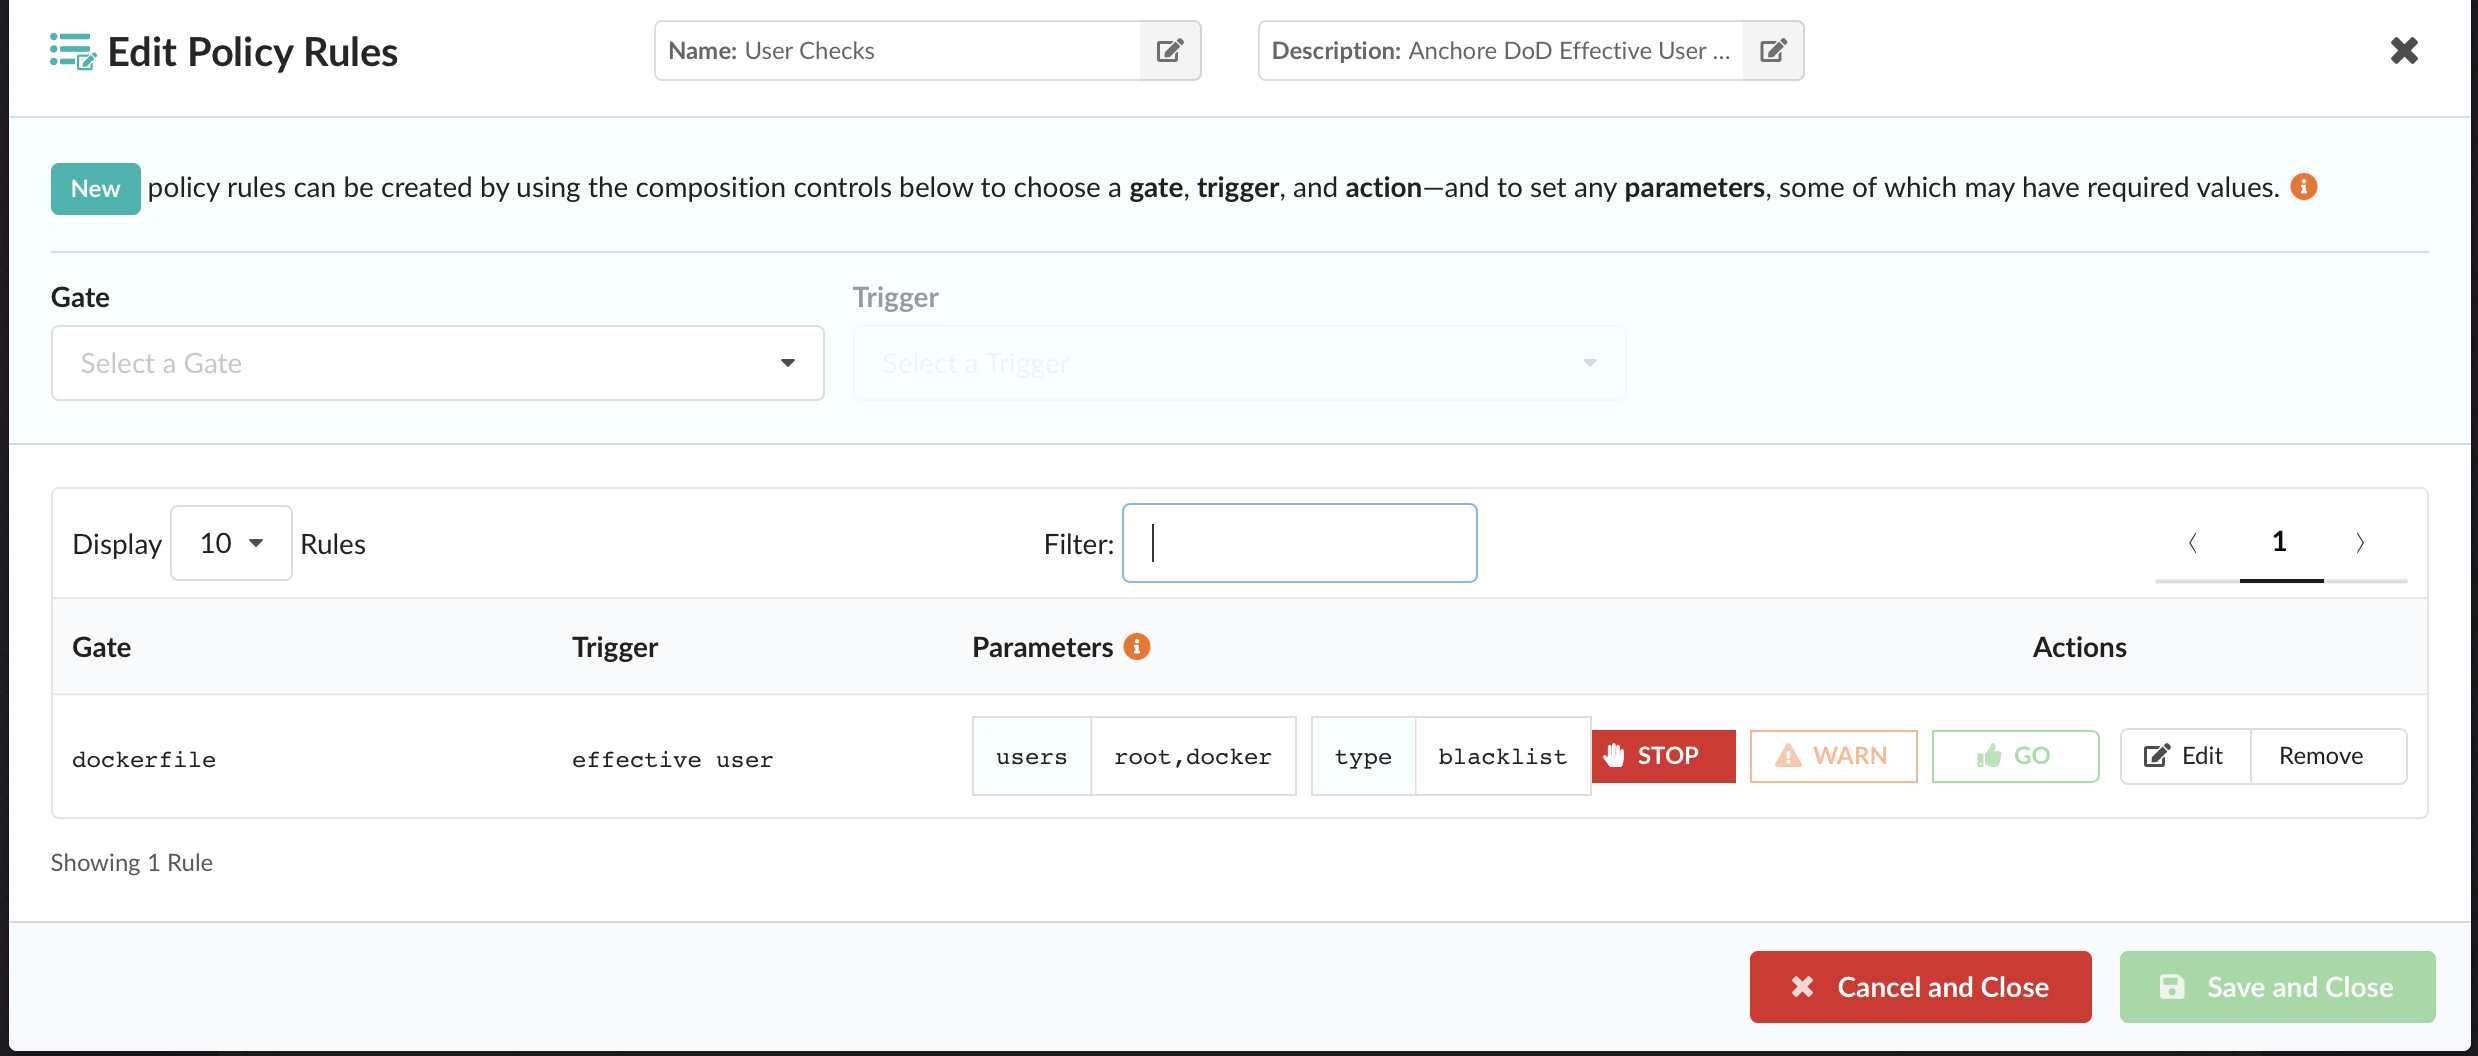
Effective User: This trigger processes all USER directives in the Dockerfile or history to determine which user will be user to run the container by default (assuming no user is set explicitly at runtime). The detected value is then subject to a whitelist or blacklist filter depending on the configured parameters.

Running containers as root is generally considered to be a bad practice, however, adding a USER instruction to the Dockerfile to specify a non-root user for the container to run as is a good place to start. If you do need to run as root, you can change the user to root at the beginning of the Dockerfile, then change back to the correct user with a second USER instruction.

Example policy to blacklist root user:

{
  "gate": "dockerfile",
  "trigger": "effective_user", 
  "action": "stop", 
  "parameters": 
}

Exposed ports: This trigger processes the set of EXPOSE directives in the Dockerfile or history to determine the set of ports that are defined to be exposed (since it can span multiple directives). The detected value is then subject to a whitelist or blacklist filter depending on the configured parameters.

Example of a policy blacklisting ports 21 and 22:

{
  "gate": "dockerfile",
  "trigger": "exposed_ports", 
  "action": "warn", 
  "parameters": 
}

no_dockerfile_provided: This trigger allows checks on the way the image was added, firing if the dockerfile was not explicitly provided at analysis time. This is useful in identifying and qualifying other trigger matches.

Conclusion and Example

Below is a short (and intentionally bad) example of why writing secure and efficient Dockerfiles is important. You can probably spot a good chunk of issues with the following Dockerfile:

FROM node:latest

## port 22 for testing only
EXPOSE 22 3000 

RUN apt-get update
RUN apt-get install -y curl nginx

# LABEL maintainer="[email protected]"

ADD example.tar.gz /example

# HEALTHCHECK --interval=30s CMD node healthcheck.js 
# USER node

Why is This Not so Great

  • FROM node:latest: This doesn’t always have to be bad, but it is something to make developers aware of. If we always use the latest tag, we run the risk of our build suddenly breaking if that image tag gets updated. To prevent this from occurring, using a specific tag will help to ensure immutability. Additionally, depending on use of your image, you may not need the full node:latest image and its dependencies. Many trusted images have alpine version which greatly reduce the total image size, thus reducing the possibility of vulnerabilities in packages, and increasing the time of build.
    • Example of differences is size (node:6 versus node:alpine)
# docker images

node                                                       6                   62905ac2c7de        12 days ago         882MB
node                                                       alpine              ebbf98230a82        2 weeks ago         73.7MB
  • EXPOSE 22 3000: We can see as stated in the comment above the EXPOSE instruction, port 22 is only used for testing, therefore we can remove it when building our production ready images. Note the placement of the EXPOSEinstruction (close to the top). EXPOSE is a cheap command to run, so it is typically best to declare it as late as possible.
  • # LABEL maintainer="[email protected]": We aren’t including a LABEL instruction. It is generally considered a good practice to add labels for organization, automation, licensing information, etc.
  • # HEALTHCHECK --interval=30s CMD node healthcheck.js: No HEALTHCHECK instruction. Typically, this is useful for telling Docker to periodically check our container health status. Great article on why located here.
  • # USER node: No user-defined. I’ve explained above why this is important to include. Read more about it here.
  • ADD example.tar.gz /example: I’ve mentioned above why using COPY instead of ADD is considered better practice.

Making the Dockerfile Better

FROM node:6.16.0-alpine

LABEL maintainer="[email protected]"

RUN apt-get update && apt-get install -y 
        curl 
        nginx

COPY example.tar.gz /example

HEALTHCHECK --interval=30s CMD node healthcheck.js 
USER node

EXPOSE 3000

Many of these mistakes can be checked and validated with Anchore policies and in particular the Dockerfile gate I’ve discussed in the previous sections. If you are already leveraging Anchore to inspect your container images, I strongly suggest diving into the Dockerfile gate and adjusting it to suit your needs. If not, feel free to take a look at Anchore and how conducting a deep image inspection coupled with flexible policies helps users gain insight into the contents of their Docker images and enforce security, compliance, and best-practice requirements.

Container Security & Compliance Scanning For AWS CodeBuild

This will walk through integrating Anchore scanning with AWS CodeBuild. During the first step, a Docker image will be built from a Dockerfile. Following this, during the second step, Anchore will scan the image, and depending on the result of the policy evaluation, proceed to the final step. During the final step, the built image will be pushed to a Docker registry.

Prerequisites

  • Running Anchore Engine service
  • AWS account
  • Repository that contains a Dockerfile

Setup

Prior to setting up your AWS CodeBuild pipeline, an Anchore Engine service needs to be accessible from the pipeline. Typically this is on port 8228. In this example, I have an Anchore Engine service on AWS EC2 with standard configuration. I also have a Dockerfile in a GitHub repository that I will build an image from during the first step of the pipeline. In the final step, I will be pushing the built image to an image repository in my personal Dockerhub.

The GitHub repository can be referenced here.

I’ve added the following environment variables in the build project setup:

  • ANCHORE_CLI_URL
  • ANCHORE_CLI_USER
  • ANCHORE_CLI_PASS
  • ANCHORE_CLI_FAIL_ON_POLICY
  • dockerhubUser
  • dockerhubPass

buildspec.yml file should exist in the root directory of the Github repository you will link to your CodeBuild setup.

Install

In the install phase of the buildspec.yml file we install the Anchore CLI. You can find more info by referencing the GitHub repo here.

Build Image

In the build phase of the buildspec.yml file we build and push a Docker image to Docker Hub.

build:
    commands:
      - docker build -t jvalance/node_critical_fail .
      - docker push jvalance/node_critical_fail

Conduct Image Scan

In the post_build phase of the buildspec.yml file we scan the built image with Anchore, and conduct a policy evaluation on it. Depending on the result of the policy evaluation the pipeline may or may not fail. In this example, the evaluation will not be successful, and the built image will not be pushed to a Docker registry.

post_build:
    commands:
      - anchore-cli image add jvalance/node_critical_fail:latest
      - echo "Waiting for image to finish analysis"
      - anchore-cli image wait jvalance/node_critical_fail:latest
      - echo "Analysis complete"
      - if  ; then anchore-cli evaluate check jvalance/node_critical_fail:latest  ; fi
      - echo "Pushing image to Docker Hub"
      - docker push jvalance/node_critical_fail

As a reminder, we advise having separate Docker registries for images that are being scanned with Anchore, and images that have passed an Anchore scan. For example, a registry for dev/test images, and a registry to certified, trusted, production-ready images. You may have noticed during this walkthrough I am using the same Docker Hub repository for all steps. This is not recommended for a production-grade deployment.

You can read more about Anchore Enterprise here or get started with the Anchore Engine here. Additionally, you can find out more information on AWS CodeBuild by referencing their documentation.

Introducing Anchore Policy Hub

An important, core principle around which the anchore container image inspection, analysis, scanning and enforcement technologies have been built stems from the reality that, when dealing with container deployments in production, there is a great deal of variance in the software, configuration, and other static artifacts that exist across an organization’s container image set. Even within a single application that is delivered in the form of container images evolving over a (often short) period of time, frequent updates and modifications happen, resulting in the catalog of image software/configuration being in a state of flux. Given this characteristic of typical container environments, anchore tools and services have been designed to help users gain insight into container image composition, and importantly be able to specify rules to enforce security, compliance and best-practice requirements, while allowing the workload to be highly dynamic. The core concept we use in anchore to achieve these goals is that of the anchore policy evaluation, which is fed a user-defined document or set of documents that we refer to as anchore policy bundles.

Using the policy mechanisms of anchore, users can define a collection of checks, whitelists, and mappings (encapsulated as a self-contained anchore policy bundle document). Anchore policy bundles can then be authored to encode a variety of rules, including checks within (but not limited to) the following categories:

  • Security vulnerabilities
  • Package whitelists and blacklists
  • Presence of credentials in an image
  • Dockerfile line checks
  • Exposed ports
  • Effective user
  • Software licenses
  • Image digest whitelist/blacklist

User-defined anchore policies are used to perform evaluations against container images as they move through their lifecycle from CI/CD to production. Using the policy evaluation framework, users / integrated systems can receive reports (evaluation results, security vulnerability scans, image content reports, and more) and control recommendations (policy evaluation pass/fail) at every step during a container image’s lifecycle.

Today, we’re pleased to announce the availability of a new service called the Anchore Policy Hub, which offers a store of pre-defined anchore policy bundles, and additionally (importantly!) is intended to serve as a mechanism for container DevOps and SecOps user communities to discuss container security, compliance and best-practices topics, while demonstrating functional working expressions of these topics in the form of fully usable anchore policy bundles, all in a public forum.

What is Being Released

Specifically, the Anchore Policy Hub is a centralized repository of resources that are publicly available and can be loaded into/consumed by any anchore engine installation, via anchore engine clients. This system serves as a canonical store of source documents (initially, anchore policy bundles), both serving as a location where pre-defined policy bundles can be easily fetched and loaded into anchore engine deployments, to serve as a starting point for creating your own policy bundles, as well as a providing a location where users of anchore can submit and share new policy bundles. Moving forward, our intention is to use this system as a mechanism for storing/sharing other anchore resources as well.

For this initial release, we have made available the following new resources:

  • The Anchore Policy Hub source document repository itself, hosted on github, which is initially populated with a set of policy bundles that can be used as a starting point for your own policy definitions.
  • Three pre-defined policy bundles that implement security and best practices checks from a few different perspectives, including a ‘security only’ bundle, a ‘Docker CIS 1.13.0’ bundle, and a ‘mixture of security and best practices’ bundle.
  • A simple, publicly accessible HTTP service, where clients can fetch and install policy bundles generated automatically from the source materials above.
  • New operations in the anchore CLI, version 0.3.2, for listing, inspecting and installing policy bundles served from the hub.

Start Using the Hub

For those existing anchore users who are anxious to get started right away, we have made available three policy bundles hosted in the hub that can be installed today. The requirements are:

The example below shows the process for listing, reviewing, installing and optionally modifying bundles from the anchore policy hub using the CLI:

# anchore-cli --version
anchore-cli, version 0.3.2
# anchore-cli policy hub list
Name                           Description                                                         
anchore_security_only          Single policy, single whitelist bundle for performing               
                               security checks, including example blacklist known malicious        
                               packages by name.                                                   
anchore_default_bundle         Default policy bundle that comes installed with vanilla             
                               anchore-engine deployments.  Mixture of light vulnerability         
                               checks, dockerfiles checks, and warning triggers for common         
                               best practices.                                                     
anchore_cis_1.13.0_base        Docker CIS 1.13.0 image content checks, from section 4 and          
                               5. NOTE: some parameters (generally are named 'example...')         
                               must be modified as they require site-specific settings             


# anchore-cli policy hub get anchore_cis_1.13.0_base
Policy Bundle ID: anchore_cis_1.13.0_base
Name: anchore_cis_1.13.0_base
Description: Docker CIS 1.13.0 image content checks, from section 4 and 5. NOTE: some parameters (generally are named 'example...') must be modified as they require site-specific settings

Policy Name: CIS File Checks
Policy Description: Docker CIS section 4.8 and 4.10 checks.

Policy Name: CIS Dockerfile Checks
Policy Description: Docker CIS section 4.1, 4.2, 4.6, 4.7, 4.9 and 5.8 checks.

Policy Name: CIS Software Checks
Policy Description: Docker CIS section 4.3 and 4.4 checks.

Whitelist Name: RHEL SUID Files
Whitelist Description: Example whitelist with triggerIds of files that are expected to have SUID/SGID, for rhel-based images

Whitelist Name: DEB SUID Files
Whitelist Description: Example whitelist with triggerIds of files that are expected to have SUID/SGID, for debian-based images

Mapping Name: default
Mapping Rule: */*:*
Mapping Policies: CIS Software Checks,CIS Dockerfile Checks,CIS File Checks
Mapping Whitelists: DEB SUID Files,RHEL SUID Files

# anchore-cli policy hub install anchore_cis_1.13.0_base
Policy ID: anchore_cis_1.13.0_base
Active: False
Source: local
Created: 2019-01-31T18:42:50Z
Updated: 2019-01-31T18:42:50Z


# anchore-cli policy list
Policy ID                                   Active        Created                     Updated                     
anchore_cis_1.13.0_base                     False         2019-01-31T18:42:50Z        2019-01-31T18:42:50Z        


Once the policy bundle has been installed from the hub, you can perform image add and evaluate actions using the usual mechanisms of anchore, as with any other pre-existing policy bundle and image set:

# anchore-cli image add docker.io/alpine:3.8
Image Digest: sha256:616d0d0ff1583933ed10a7b3b4492899942016c0577d43a1c506c0aad8ab4da8
Parent Digest: sha256:dad671370a148e9d9573e3e10a9f8cc26ce937bea78f3da80b570c2442364406
Analysis Status: not_analyzed
Image Type: docker
Image ID: 491e0ff7a8d51cd66a07e8b98976694174e82c0abbc77a96533c580a11378464
Dockerfile Mode: None
Distro: None
Distro Version: None
Size: None
Architecture: None
Layer Count: None

Full Tag: docker.io/alpine:3.8


# anchore-cli image wait docker.io/alpine:3.8
Status: analyzing
Waiting 5.0 seconds for next retry.
Image Digest: sha256:616d0d0ff1583933ed10a7b3b4492899942016c0577d43a1c506c0aad8ab4da8
Parent Digest: sha256:dad671370a148e9d9573e3e10a9f8cc26ce937bea78f3da80b570c2442364406
Analysis Status: analyzed
Image Type: docker
Image ID: 491e0ff7a8d51cd66a07e8b98976694174e82c0abbc77a96533c580a11378464
Dockerfile Mode: Guessed
Distro: alpine
Distro Version: 3.8.2
Size: 2207038
Architecture: amd64
Layer Count: 1

Full Tag: docker.io/alpine:3.8

# anchore-cli evaluate check docker.io/alpine:3.8 --policy anchore_cis_1.13.0_base --detail
Image Digest: sha256:616d0d0ff1583933ed10a7b3b4492899942016c0577d43a1c506c0aad8ab4da8
Full Tag: docker.io/alpine:3.8
Image ID: 491e0ff7a8d51cd66a07e8b98976694174e82c0abbc77a96533c580a11378464
Status: fail
Last Eval: 2019-01-31T18:44:30Z
Policy ID: anchore_cis_1.13.0_base
Final Action: stop
Final Action Reason: policy_evaluation

Gate              Trigger               Detail                                                                                                                                                    Status        
dockerfile        instruction           Dockerfile directive 'ADD' check 'exists' matched against '' for line 'file:91fb97ea3549e52e7b6e22b93a6736cf915c756f3d13348406d8ad5f1a872680 in /'        warn          
dockerfile        instruction           Dockerfile directive 'HEALTHCHECK' not found, matching condition 'not_exists' check                                                                       stop          
dockerfile        instruction           Dockerfile directive 'FROM' check 'not_in' matched against 'example_trusted_base1,example_trusted_base2' for line 'scratch'                               stop          
dockerfile        effective_user        User root found as effective user, which is explicity not allowed list                                                                                    stop          


Finally, since some standards require site-specific information be supplied, we have included example values in the policy hub bundles that should be modified for your specific environment/application being scanned. To modify a policy bundle, you can edit the JSON directly, make a copy of the installed bundle and add a new bundle with your included modifications, or Enterprise users can use the Anchore Enterprise UI policy editing feature to make the necessary modifications and manage the installed bundles in anchore-engine.

For more examples and information, please visit the Anchore Policy Hub repository on GitHub, which will have all of the latest information on usage, contributing, and deployment options.

Summary

We’re truly excited to be sharing this service with the anchore and container user communities today, and invite all to visit the Anchore Policy Hub repository on GitHub for more information on how to start using the policy bundles already available, how to contribute your own policy bundles, modify the ones that are there already, discuss the topic generally, and even how to host an on-premises instance of an anchore hub in your own environment using the provided tools. We look forward to working with you via the hub to help advance the cause of bringing high-quality container image inspection, security, compliance and best-practice enforcement tooling to any and all who are deploying containers today!

What is DevSecOps?

Here at Anchore, we consistently work with our users and customers to improve the security of their container images. During these conversations, there is typically an initiative to embed container image scanning into CI/CD pipelines to meet DevSecOps goals. But what do we mean when we say DevSecOps? We can think of DevSecOps as empowering engineering teams to take ownership of how their products will perform in production by integrating security practices into their existing automation and DevOps workflow.

A core principle of DevSecOps is creating a ‘Security as Code’ culture. Now that’s there is increased transparency and collaboration, security is now everyone’s responsibility. By building on the cultural changes of the DevOps framework, security teams are added to DevOps initiatives early to help plan for security automation. Additionally, security engineers should constantly be providing feedback and educating both Ops and development teams on best practices.

What are the Benefits of DevSecOps?

There are quite a few benefits to including security practices to the software development and delivery lifecycle. I’ve listed some of the core benefits below:

  • Costs are reduced by uncovering and fixing security issues further left in the development lifecycle versus in production environments.
  • Speed of product delivery is increased by incorporating automated security tests versus adding security testing at the end of lifecycle.
  • Increased transparency and team collaboration leads to faster detection and recovery of threats.
  • Implementing immutable infrastructure improves overall security by reducing vulnerabilities, increasing automation, and encourages organizations to move to the cloud.

When thinking about what tooling and tests to put in place, organizations should look at their entire development lifecycle and environment. This can often include source control, third-party libraries, container registries, CI/CD pipelines, and orchestration and release tools.

Anchore and DevSecOps

As a container security company, we strongly believe containers help with a successful journey to DevSecOps. Containers are lightweight, faster than VMs, and allow developers to create predictable, scalable environments isolated from other applications or services. This leads to increased productivity across all teams, faster development, and less time fixing bugs and other environment issues. Containers are also immutable, meaning unchanged once created. To fix a vulnerable container, it is simply replaced by a patched, newer version.

When planning security steps in a continuous integration pipeline, I often recommend adding a mandatory image analysis step to uncover vulnerable packages, secrets, credentials, or misconfigurations prior to the image being pushed to a production registry. As part of this image scanning step, I also recommend enforcing policies on the contents of the container images that have just been analyzed. Anchore policies are made up of a set of user-defined rules such as:

  • Security vulnerabilities
  • Image manifest changes
  • Configuration file contents
  • Presence of credentials in an image
  • Unused exposed ports
  • Package whitelists and blacklists

Based on the rules created and the final result of the policy evaluation, users can choose to fail the image scanning step of a CI build, and not promote the image to a production container registry. The integration of a flexible policy engine helps organizations stay on top of compliance requirements constantly and can react faster if audited. Security teams responsible for creating policy rules should be educating developers on why these rules are being created and what steps they can take to avoid breaking them.

Conclusion

DevSecOps means integrating security practices into application development from start to finish. Not only does this require new tooling, automation, and integration, but it also involves a significant culture change and investment from every developer, release engineer, and security engineer. Everyone is responsible for openness, feedback, and education. Once the culture is intact and in place, DevSecOps practices and processes can be implemented to achieve a more secure development process as a whole.

Kubernetes Admission Controller Dynamic Policy Mappings & Modes

In December, Anchore introduced an admission controller for Kubernetes solution & vulnerability scanner to gate pod execution based on Anchore analysis and policy evaluation of image content. It supports three different modes of operation allowing you to tune the tradeoff between control and intrusiveness for your environments.

To summarize, those modes are:

  1. Strict Policy-Based Admission Gating Mode – Images must pass policy evaluation by Anchore Engine for admission.
  2. Analysis-Based Admission Gating Mode – Images must have been analyzed by Anchore Engine for admission.
  3. Passive Analysis Trigger Mode – No admission, requirement, but images are submitted for analysis by Anchore Engine prior to admission. The analysis itself is asynchronous.

The multi-mode flexibility is great for customizing how strictly the controller enforces compliance with policy (if at all), but it does not allow you to use different bundles with different policies for the same image based on annotations or labels in Kubernetes, where there is typically more context about how strictly an image should be evaluated.

Consider the following scenario:

Your cluster has two namespaces: testing and production. You’ll be deploying many of the same images into those namespaces, and but you want testing to use much more permissive policies than production. Let’s consider the two policies:

  • testing policy – only block images with critical vulnerabilities
  • production policy – block images with high or critical vulnerabilities or that do not have a defined healthcheck

Now, let’s also allow pods to run in the production environment regardless of the image content if the pod has a special label: ‘breakglass=true’ These kinds of high-level policies are useful for operations work that requires temporary access using specific tools.

Such a scenario would not be achievable with the older controller. So, based on user feedback we’ve added the ability to select entirely different Anchore policy bundles based on metadata in Kubernetes as well as the image tag itself. This complements Anchore’s internal mapping structures within policy bundles that give fine-grained control over which rules to apply to an image based on the image’s tag or digest.

Broadly, the controller’s configuration now supports selector rules that encode a logical condition like this (in words instead of yaml):

If metadata property name matches SelectorKeyRegex and its value matches SelectorValueRegex, then use the specified Mode for checking with bundle PolicyBundleId from anchore user Username

In YAML, the configuration configmap has a new section, which looks like:

policySelectors:
  - Selector:
      ResourceType: pod
      SelectorKeyRegex: breakglass
      SelectorValueRegex: true
    PolicyReference:
      Username: testuser
      PolicyBundleId: testing_bundle
    Mode: policy
  - Selector:
      ResourceType: namespace
      SelectorKeyRegex: name
      SelectorValueRegex: testing
    PolicyReference:
      Username: testuser
      PolicyBundleId: testing_bundle
    Mode: policy
  - Selector:
      ResourceType: namespace
      SelectorKeyRegex: name
      SelectorValueRegex: production
    PolicyReference:
      Username: testuser
      PolicyBundleId: production_bundle
    Mode: policy 
  - Selector:
      ResourceType: image
      SelectorKeyRegex: .*
      SelectorValueRegex: .*
    PolicyReference:
      Username: demouser
      PolicyBundleId: default

Next, I’ll walk through configuring and deploying anchore and a controller to behave like the above example. I’ll set up two policies and two namespaces in Kubernetes to show how the selectors work. For a more detailed walk-thru of the configuration and operation of the controller, see the GitHub project.

Installation and Configuration of the Controller

If you already have anchore running in the cluster or in a location reachable by the cluster then that will work. You can skip to user and policy setup and continue there.

Anchore Engine install requirements:

  • Running Kubernetes cluster v1.9+
  • Configured kubectl tool with configured access (this may require some rbac config depending on your environment)
  • Enough resources to run anchore engine (a few cores and 4GB+ of RAM is recommended)

Install Anchore Engine

1. Install Anchore Engine in the cluster. There is no requirement that the installation is in the same k8s cluster or any k8s cluster, it is simply for convenience

helm install --name anchore stable/anchore-engine

2. Run a CLI container to easily query anchore directly to configure a user and policy

kubectl run -i -t anchorecli --image anchore/engine-cli --restart=Always --env ANCHORE_CLI_URL=http://anchore-anchore-engine-api.anchore.svc.local:8228 --env ANCHORE_CLI_USER=admin --env ANCHORE_CLI_PASS=foobar

3. From within the anchorecli container, create a new account in anchore

anchore-cli account create testing

4. Add a user to the account with a set of credentials (you’ll need these later)

anchore-cli account user add --account testing testuser testuserpassword

5. As the new user, analyze some images, nginx and alpine in this walk-thru. I’ll use those for testing the controller later.

anchore-cli --u testuser --p testuserpassword image add alpine
anchore-cli --u testuser --p testuserpassword image add nginx 
anchore-cli --u testuser --p testuserpassword image list

6. Create a file, testing_bundle.json:

{
    "blacklisted_images": [], 
    "comment": "testing bundle", 
    "id": "testing_bundle", 
    "mappings": [
        {
            "id": "c4f9bf74-dc38-4ddf-b5cf-00e9c0074611", 
            "image": {
                "type": "tag", 
                "value": "*"
            }, 
            "name": "default", 
            "policy_id": "48e6f7d6-1765-11e8-b5f9-8b6f228548b6", 
            "registry": "*", 
            "repository": "*", 
            "whitelist_ids": [
                "37fd763e-1765-11e8-add4-3b16c029ac5c"
            ]
        }
    ], 
    "name": "Testing bundle", 
    "policies": [
        {
            "comment": "System default policy", 
            "id": "48e6f7d6-1765-11e8-b5f9-8b6f228548b6", 
            "name": "DefaultPolicy", 
            "rules": [
                {
                    "action": "WARN", 
                    "gate": "dockerfile", 
                    "id": "312d9e41-1c05-4e2f-ad89-b7d34b0855bb", 
                    "params": [
                        {
                            "name": "instruction", 
                            "value": "HEALTHCHECK"
                        }, 
                        {
                            "name": "check", 
                            "value": "not_exists"
                        }
                    ], 
                    "trigger": "instruction"
                }, 
                {
                    "action": "STOP", 
                    "gate": "vulnerabilities", 
                    "id": "b30e8abc-444f-45b1-8a37-55be1b8c8bb5", 
                    "params": [
                        {
                            "name": "package_type", 
                            "value": "all"
                        }, 
                        {
                            "name": "severity_comparison", 
                            "value": ">"
                        }, 
                        {
                            "name": "severity", 
                            "value": "high"
                        }
                    ], 
                    "trigger": "package"
                }
            ], 
            "version": "1_0"
        }
    ], 
    "version": "1_0", 
    "whitelisted_images": [], 
    "whitelists": [
        {
            "comment": "Default global whitelist", 
            "id": "37fd763e-1765-11e8-add4-3b16c029ac5c", 
            "items": [], 
            "name": "Global Whitelist", 
            "version": "1_0"
        }
    ]
}

7. Create a file, production_bundle.json:

{
    "blacklisted_images": [], 
    "comment": "Production bundle", 
    "id": "production_bundle", 
    "mappings": [
        {
            "id": "c4f9bf74-dc38-4ddf-b5cf-00e9c0074611", 
            "image": {
                "type": "tag", 
                "value": "*"
            }, 
            "name": "default", 
            "policy_id": "48e6f7d6-1765-11e8-b5f9-8b6f228548b6", 
            "registry": "*", 
            "repository": "*", 
            "whitelist_ids": [
                "37fd763e-1765-11e8-add4-3b16c029ac5c"
            ]
        }
    ], 
    "name": "production bundle", 
    "policies": [
        {
            "comment": "System default policy", 
            "id": "48e6f7d6-1765-11e8-b5f9-8b6f228548b6", 
            "name": "DefaultPolicy", 
            "rules": [
                {
                    "action": "STOP", 
                    "gate": "dockerfile", 
                    "id": "312d9e41-1c05-4e2f-ad89-b7d34b0855bb", 
                    "params": [
                        {
                            "name": "instruction", 
                            "value": "HEALTHCHECK"
                        }, 
                        {
                            "name": "check", 
                            "value": "not_exists"
                        }
                    ], 
                    "trigger": "instruction"
                }, 
                {
                    "action": "STOP", 
                    "gate": "vulnerabilities", 
                    "id": "b30e8abc-444f-45b1-8a37-55be1b8c8bb5", 
                    "params": [
                        {
                            "name": "package_type", 
                            "value": "all"
                        }, 
                        {
                            "name": "severity_comparison", 
                            "value": ">="
                        }, 
                        {
                            "name": "severity", 
                            "value": "high"
                        }
                    ], 
                    "trigger": "package"
                }
            ], 
            "version": "1_0"
        }
    ], 
    "version": "1_0", 
    "whitelisted_images": [], 
    "whitelists": [
        {
            "comment": "Default global whitelist", 
            "id": "37fd763e-1765-11e8-add4-3b16c029ac5c", 
            "items": [], 
            "name": "Global Whitelist", 
            "version": "1_0"
        }
    ]
}    

8. Add those policies for the new testuser:

anchore-cli --u testuser --p testuserpassword policy add testing_bundle.json
anchore-cli --u testuser --p testuserpassword policy add production_bundle.json

9. Verify that the alpine image will pass the staging bundle evaluation but not the production bundle:

/ # anchore-cli --u testuser --p testuserpassword evaluate check alpine --policy testing_bundle
Image Digest: sha256:25b4d910f4b76a63a3b45d0f69a57c34157500faf6087236581eca221c62d214
Full Tag: docker.io/alpine:latest
Status: pass
Last Eval: 2019-01-30T18:51:08Z
Policy ID: testing_bundle

/ # anchore-cli --u testuser --p testuserpassword evaluate check alpine --policy production_bundle
Image Digest: sha256:25b4d910f4b76a63a3b45d0f69a57c34157500faf6087236581eca221c62d214
Full Tag: docker.io/alpine:latest
Status: fail
Last Eval: 2019-01-30T18:51:14Z
Policy ID: production_bundle

Now its time to get the admission controller in place to use those policies

Install and Configure the Admission Controller

1. Configure Credentials for the Admission controller to use

I’ll configure a pair of credentials, the new format supports multiple credentials in the secret so that the controller configuration can map policy bundles in multiple accounts. It is important that all usernames specified in the configuration of the controller have a corresponding entry in this secret to provide the password for API auth.

Create a file, testcreds.json:

{
  "users": [
    { "username": "admin", "password": "foobar"},
    { "username": "testuser", "password": "testuserpassword"}
  ]
}

kubectl create secret generic anchore-credentials --from-file=credentials.json=testcreds.json

2. Add the stable anchore charts repository

helm repo add anchore-stable http://charts.anchore.io/stable
helm repo update

3. Create a custom test_values.yaml In your editor, create a file values.yaml in the current directory

credentialsSecret: anchore-credentials
anchoreEndpoint: "http://anchore-anchore-engine-api.default.svc.cluster.local:8228"
requestAnalysis: true
policySelectors:
  - Selector:
      ResourceType: pod
      SelectorKeyRegex: ^breakglass$
      SelectorValueRegex: "^true$"
    PolicyReference:
      Username: testuser
      PolicyBundleId: testing_bundle
    Mode: breakglass
  - Selector:
      ResourceType: namespace
      SelectorKeyRegex: name
      SelectorValueRegex: ^testing$
    PolicyReference:
      Username: testuser
      PolicyBundleId: testing_bundle
    Mode: policy
  - Selector:
      ResourceType: namespace
      SelectorKeyRegex: name
      SelectorValueRegex: ^production$
    PolicyReference:
      Username: testuser
      PolicyBundleId: production_bundle
    Mode: policy
  - Selector:
      ResourceType: image
      SelectorKeyRegex: .*
      SelectorValueRegex: .*
    PolicyReference:
      Username: testuser
      PolicyBundleId: 2c53a13c-1765-11e8-82ef-23527761d060
    Mode: analysis
 

The ‘name’ values are used instead of full regexes in those instances because if the KeyRegex is exactly the string “name” then the controller will look at the resource name instead of a label or annotation and do the value regex match against that name.

4. Install the controller via the chart

helm install --name controller anchore-stable/anchore-admission-controller -f test_values.yaml

5. Create the validating webhook configuration as indicated by the chart install output:

KUBE_CA=$(kubectl config view --minify=true --flatten -o json | jq '.clusters[0].cluster."certificate-authority-data"' -r)
cat > validating-webhook.yaml <<EOF
apiVersion: admissionregistration.k8s.io/v1beta1
kind: ValidatingWebhookConfiguration
metadata:
  name: controller-anchore-admission-controller.admission.anchore.io
webhooks:
- name: controller-anchore-admission-controller.admission.anchore.io
  clientConfig:
    service:
      namespace: default
      name: kubernetes
      path: /apis/admission.anchore.io/v1beta1/imagechecks
    caBundle: $KUBE_CA
  rules:
  - operations:
    - CREATE
    apiGroups:
    - ""
    apiVersions:
    - "*"
    resources:
    - pods
  failurePolicy: Fail
# Uncomment this and customize to exclude specific namespaces from the validation requirement
#  namespaceSelector:
#    matchExpressions:
#      - key: exclude.admission.anchore.io
#        operator: NotIn
#        values: ["true"]
EOF

The apply the generated validating-webhook.yaml:

kubectl apply -f validating-webhook.yaml

Try It

To see it in action, run the alpine container in the testing namespace:

```
[zhill]$ kubectl -n testing run -it alpine --restart=Never --image alpine /bin/sh
If you don't see a command prompt, try pressing enter.
/ # exit
```

It works, as expected since that image passes policy evaluation for that bundle. Now try production, where it should fail to pass policy checks and be blocked:

```
[zhill]$ kubectl -n production run -it alpine --restart=Never --image alpine /bin/sh
Error from server: admission webhook "controller-anchore-admission-controller.admission.anchore.io" denied the request: Image alpine with digest sha256:25b4d910f4b76a63a3b45d0f69a57c34157500faf6087236581eca221c62d214 failed policy checks for policy bundle production_bundle
```

And to get around that, as was defined in the configuration (test_values.yaml), if you add the “breakglass=true” label, it will be allowed:

```
[zhill]$ kubectl -n production run -it alpine --restart=Never --labels="breakglass=true" --image alpine /bin/sh
If you don't see a command prompt, try pressing enter.
/ # exit 
```

Authoring Selector Rules

Selector rules are evaluated in the order they appear in the configmap value, so structure the rules to match from most to least specific filters. Note how in this example the breakglass rule is first.

These selectors are filters on:

  • namespace names, labels and annotations
  • pod names, labels, and annotations
  • image references (pull string)

Each selector provides regex support for both the key to providing the data as well as the data value itself. For image references the key regex is ignored and can be an empty string, only the SelectorValueRegex is used for the match against the pull string.

Important: The match values are regex patterns, so for a full string match you must bracket the string with ^ and $ (e.g. ^exactname$). If you do not include the begin/end matches the regex may match substrings rather than exact strings.

Summary

The new features of the controller are shown here to specify flexible rules for determining controller behavior based on namespace and pod metadata as well as the image pull string in order to support more sophisticated deployment strategies in Kubernetes.

As always, we love feedback, so drop us a line on Slack or file issues on GitHub

The controller code is on Github and so is the chart.
Identifying Vulnerabilities with Anchore

By far one the most common challenge Anchore helps its users solve is the identification of vulnerabilities within their Docker container images. Anchore analysis tools will inspect container images and generate a detailed manifest of the image, a virtual ‘bill of materials’ that includes official operating system packages, unofficial packages, configuration files, and language modules and artifacts. Following this, Anchore will evaluate policies against the analysis result, which includes vulnerability matches on the artifacts discovered in the image.

Quite often, Docker images contain both application and operating system packages. However, in this particular post, I will focus on the identification of a specific vulnerable application package inside an image, walkthrough how it can be visualized within the Anchore Enterprise UI, and what might an approach be to remediate.

As part of Anchore Enterprise, the vulnerability data source you will be seeing comes from Snyk. I recently wrote a post discussing the choice at Anchore to add this high-quality vulnerability data source to our enterprise platform which you can read about here.

Sample Project Repo

I will be referencing this example GitHub repository located here. The idea is simple, create a war file with Maven containing a vulnerable dependency, create a Docker image containing the war file, scan it with Anchore, and see what vulnerabilities are present. It is not the intent to run this Java project or anything outside of the scope discussed above.

Viewing the Dependencies

When viewing the pom.xml file for this project I can clearly see which dependencies I will be including.

Dependencies section of pom.xml:

  <dependencies>
    <dependency>
      <groupId>junit</groupId>
      <artifactId>junit</artifactId>
      <version>4.11</version>
    </dependency>
    <dependency>
      <groupId>com.fasterxml.jackson.core</groupId>
      <artifactId>jackson-databind</artifactId>
      <version>${jackson.version}</version>
    </dependency>
  </dependencies>

The vulnerable artifact I’ve added to this particular project can be found on Maven Central here and GitHub here. I will be expecting jackson-databind 2.9.7 to contain vulnerabilities.

Building Project

Viewing the dependency tree

Since we are leveraging Maven to build this project, I can also use a Maven command to view the dependencies. The command mvn dependency:tree will display the dependency tree for this project as seen below.


mvn dependency:tree
[INFO] Scanning for projects...
[INFO] 
[INFO] ------------------------< Anchore:anchore-demo >------------------------
[INFO] Building Anchore Demo 1.0
[INFO] -----------------------------------------------------------------
[INFO] 
[INFO] --- maven-dependency-plugin:2.8:tree (default-cli) @ anchore-demo ---
[INFO] Anchore:anchore-demo:war:1.0
[INFO] +- junit:junit:jar:4.11:compile
[INFO] |  - org.hamcrest:hamcrest-core:jar:1.3:compile
[INFO] - com.fasterxml.jackson.core:jackson-databind:jar:2.9.7:compile
[INFO]    +- com.fasterxml.jackson.core:jackson-annotations:jar:2.9.0:compile
[INFO]    - com.fasterxml.jackson.core:jackson-core:jar:2.9.7:compile
[INFO] ------------------------------------------------------------------------
[INFO] BUILD SUCCESS
[INFO] ------------------------------------------------------------------------
[INFO] Total time:  1.117 s
[INFO] Finished at: 2019-01-22T19:39:56-05:00
[INFO] ------------------------------------------------------------------------

Building a war file

To create the war file as defined in the pom.xml I will run the command mvn clean package. The important piece here is that package will generate the war file and place it in the target directory as seen below.

target jvalance$ ls -la | grep anchore-demo-1.0.war
-rw-r--r--   1 jvalance  staff  1862404 Jan 22 19:50 anchore-demo-1.0.war

Building and Scanning Docker Images

For the purposes of this post, I just need to include the war file created in the previous step in our Docker image. A simple way to do this can be defined below in a Dockerfile.

FROM openjdk:8-jre-alpine

# Copy target directory
COPY target/ app/

Once I’ve built the image and pushed it to a container registry, I can now scan it with Anchore via the CLI command below.

anchore-cli image add docker.io/jvalance/maven-demo:latest

Viewing Vulnerabilities

Once Anchore has completed an analysis of the image successfully, I can check for non-os vulnerabilities via the following CLI command:

anchore-cli image vuln docker.io/jvalance/maven-demo:latest non-os

## The above produces the following output:

Vulnerability ID                               Package                       Severity        Fix                     Vulnerability URL                                                   
SNYK-JAVA-COMFASTERXMLJACKSONCORE-72448        jackson-databind-2.9.7        High            ! <2.6.7.2              https://snyk.io/vuln/SNYK-JAVA-COMFASTERXMLJACKSONCORE-72448        
SNYK-JAVA-COMFASTERXMLJACKSONCORE-72449        jackson-databind-2.9.7        High            ! <2.6.7.2              https://snyk.io/vuln/SNYK-JAVA-COMFASTERXMLJACKSONCORE-72449        
SNYK-JAVA-COMFASTERXMLJACKSONCORE-72451        jackson-databind-2.9.7        High            ! <2.6.7.2              https://snyk.io/vuln/SNYK-JAVA-COMFASTERXMLJACKSONCORE-72451        
SNYK-JAVA-COMFASTERXMLJACKSONCORE-72882        jackson-databind-2.9.7        High            ! >=2.0.0 <2.9.8        https://snyk.io/vuln/SNYK-JAVA-COMFASTERXMLJACKSONCORE-72882        
SNYK-JAVA-COMFASTERXMLJACKSONCORE-72883        jackson-databind-2.9.7        High            ! >=2.0.0 <2.9.8        https://snyk.io/vuln/SNYK-JAVA-COMFASTERXMLJACKSONCORE-72883        
SNYK-JAVA-COMFASTERXMLJACKSONCORE-72884        jackson-databind-2.9.7        High            ! >=2.0.0 <2.9.8        https://snyk.io/vuln/SNYK-JAVA-COMFASTERXMLJACKSONCORE-72884        
SNYK-JAVA-COMFASTERXMLJACKSONCORE-72884        jackson-databind-2.9.7        High            ! >=2.0.0 <2.9.8        https://snyk.io/vuln/SNYK-JAVA-COMFASTERXMLJACKSONCORE-72884 

I also have the option to login and view the vulnerabilities via the UI.

screenshot

By clicking on any of the links on the far right, I can immediately be taken to Snyk’s Vulnerability DB to view more information. Example: SNYK-JAVA-COMFASTERXMLJACKSONCORE-72448.

Snyk's vulnerability database.

For this particular vulnerability, Snyk offers remediation advice located at the bottom. Which states: “Upgrade com.fasterxml.jackson.core:jackson-databind to version 2.6.7.2, 2.7.9.5, 2.8.11.3, 2.9.8 or higher.”

Given that there are twelve known vulnerabilities found within this image, it is a best practice for a security team to go through each and make a decision with the developer on how to best triage. For the simplicity of this post, if I were to follow the suggested remediation guidance above, and upgrade my vulnerable dependency to 2.9.8, rebuild the war file, rebuild the Docker image, and scan it with Anchore, this particular vulnerability should no longer persist.

Quick Test

mvn dependency:tree output:

Anchore:anchore-demo:war:1.0
[INFO] +- junit:junit:jar:4.11:compile
[INFO] |  - org.hamcrest:hamcrest-core:jar:1.3:compile
[INFO] - com.fasterxml.jackson.core:jackson-databind:jar:2.9.8:compile
[INFO]    +- com.fasterxml.jackson.core:jackson-annotations:jar:2.9.0:compile
[INFO]    - com.fasterxml.jackson.core:jackson-core:jar:2.9.8:compile

Once I’ve repeated the steps shown above to build war file, Docker image, and scan newly built image with Anchore, I can then see if the discussed vulnerability is present.

Overview of vulnerabilities

Anchore showing if vulnerability is present.

None present.

I can also view the changelog for this image to get a better sense of the modification I just made.

View changelog in Anchore to confirm modification made to vulnerability.

Below I can specifically see the version change I made to the jackson-databind library.

A visual of version change made.


Conclusion

This was an intentionally simple example of how a vulnerable non-os package within a Docker image can be identified and fixed with Anchore. However, you can see how easily a vulnerable package can potentially wreak havoc if the appropriate checks are not in place. In practice, Docker image scanning should be a mandatory step in a CI pipeline, and development and security teams should maintain open lines of communication when vulnerabilities are discovered within images, and then move swiftly to apply the appropriate fixes.

5 CI/CD Platforms Leverage Docker Container Technology

As containers have exploded onto the IT landscape over the last few years, more and more companies are turning to Docker to provide a quick and effective means to release software at a faster pace.

This shift has caused several Continuous Integration and Continuous Delivery (CI/CD) tools and companies to strategically create and weave new container-native solutions into their platforms.

In this blog, we’ll take a look at some of the top CI/CD players in the game and the shifts they’ve made to support their users in this brave new world of containers.

1. Jenkins

Cloudbees’ open source Jenkins CI/CD platform is arguably the most popular CI/CD platform available in 2019. Originally created in the early 2000s (as part of the Hudson project) Jenkins now has wide adoption across various types of organizations helping teams to automate any task that would otherwise put a time-consuming strain on your software team. Some of the most common uses for Jenkins include building projects, running tests, bug detection, code analysis, and project deployment.

Jenkins can be easily integrated with a Docker workflow where it manages the entire development pipeline of containerized applications.

In addition, with one of the largest open source communities among CI/CD providers, Jenkins has a wide variety of container-related plugins available to delivers solutions for source code management to security.

**Bonus: With the Anchore plugin for Jenkins, users can quickly and easily scan Docker images in a Jenkins pipeline.

2. CircleCI

CircleCI is one of the most nimble and well-integrated of the CI platforms. Founded in 2011 CircleCI provides a state of the art platform for integration and delivery, which has helped hundreds of thousands of teams across the globe to release their code through build automation, test automation, and a comprehensive deployment process.

CircleCI can be conveniently configured to deploy code to a number of environments including AWS EC2, AWS CodeDeploy, AWS S3, and Google Container Engine (GKE).

CircleCI natively supports the ability to build, test, or run as many Docker containers as you’d like. Users can run any Docker commands as well as access public and private containers registries for full control over your build environment. For convenience, CircleCI also maintains several Docker images. These images are typically extensions of official Docker images and include tools especially useful for CI/CD.

Like Jenkins, CircleCI has a robust set of integrations that cater to container users.

3. Codeship

Codeship is a CI/CD tool recently acquired by CloudBees that offers efficiency, simplicity, and speed all at the same time.

Teams can use Codeship to build, test, and deploy directly from a Bitbucket or GitHub project and it’s a concise set of features combines integration with delivery so that your code is deployed accordingly once test automation has cleared.

With Codeship Pro, the build pipeline runs in Docker containers. This enables users to take advantage of features like easy migration through the ability to use large parts of your docker-compose file to set up Codeship and updates whenever the latest stable Docker version is available.

You can learn more about how Codeship works in a containerized environment.

4. GitLab

GitLab is a rapidly growing code management platform that offers both open source and enterprise solutions for issue management, code views, as well as continuous integration and deployment, all within a single dashboard. While the main Gitlab offering is a web-based Git repository manager with features such as issue tracking, analytics, and a Wiki, Gitlab also offers a CI/CD component that allows you to trigger builds, run tests, and deploy code with each commit or push. You can run build jobs in a virtual machine, Docker container, or on another server.

Of all CI/CD platforms, Gitlab has shown a particularly strong focus on containers, even creating GitLab Container Registry, which makes it easy to store and share container images.

By building a number of toolsets that integrate seamlessly together and focusing on a growing base of container-native users, Gitlab is definitely worth a look if containers are top of mind for your company

Check out their docs to learn how to utilize Docker images within the GitLab suite of tools.

5. Codefresh

Codefresh is another CI/CD platform that has placed a heavy focused on its container first user base, offering Docker-in-Docker as a service for building CI/CD pipelines with each step of a pipeline running in its own container.

The Codefresh user interface is clear, smart, and easy to understand. You can launch a project and check its working condition as soon as the project is built and the image is created. You can also choose from a number of templates to smoothen the movement of your current project to containers.

Codefresh puts a big focus k8s, and in has some neat helm features too. Anchore’s helm chart is listed in the codefresh ui.

With Codefresh’s suite of tools, users can easily build, test, push, and deploy images, utilize a built-in Kubernetes dashboard, Docker registry, as well as release management making it much easier for container users to get work done quickly and efficiently.

Learn more about how Codefresh works with containers in their documentation.

Conclusion

With the growing move to containers in 2019, we can only expect CI/CD tools to place an even heavier focus on building solutions to support containers.

This shift to a container friendly ecosystem has and will help thousands of companies continue to see a decrease in their build time, test time, time to release.

Improving Open Source Security with Anchore and Snyk

Open source software components and dependencies are increasingly making up a vast majority of software applications. Along with the increased usage of OSS comes the inherent security risks these packages present. Enterprises looking to adopt a greater open source footprint should also employ effective tooling and processes to identify, manage, and mitigate the potential risks these libraries impose.

Containers have been gaining popularity as well among enterprises. Uniquely allowing for development and packaging of applications, and their dependencies, to improve consistency and speed of production deployments. By nature of consistency, the quality of development and software releases also improves.

Recognizing that container images need an added layer of security, Anchore conducts a deep image inspection and analysis to uncover what is within the image and generate a detailed manifest that includes packages, configuration files, language modules, and artifacts. Following analysis, user-defined acceptance policies are evaluated against the analyzed data to certify the container images.

Due to an increased number of Anchore customers asking for high-quality vulnerability data for OSS packages, Anchore has partnered with Snyk. Anchore Enterprise customers now have access to third-party vulnerability data for non-OS open source libraries from Snyk.

This database is maintained by Snyk’s security team, who spends a significant amount of time curating vulnerability data, as well as conducting their own research to uncover previously unknown vulnerabilities. Most of the vulnerabilities in Snyk’s database originate from constant monitoring of other vulnerability databases, CVEs from NVD, monitoring user activity on Github, and both manual and bulk security research.

Anchore users will get updates to vulnerability feed data at the interval they configure (default is six hours). In addition, Anchore policies can be created to enforce container images that include vulnerable packages from making their way into production environments.

Below is a snapshot of Anchore Enterprise with vulnerable Python packages identified by Snyk

Given that more organizations are increasing their use of both containers and OSS components, it is becoming more critical for enterprises to have the proper mechanisms in place to uncover and fix vulnerable packages within container images as early as possible in the development lifecycle.

Anchore strongly recommends adding image scanning as part of a continuous integration pipeline, and invoking Anchore policies to govern security vulnerabilities, configuration file contents, secrets, exposed ports, or any other user-defined checks.

Find out more about Anchore Enterprise and Snyk here: Anchore Enterprise.

Admission Control in Kubernetes with Anchore

Our focus at Anchore is analyzing, validating, and evaluating docker images against custom policies to give users visibility, control-of, and confidence-in their container images before they ever execute. And, its open-source. In this post, learn how to use the new Anchore admission controller for Kubernetes to gate execution of docker images in Kubernetes according to criteria expressed in Anchore policies such as security vulnerabilities, package manifests, image build-instructions, image source, and the other aspects of image content that Anchore Engine can expose via policy.

The Anchore admission controller implements a handler for Kubernetes’s Validating Webhook payloads specifically configured to validate Pod objects and the image references they contain.

This is a well-established pattern for Kubernetes clusters and admission controllers.

The Anchore admission controller supports three different modes of operation allowing you to tune tradeoff between control and intrusiveness for your environments.

Strict Policy-Based Admission Gating Mode

This is the strictest mode and will admit only images that are already analyzed by Anchore and receive a “pass” on policy evaluation. This enables you to ensure, for example, that no image is deployed into the cluster that has a known high-severity CVE with an available fix, or any of a number of other conditions. Anchore’s policy language supports sophisticated conditions on the properties of images, vulnerabilities, and metadata. If you have a check or condition that you want to evaluate that you’re not sure about, please let us know!

Examples of Anchore Engine policy rules that are useful in a strict admission environment:

  • Reject an image if it is being pulled from dockerhub directly
  • Reject an image that has high or critical CVEs that have a fix available, but allow high-severity if no fix is available yet
  • Reject an image if it contains a blacklisted package (rpm, deb, apk, jar, python, npm, etc), where you define the blacklist
  • Never reject images from a specific registry/repository (e.g. internal infra images that must be allowed to run)

Analysis-Based Admission Gating Mode

Admit only images that are analyzed and known to Anchore, but do not execute or require a policy evaluation. This is useful in cases where you’d like to enforce requirement that all images be deployed via a CI/CD pipeline, for example, that itself manages the Kubernetes image scanning with Anchore, but allowing the CI/CD process to determine what should run based on other factors outside the context of the image or k8s itself.

Passive Analysis Trigger Mode

Trigger an Anchore analysis of images, but to no block execution on analysis completion or policy evaluation of the image. This is a way to ensure that all images that make it to deployment (test, staging, or prod) are guaranteed to have some form of analysis audit trail available and a presence in reports and notifications that are managed by Anchore Engine.

Installation and Configuration of the Controller

Requirements:

  • Running Kubernetes cluster v1.9+
  • Configured kubectl tool with configured access (this may require some rbac config depending on your environment)
  • Enough resources to run anchore engine (a few cores and 4GB+ of RAM is recommended)

Install Anchore Engine

1. Install Anchore Engine in the cluster. There is no requirement that the installation is in the same k8s cluster or any k8s cluster, I use it here simply for convenience

helm install --name demo stable/anchore-engine

2. Run a CLI container so we can easily query anchore directly to configure a user and policy

kubectl run -i -t anchorecli --image anchore/engine-cli --restart=Always --env ANCHORE_CLI_URL=http://demo-anchore-engine-api.default.svc:8228 --env ANCHORE_CLI_USER=admin --env ANCHORE_CLI_PASS=foobar

3. From within the anchorecli container, verify the system is responding (it may take a few minutes to fully bootstrap so you may need to run this a few times until it returns all services in the “up” state). The second command will wait until the security feeds are all synced and cve data is available.

anchore-cli system status

Which should show the system version and services. If the command hangs for a second, that is normal during service bootstrap, you may need to cancel and re-run the command as all the infrastructure comes up in k8s. Once you have a successful return of system status, run a wait to make sure the system is fully initialized. This may take some time since it requires all vulnerability feed data to be synced.

anchore-cli system wait

4. From within the anchorecli container, create a new anchore account

anchore-cli account add demo

5. Add a user to the account with a set of credentials (you’ll need these later)

anchore-cli account user add --account demo controller admissioncontroller123

Now, exit the container

6. Create a new cli container using the new credentials, I’ll refer to this as ctluser_cli container

kubectl run -i --tty anchore-controller-cli --restart=Always --image anchore/engine-cli --env ANCHORE_CLI_USER=controller --env ANCHORE_CLI_PASS=admissioncontroller123 --env ANCHORE_CLI_URL=http://demo-anchore-engine-api.default.svc:8228/v1/

From within ctluser_cli container, analyze an image to verify things work

anchore-cli image add alpine
anchore-cli image list

7. Exit the anchore-controller-cli container

Configure Credentials

The helm chart and controller support two ways of passing the Anchore Engine credentials to the controller:

  • Directly in the chart via values.yaml or on cli:--set anchore.username=admissionuser --set anchore.password=mysupersecretpassword
  • Using kubernetes Secrets: kubectl create secret generic anchore-creds --from-literal=username=admissionuser --from-literal=password=mysupersecretpassword. And on chart execution/upgrade set via cli (--set anchore.credentialsSecret=<name of secret>) or set the key in values.yaml

NOTE: Using a secret is highly recommended since it will not be visible in any ConfigMaps

For this post I’ll use a secret:

kubectl create secret generic anchore-credentials --from-literal=username=controller --from-literal=password=admissioncontroller123

Next, on to the controller itself.

Install and Configure the Admission Controller

I’ll start by using the controller in Passive mode, and then show how to add the policy gating.

1. Back on your localhost, get the admission controller chart from Github

git clone https://github.com/anchore/anchore-charts
cd anchore-charts/stable/anchore-admission-controller

2. Save the following yaml to my_values.yaml

anchore:
  endpoint: "http://demo-anchore-engine-api.default.svc:8228"
  credentialsSecret: anchore-credentials

3. Install the controller chart

helm install --name democtl -f my_values.yaml .

4. Run the get_config.sh script included in the github repo to grab the validating webhook configuration. It will output validating-webhook.yaml

./files/get_validating_webhook_config.sh democtl

5. Activate the configuration

kubectl apply -f validating-webhook.yaml

6. Verify its working

kubectl run ubuntu --image ubuntu --restart=Never
kubectl attach -i -t <ctluser_cli>
anchore-cli image list

You should see the ‘ubuntu’ tag available and analyzing/analyzed in Anchore. That is the passive-mode triggering the analysis.

For example:

zhill@localhost anchore-admission-controller]$ kubectl run -i -t ubuntu --image ubuntu --restart=Never
If you don't see a command prompt, try pressing enter.
root@ubuntutest:/# exit
exit
[zhill@localhost anchore-admission-controller]$ kubectl logs test2-anchore-admission-controller-7c47fb85b4-n5v7z 
...
1207 13:30:52.274424       1 main.go:148] Checking image: ubuntu
I1207 13:30:52.274448       1 main.go:193] Performing passive validation. Will request image analysis and always allow admission
I1207 13:30:55.180722       1 main.go:188] Returning status: &AdmissionResponse{UID:513100b2-fa24-11e8-9154-d06131dd3541,Allowed:true,Result:&k8s_io_apimachinery_pkg_apis_meta_v1.Status{ListMeta:ListMeta{SelfLink:,ResourceVersion:,Continue:,},Status:Success,Message:Image analysis for image ubuntu requested and found mapped to digest sha256:acd85db6e4b18aafa7fcde5480872909bd8e6d5fbd4e5e790ecc09acc06a8b78,Reason:,Details:nil,Code:0,},Patch:nil,PatchType:nil,}
...

And in the ctluser_cli container I can confirm the image was added an analyzed:

/ # anchore-cli image get ubuntu
Image Digest: sha256:acd85db6e4b18aafa7fcde5480872909bd8e6d5fbd4e5e790ecc09acc06a8b78
Parent Digest: sha256:6d0e0c26489e33f5a6f0020edface2727db9489744ecc9b4f50c7fa671f23c49
Analysis Status: analyzed
Image Type: docker
Image ID: 93fd78260bd1495afb484371928661f63e64be306b7ac48e2d13ce9422dfee26
Dockerfile Mode: Guessed
Distro: ubuntu
Distro Version: 18.04
Size: 32103814
Architecture: amd64
Layer Count: 4
Annotations: requestor=anchore-admission-controller

Full Tag: docker.io/ubuntu:latest

Also, note that the controller has added an Annotation on the anchore image to indicate that it was analyzed at the request of the admission controller. This is useful for later requests to Anchore itself so you know which images were analyzed by the controller compared to those that may have been added as part of CI/CD.

Great! Next, I’ll walk through using the policy gating mode.

Using Strict Policy-Based Admission

In policy gating mode, images must both be analyzed and pass a policy evaluation in order to be admitted.

It’s important to note that the controller requires that the images already be analyzed prior to the admission request. This is because the analysis can take more than a few seconds and may be more (depending on the wait queue), so admission decisions do not wait on an analysis submission and completion.

Configure a Specific Policy

It’s likely that the same policy used for something like CI/CD is not appropriate for execution gating. Anchore Engine directly supports multiple “policy bundles”. In a production environment, you’ll probably want to set a custom policy bundle for the admission controller to use.

1. So, let’s attach to the ctluser_cli pod again and add a new policy

kubectl attach -i -t < ctluser_cli pod>

2. Now, from within the ctluser_cli container shell:

Create a file, policy.json with the following content (or create a similar policy in the Enterprise UI if you’re an Enterprise customer):

{
  "id": "admissionpolicy",
  "version": "1_0",
  "name": "AdmissionControllerDefaultPolicy",
  "comments": "",
  "policies": [
    {
      "id": "Default",
      "version": "1_0",
      "name": "Default",
      "comments": "Default policy for doing cve checks",
      "rules": [
        {
          "id": "cverule1",
          "gate": "vulnerabilities",
          "trigger": "package",
          "params": [ 
            {"name": "package_type", "value": "all"},
            {"name": "severity", "value": "low"},
            {"name": "severity_comparison", "value": ">="}
          ],
          "action": "STOP"
        }
      ]
    }
  ],  
  "whitelists": [],
  "mappings": [
    {
      "name": "Default",
      "registry": "*",
      "repository": "*",
      "image": {
        "type": "tag",
        "value": "*"
      },
      "policy_ids": ["Default"],
      "whitelist_ids": []
    }
  ],
  "whitelisted_images": [],
  "blacklisted_images": []  
}

For this example, I’m using a policy for triggering low severity vulnerabilities just to show how the gating works. A more appropriate production severity would be high or critical to avoid blocking too many images.

To save the policy:

anchore-cli policy add policy.json

3. Update your my_values.yaml to be:

anchore:
  endpoint: "http://demo-anchore-engine-api.default.svc:8228"
  credentialsSecret: anchore-credentials
  policybundle: admissionpolicy
enableStrictGating: true

4. Remove the webhook config to disable admission request for the upgrade of the controller

kubectl delete validatingwebhookconfiguration/demo-anchore-admission-controller.admission.anchore.io

There are cleaner ways to upgrade that avoid this, such as using distinct namespaces and namespace selectors, but that is a bit beyond the scope of this post.

5. And upgrade the deployment

helm upgrade -f my_values.yaml --force democtl .

6. Ensure the controller pod got updated. I’ll delete the pod and let the deployment definition recreate it with the new configmap mounted

kubectl delete po -l release=demotctl

7. Re-apply the webhook config

kubectl apply -f validate-webhook.yaml

8. To show that it’s working, use an image that has not been analyzed yet.

kubectl run -i -t ubuntu2 --image ubuntu --restart=Never

You will see an error response from Kubernetes that the pod could not be executed due to failing policy.

[zhill@localhost anchore-admission-controller]$ kubectl run -i -t ubuntu2 --image ubuntu --restart=Never
Error from server: admission webhook "demo-anchore-admission-controller.admission.anchore.io" denied the request: Image ubuntu with digest sha256:acd85db6e4b18aafa7fcde5480872909bd8e6d5fbd4e5e790ecc09acc06a8b78 failed policy checks for policy bundle admissionpolicy    

Configuring How the Controller Operates

The controller is configured via a ConfigMap that is mounted as a file into the container. The helm chart exposes a few values to simplify that configuration process. For a full set of configuration options see the chart,

Caveats

Currently, there is no Docker Registry credential coordination between k8s and Anchore. For Anchore to be able to pull and analyze images you must configure it to have access to your image registries.

Future Work and Feedback

  • Mutating Webhook Support
    • Integration into workflows that leverage existing policy systems like the Open Policy Agent, and/or integrating such an agent directly into this controller to expand its context to enable admission decisions based on combinations of image analysis context and k8s object context.
  • Enhanced policy mapping capabilities
    • Dynamically map which policy bundle to evaluate based on labels and/or annotations
  • Enhanced Audit trail and configurability via CRDs
    • Leverage API extensions to allow uses to query k8s APIs for analysis information without special tooling.

We love feedback, so drop us a line on Slack or file issues on GitHub

The controller code is on Github and so is the chart.

Anchore Engine on Azure Kubernetes Service Cluster with Helm

This post will walk through deploying an AKS Cluster using the Azure CLI. Once the cluster has been deployed, Anchore Engine will be installed and run via Helm on the cluster. Following the install, I will configure Anchore to authenticate with Azure Container Registry (ACR) and analyze an image.

Prerequisites

Create Azure Resource Group and AKS Cluster

In order to create a cluster, a resource group must first be created in Azure.

Azure CLI:

az group create --name anchoreAKSCluster --location eastus

Once the resource group has been created, we can create a cluster. The following command creates a cluster name anchoreAKSCluster with three nodes.

Azure CLI:

az aks create --resource-group anchoreAKSCluster --name anchoreAKSCluster --node-count 3 --enable-addons monitoring --generate-ssh-keys

Once the cluster has been created, use kubectl to manage the cluster. To install it locally use the following command:

Azure CLI:

az aks install-cli

Configure kubectl to connect to the cluster you just created:

Azure CLI:

az aks get-credentials --resource-group anchoreAKSCluster --name anchoreAKSCluster

In order to verify a successfull connection run the following:

kubectl get nodes

Kubernetes Dashboard

To view the Kubernetes Dashboard for your cluster run the following command:

Azure CLI:

az aks browse --resource-group anchoreAKSCluster --name anchoreAKSCluster

Helm Configuration

Prior to deploying Helm in an RBAC-enabled cluster, you must create a service account and role binding for the Tiller service.

Create a file name helm-rbac.yaml:

apiVersion: v1
kind: ServiceAccount
metadata:
  name: tiller
  namespace: kube-system
---
apiVersion: rbac.authorization.k8s.io/v1
kind: ClusterRole
metadata:
  name: kube-dashboard
rules:
- apiGroups: ["*"]
  resources: ["*"]
  verbs: ["*"]
---
apiVersion: rbac.authorization.k8s.io/v1
kind: ClusterRoleBinding
metadata:
  name: tiller
roleRef:
  apiGroup: rbac.authorization.k8s.io
  kind: ClusterRole
  name: cluster-admin
subjects:
  - kind: ServiceAccount
    name: tiller
    namespace: kube-system
---
apiVersion: rbac.authorization.k8s.io/v1
kind: ClusterRoleBinding
metadata:
  name: rook-operator
  namespace: rook-system
roleRef:
  apiGroup: rbac.authorization.k8s.io
  kind: ClusterRole
  name: kube-dashboard
subjects:
- kind: ServiceAccount
  name: kubernetes-dashboard
  namespace: kube-system

Run the following command to create the account and role binding:

kubectl apply -f helm-rbac.yaml

To deploy Tiller in the AKS cluster run the following command:

helm init --service-account tiller

Install Anchore

We will deploy Anchore Engine via the lastest Helm Chart release. For a detailed description of the chart options view the Github repo.

helm install --name anchore-demo stable/anchore-engine

Following this, we can use kubectl get deployments to show the deployments.

Output:

$ kubectl get deployments
NAME                                 READY   UP-TO-DATE   AVAILABLE   AGE
anchore-demo-anchore-engine-core     1/1     1            1           5m36s
anchore-demo-anchore-engine-worker   1/1     1            1           5m36s
anchore-demo-postgresql              1/1     1            1           5m36s

Expose API port externally:

kubectl expose deployment anchore-demo-anchore-engine-core --type=LoadBalancer --name=anchore-engine --port=8228

Output:

service/anchore-engine exposed

View service and External IP:

kubectl get service anchore-engine

Output:

NAME             TYPE           CLUSTER-IP    EXTERNAL-IP      PORT(S)          AGE
anchore-engine   LoadBalancer   10.0.56.241   40.117.232.147   8228:31027/TCP   12m

Assuming you have the Anchore-CLI, you can pass the EXTERNAL-IP to the CLI as the --url parameter.

View the status of Anchore:

anchore-cli --url http://40.117.232.147:8228/v1 --u admin --p foobar system status

Output:

Service simplequeue (anchore-demo-anchore-engine-core-6447cb7464-cp295, http://anchore-demo-anchore-engine:8083): up
Service analyzer (anchore-demo-anchore-engine-worker-746cf99f7c-rkprd, http://10.244.2.8:8084): up
Service kubernetes_webhook (anchore-demo-anchore-engine-core-6447cb7464-cp295, http://anchore-demo-anchore-engine:8338): up
Service policy_engine (anchore-demo-anchore-engine-core-6447cb7464-cp295, http://anchore-demo-anchore-engine:8087): up
Service catalog (anchore-demo-anchore-engine-core-6447cb7464-cp295, http://anchore-demo-anchore-engine:8082): up
Service apiext (anchore-demo-anchore-engine-core-6447cb7464-cp295, http://anchore-demo-anchore-engine:8228): up

Engine DB Version: 0.0.7
Engine Code Version: 0.2.4

It is recommended to add the URL, username, and password as environment variables to avoid passing them with every anchore-cli command. View repo for more info.

You are now ready to begin analyzing images

Creating a Container Registry in Azure

First, create a resource group.

Azure CLI:

az group create --name anchoreContainerRegistryGroup --location eastus

Create a container registry.

Azure CLI:

az acr create --resource-group anchoreContainerRegistryGroup --name anchoreContainerRegistry001 --sku Basic

Verify login to create ACR.

Azure CLI:

az acr login --name anchoreContainerRegistry001

Push Image to ACR

In order to push an image to your newly created container registry, you must have an image. I’ve already pulled an image from my Docker Hub account via the following command:

docker pull jvalance/sampledockerfiles:latest

Once I have the image locally, it needs to be tagged with the fully qualified name of the ACR login server. This can be obtained via the following command:

Azure CLI:

az acr list --resource-group anchoreContainerRegistryGroup --query "[].{acrLoginServer:loginServer}" --output table

Output:

AcrLoginServer
--------------------------------------
anchorecontainerregistry001.azurecr.io

Run the following command to tag and push image:

docker tag jvalance/sampledockerfiles anchorecontainerregistry001.azurecr.io/sampledockerfiles:latest

docker push anchorecontainerregistry001.azurecr.io/sampledockerfiles:latest

View your pushed image in ACR.

Azure CLI:

az acr repository list --name anchorecontainerregistry001 --output table

Output:

Result
-----------------
sampledockerfiles

Now that we have an image in ACR we can add the created registry to Anchore.

Add the Created Registry to Anchore and Begin Analyzing images

With the anchore-cli we can easily add the created container registry to Anchore and analyzed the image.

  • –registry-type: docker_v2
  • Registry: myregistryname.azurecr.io
  • Username: Username of ACR account
  • Password: Password of ACR account

To obtain the credentials of the ACR account run the following command:

Azure CLI:

az acr credential show --name anchorecontainerregistry001

Output:

{
  "passwords": [
    {
      "name": "password",
      "value": "********"
    },
    {
      "name": "password2",
      "value": "********"
    }
  ],
  "username": "anchoreContainerRegistry001"
}

Run the following command to add the registry to Anchore:

anchore-cli registry add --registry-type <Type> <Registry> <Username> <Password>

View the added registry:

anchore-cli registry list

Output:

Registry                                      Type             User                               
anchoreContainerRegistry001.azurecr.io        docker_v2        anchoreContainerRegistry001

Once with configured the registry we can analyze the image we just pushed to it with the following command:

anchore-cli image add anchoreContainerRegistry001.azurecr.io/sampledockerfiles:latest

We can view the analyzed image via the image list command:

anchore-cli image list

Output:

Full Tag                                                               Image ID                                                                Analysis Status        
anchoreContainerRegistry001.azurecr.io/sampledockerfiles:latest        be4e57961e68d275be8600c1d9411e33f58f1c2c025cf3af22e3901368e02fe1        analyzed             

Conclusion

Following these examples, we can see how simple it is to deploy an AKS cluster with a running Anchore Engine service, and additionally, if we are using ACR as a primary container registry, easily set up and configure Anchore to scan any images that reside within the registry.

Anchore Enterprise 1.2 is Available Today

We’re happy today to announce the immediate availability of Anchore Enterprise version 1.2, the latest in our journey to provide users with the ability to enforce container security and best-practices with usable, flexible, cross-organization, and above all time-saving technology and techniques from Anchore. This release is based on the all-new (and also available today) OSS Anchore Engine version 0.3.0.

New Features

In addition to all of the features available already in Anchore Enterprise, Anchore Enterprise 1.2 adds major new features that have been built in response to direct input from existing Anchore users and customers. As organizations continue to push forward with a reliance on container technology as the foundation for production application deployment, organizational needs in the areas of security, compliance and various types of control integration points have become much more broad in scope. The overarching purpose of many of the new features of Anchore Enterprise 1.2 is to directly address these needs, by introducing capabilities that allow for more sophisticated usage of (and refined access to) the core functions of Anchore container image scanning. The major new features of this release are:

  • New Multi-user Support: updated account/user model and management APIs
  • Role Based Access Control (RBAC): configure users and teams with different access levels within a scope of resources
  • New “Security First” Reports: aggregate reports of vulnerable images given security identifier inputs, with formatted report generation available in the Anchore Enterprise UI
  • New UI Controls and Features: User management, RBAC management, User switching support in the Anchore Enterprise UI
  • Inclusion of vulnerability data from Snyk: accurate, high fidelity and frequently updated language package (NPM, GEM, Java, Python, more to come) software vulnerability detection, to seamlessly improve existing security scanning features with best-in-class vulnerability data

With the combination of a full set of account and user management APIs and Role Based Access Controls, Anchore users can now overlay a flexible organizational structure atop Anchore, allowing different development teams, security teams, and ops teams with the right levels of access and resource views within a common deployment of Anchore Enterprise, easily managed and accessible via the included GUI. While Anchore continues to allow users to query and generate security and other reports based on image information, Anchore Enterprise 1.2 includes an all-new ‘Security First’ query set, allowing sec/ops oriented users to instead generate reports based on security information (CVE Vulnerability identifiers, vendor vulnerability identifiers, software package information, etc). Finally, the Anchore Enterprise GUI allows for all Anchore core functionality to be accessed quickly by users with different needs and roles and has capabilities allowing enabled users to access resources across accounts in one place.

Technology Refresh

In addition to this collection of directly usable features in Anchore Enterprise 1.2, there have also been a number of major technology framework updates that are part of OSS Anchore Engine 0.3.0 and Enterprise 1.2, including:

For a full description of new features, improvements and fixes available in Anchore Engine OSS.

We would like to sincerely thank all of our open-source users, customers and contributors for all of the spirited discussion, feedback, and code contributions that are all part of this latest release of Anchore Engine OSS!

Anchore Enterprise 1.2 Available Now

With Anchore Enterprise 1.2, available immediately, our goal has been to include a brand new set of exciting and usable updates for existing Anchore users that can be utilized immediately by upgrading existing deployments of Anchore Enterprise, and also to provide an even more compelling starting point for any organizations looking to quickly and easily add powerful security, compliance and best-practice enforcement capabilities to existing container environments.

We sincerely hope you enjoy our latest release, and look forward to working with you!

Integrating Anchore Scanning with Gitlab

This will walk through integrating Anchore scanning into a Gitlab container image build pipeline. During the first step, a Docker image will be built from a Dockerfile. Following this, during the second step Anchore will scan the image, and depending on the result of the policy evaluation, proceed to the final step. During the final step, the built image will be published and reports will be generated.

Follow along with this blog post by using the GitLab repo here.

This approach differs from previous posts where an Anchore engine service has been accessible from the build pipeline.

Prerequisites

  • Gitlab account
  • Dockerfile to build container image

Build Image

In the first stage of the pipeline, we build a Docker image from a Dockerfile as defined in our .gitlab-ci.yml

container_build:
stage: build
image: docker:stable
services:
- docker:stable-dind

variables:
DOCKER_DRIVER: overlay2

script:
- docker_login
- docker pull "${CI_REGISTRY_IMAGE}:${CI_COMMIT_REF_SLUG}" || true
- docker build --cache-from "${CI_REGISTRY_IMAGE}:${CI_COMMIT_REF_SLUG}" -t "$IMAGE_NAME" .
- docker push "$IMAGE_NAME"

Scan Image with Anchore

In the second stage of the pipeline, we scan the built image with Anchore as defined in our .gitlab-ci.yml:

container_scan:
stage: scan
image:
name: anchore/anchore-engine:latest
entrypoint: [""]
services:
- name: anchore/engine-db-preload:latest
alias: anchore-db

variables:
GIT_STRATEGY: none
ANCHORE_HOST_ID: "localhost"
ANCHORE_ENDPOINT_HOSTNAME: "localhost"
ANCHORE_CLI_USER: "admin"
ANCHORE_CLI_PASS: "foobar"
ANCHORE_CLI_SSL_VERIFY: "n"
ANCHORE_FAIL_ON_POLICY: "true"
ANCHORE_TIMEOUT: 500

script:
- |
curl -o /tmp/anchore_ci_tools.py https://raw.githubusercontent.com/anchore/ci-tools/master/scripts/anchore_ci_tools.py
chmod +x /tmp/anchore_ci_tools.py
ln -s /tmp/anchore_ci_tools.py /usr/local/bin/anchore_ci_tools
- anchore_ci_tools --setup
- anchore-cli registry add "$CI_REGISTRY" gitlab-ci-token "$CI_JOB_TOKEN" --skip-validate
- anchore_ci_tools --analyze --report --image "$IMAGE_NAME" --timeout "$ANCHORE_TIMEOUT"
- |
if ; then
anchore-cli evaluate check "$IMAGE_NAME"
else
set +o pipefail
anchore-cli evaluate check "$IMAGE_NAME" | tee /dev/null
fi

artifacts:
name: ${CI_JOB_NAME}-${CI_COMMIT_REF_NAME}
paths:
- image-*-report.json

Publish image

In the final stage of the pipeline, we push the Docker image to a registry as defined in the .gitlab.yml:

container_publish:
stage: publish
image: docker:stable
services:
- docker:stable-dind

variables:
DOCKER_DRIVER: overlay2
GIT_STRATEGY: none

script:
- docker_login
- docker pull "$IMAGE_NAME"
- docker tag "$IMAGE_NAME" "${CI_REGISTRY_IMAGE}:${CI_COMMIT_REF_SLUG}"
- docker push "${CI_REGISTRY_IMAGE}:${CI_COMMIT_REF_SLUG}"
- |
if ; then
docker tag "$IMAGE_NAME" "${CI_REGISTRY_IMAGE}:latest"
docker push "${CI_REGISTRY_IMAGE}:latest"
fi

Example

It contains a very simple Nodejs application, which is published to a registry as a runnable docker container.

After the container is built, it is sent through an Anchore engine scan.

  • anchore/anchore-engine:latest is used as the build container for the scan job.
  • anchore/engine-preload-db:latest is a postgres database, preloaded with the Anchore vulnerability data. This is used as a service in the scan job.
  • The default configuration for Anchore Engine is used on the build container.
  • Scans use the default Anchore policy. Using customized policies will become an option at a future time.
  • A timeout of 500s is used for this project, this value can be adjusted for whatever container is being scanned with the ANCHORE_TIMEOUT environment variable. Some containers take longer to scan than others.

To gate the container publish on a successful Anchore Engine scan, set the environment variable ANCHORE_FAIL_ON_POLICY='true'. This will cause the pipeline to fail if a scan fails.

Reports Provided by Anchore

When Anchore scanning finishes, by default, the following reports are available as artifacts. Report generation is configurable in anchore_ci_tools.py with the –content & –report flags.

  • image-content-os-report.json – all OS packages installed in the image
  • image-content-npm-report.json – all NPM modules installed in the image
  • image-content-gem-report.json – all Ruby gems installed in the image
  • image-content-python-report.json – all Python modules installed in the image
  • image-content-java-report.json – all Java modules installed in the image
  • image-vuln-report.json – all CVE’s found in the image
  • image-details-report.json – image metadata utilized by Anchore Engine
  • image-policy-report.json – details of the policy applied to the Anchore scan

Integrating Anchore Scanning with CircleCI

This post will walk through integrating Anchore scanning into a CircleCI pipeline. During the first step, a Docker image will be built from a Dockerfile. Following this, during the second step Anchore will scan the image, and depending on the result of the policy evaluation, proceed to the final step. During the final step, the built image will be pushed to a Docker registry.

Prerequisites

Setup

Prior to setting up your CircleCI build pipeline, an Anchore Engine service needs to be accessible from the pipeline. Typically this is on port 8228. In this example, I have an Anchore Engine service on AWS EC2 with standard configuration. I also have a Dockerfile in a Github repository that I will build an image from during the first step of the pipeline. In the final step, I will be pushing the built image to an image repository in my personal Dockerhub.

The Github repository can be referenced here.

Repository contents:

  • .circleci directory (Contains config.yml needed to define CircleCI build)
  • Dockerfile

Most typically, we advise on having a staging registry and production registry. Meaning, being able to push and pull images freely from the staging/dev registry while maintaining more control over images being pushed to the production registry. In this example, I am using the same registry for both.

I’ve added the following environment variables via the configuration settings page within Circle:

  • ANCHORE_CLI_PASS
  • ANCHORE_CLI_URL
  • ANCHORE_CLI_USER
  • ANCHORE_FAIL_ON_POLICY
  • ANCHORE_RETRIES
  • ANCHORE_SCAN_IMAGE
  • DOCKER_PASSWORD
  • DOCKER_USERNAME

Build Image

In the first step of the pipeline, we build a Docker image from a Dockerfile and push it to a registry as defined in our config.yml:

build:
    machine: true
    steps:
      - checkout
      - run:
          name: Build and push Docker image
          command: |
            docker login -u $DOCKER_USERNAME -p $DOCKER_PASSWORD
            docker build -t $DOCKER_USERNAME/sampledockerfiles:latest .
            docker push $DOCKER_USERNAME/sampledockerfiles:latest

Scan Image with Anchore

In the second step of the pipeline, we scan the built image with Anchore as defined in our config.yml:

scan:
    docker:
      - image: anchore/engine-cli:latest
    steps:
      - run:
          name: Anchore Scan
          command: |
            echo "Adding image to Anchore Engine"
            anchore-cli image add $ANCHORE_SCAN_IMAGE
            echo "Waiting for image analysis to complete"
            counter=0
            while (! (anchore-cli image get $ANCHORE_SCAN_IMAGE | grep 'Status: analyzed') ) ; do echo -n "." ; sleep 10 ; if  ; then echo " Timeout waiting for analysis" ; exit 1 ; fi ; counter=$(($counter+1)) ; done
            echo "Analysis complete"
            if  ; then anchore-cli evaluate check $ANCHORE_SCAN_IMAGE  ; fi

Depending on the output of the policy evaluation, the pipeline may or may not fail. In this case, I have set ANCHORE_FAIL_ON_POLICY to true and exposed port 22. This is in violation of a policy rule, so the build will fail during this step.

Push Image

In the final step of the pipeline, we push the Docker image to a registry as defined in the config.yml:

push:
    machine: true
    steps:
      - run:
          name: Push image to Docker hub
          command: |
            docker login -u $DOCKER_USERNAME -p $DOCKER_PASSWORD
            docker build -t $DOCKER_USERNAME/sampledockerfiles:latest .
            docker push $DOCKER_USERNAME/sampledockerfiles:latest

CircleCI Workflow

Putting all the steps together, we define a sequential workflow in our config.yml as follows:

workflows:
  version: 2
  build_scan_push:
    jobs:
      - build
      - scan:
          requires:
            - build
      - push:
          requires:
            - scan

As a reminder, we advise having separate Docker registries for images that are being scanned with Anchore, and images that have passed an Anchore scan. For example, a registry for dev/test images, and a registry to certified, trusted, production-ready images.

Integrating Anchore Scanning in a Codefresh Pipeline

In this template, we will walk through how to configure a Codefresh pipeline to build an image from a Dockerfile, conduct an Anchore scan, evaluate the scanned image against an Anchore policy, and push it to a Docker registry.

Codefresh pipelines, are the core component of the Codefresh platform. These pipelines are workflows that contain user-defined steps that are all executed inside a user-chosen Docker container. These steps are defined using a codefresh.yaml file.

The Anchore scanning step will take place prior to the image being pushed to a Docker registry. Depending on the output of the policy evaluation and pipeline configuration, the image may not be pushed into the registry.

Setup

Prior to setting up our Codefresh pipeline, an Anchore Engine service needs to be accessible from the pipeline. Typically this is on port 8228. In this example, I have an Anchore Engine service on AWS EC2 with standard configuration. I also have a Dockerfile in a Github repository that I will build an image from during the first step of the pipeline. In the final step, I will be pushing the built image to an image repository in my personal Dockerhub.

Most typically, we advise on having a staging registry and production registry. Meaning, being able to push and pull images freely from the staging/dev registry, while maintaining more control over images being pushed to the production registry. In this example, I am using the same registry for both.

In the configuration section of the Codefresh pipeline, I’ve added the following environment variables:

If ANCHORE_FAIL_ON_POLICY is set to true, the pipeline will fail, and the image will not be pushed to the registry.

  • dockerhubUsername
  • dockerhubPassword
  • ANCHORE_CLI_URL
  • ANCHORE_CLI_USER
  • ANCHORE_CLI_PASS
  • ANCHORE_CLI_IMAGE
  • ANCHORE_RETRIES
  • ANCHORE_FAIL_ON_POLICY

Build Image

In the first step of the pipeline, we build a Docker image from a Dockerfile as defined in our codefresh.yaml:

build_image:
    title: Building Docker Image
    type: build
    image_name: jvalance/sampledockerfiles
    working_directory: ./
    dockerfile: Dockerfile

Conduct Anchore Scan

In the second step of the pipeline, we scan the built image with Anchore as defined in our codefresh.yaml:

anchore_scan:
    title: Scanning Docker Image
    image: anchore/engine-cli:latest
    description: Analyzing Image with Anchore...
    commands:
      - echo "Adding image to Anchore engine"
      - anchore-cli image add ${{ANCHORE_SCAN_IMAGE}}
      - echo "Waiting for image analysis to complete"
      - counter=0
      - while (! (anchore-cli image get ${{ANCHORE_SCAN_IMAGE}} | grep 'Status: analyzed') ) ; do echo -n "." ; sleep 10 ; if  ; then echo " Timeout waiting for analysis" ; exit 1 ; fi ; counter=$(($counter+1)) ; done
      - echo "Analysis complete"
      - if  ; then anchore-cli evaluate check ${{ANCHORE_SCAN_IMAGE}}  ; fi 

Depending on the output of the policy evaluation, the pipeline may or may not fail. In this case, I have set ANCHORE_FAIL_ON_POLICY to true and exposed port 22. This is in violation of a policy rule, so the build will fail during this step.

Push Image

In the final step of the pipeline, we push the Docker image to a registry as defined in the codefresh.yaml:

push_image:
    title: Push Docker Image
    description: Pushing Docker Image...
    type: push
    candidate: '${{build_image}}'
    tag: latest
    registry: docker.io
    credentials:
      username: '${{dockerhubUsername}}'
      password: '${{dockerhubPassword}}'

As a reminder, we advise having separate Docker registries for images that are being scanned with Anchore, and images that have passed an Anchore scan.

Vendorless, Security the Open Source Way

Whether you love or hate the term, ‘serverless’ is one of the hottest new trends in the cloud computing world. Despite what the name may suggest, there are certainly still servers running your code, the real innovation here is that you do not need to manage these servers you just publish your code to be run by the serverless infrastructure. This architecture can be better described as FaaS: functions as a service or BaaS: backend as a service. Amazon leads this innovation with its Lambda service and other cloud providers have followed suit, including Google with Google Cloud Functions and Microsoft with Azure Functions.

Of course, this innovation is not restricted to proprietary offerings from large vendors, there are a number of open source projects offering serverless frameworks including Kubeless, Nuclio, OpenFaas, OpenWhisk, among many others.

A couple of years ago if an organization wanted to adopt the serverless architecture then they would have needed to engage with a vendor such as Amazon however today a growing number of open source projects address that need which leads me to the subject of this blog.

One of the most common trends we have seen in the industry is one that is rarely spoken about, in fact, it is so common now that it’s really the norm: Vendorless.

To best describe the term let’s walk through the way that most organizations started building their container infrastructure:

  • Linux as the foundation of their infrastructure: Pick your favorite distribution
  • Ansible (or Puppet, Chef, etc) to deploy the infrastructure
  • Docker to run containers
  • Jenkins to run the build pipeline
  • Kubernetes to handle container orchestration
  • Prometheus for monitoring
  • Elasticsearch + Fluentd + Kibana (EFK) for logging and analytics

The common theme here is obviously open source. A few years ago, with the exception of Linux, this list would look very different, either build using a monolithic solution form vendors such as IBM and Oracle or comprised of a number of proprietary products. Today the majority of cloud infrastructure deployments are built using open source solutions.

Getting started with an open source project such as Jenkins is simple, you can download a container image or packages for most Linux distributions and follow great documentation provided by the upstream project. There are often support forums or online communities using IRC or Slack. To get started you don’t need to call a vendor, sign an NDA, fill out an evaluation request to obtain a time-limited eval key and then be hounded by sales. You can get started without even talking to a vendor.

Most of the container projects we have seen today start ‘vendorless’ in this manner. But as deployments move from simple POCs and development environments to production that is often when vendors do get involved, typically the driver is the need for commercial support or to obtain value-added features. In the example we used above of Jenkins, we see many organizations move from Jenkins community edition to Cloudbees Jenkins Enterprise or from upstream Kubernetes to Red Hat OpenShift. So thankfully, speaking as a vendor, there is still a role for vendors, however, they typically get involved a little later in the project lifecycle and have to really earn their seat at the table with added features, certifications and support.

While open source solutions have historically provided the core layer of infrastructure, there have been areas in which organizations would need to look at proprietary solutions. The most notable of which is the security which had until recently remained the bastion of commercial vendors.

For container infrastructure there are typically two key security needs:

  1. Image Security – Analyzing images to ensure they do not contain vulnerabilities and are in compliance with your organization’s operational and security policies.
  2. Runtime Security – Real-time monitoring of containers to ensure report on or block malicious activity at the network, system or storage layers.

We have spoken at length about the first area: image security and covered how the open source Anchore Engine can quickly and easily be integrated into your CI/CD pipeline, container registries and Kubernetes infrastructure to ensure that only images that meet your organization’s policies are deployed.

Over the last decade, it has become clear that open source technologies provide the right foundation for infrastructure and at Anchore we believe that security and analysis tools should be open source so that anyone can inspect the code to validate that the results are fair and accurate. And since security tools typically are granted the highest level of privilege in terms of access and control of resources you need the mantra of “Trust but verify” is especially true.

With Anchore Engine we ensure that only the right content, from known sources configured in the right way, is promoted from your CI/CD system and deployed in production but once deployed unknown vulnerabilities or misconfigurations can lead to a container being exploited.

The traditional approach to security monitoring involved looking for known signatures is network traffic, files, etc. Similar to the approach taken in the early days of antivirus software where security vendors played an endless game of cat and mouse with virus authors, requiring the antivirus software to be continually updated with new signatures and new viruses were detected in the wild. Over time these solutions evolved to use heuristics in addition to signature mapping. A similar technique is used by the Falco project which takes a more behavioral approach to detection. While there are many different ways that a container could be compromised all of which would need to be explicitly monitored for Falco looks at what is happening once the attacker has compromised the container allowing you to report and then block anomalous behaviors. For example, why would a reverse proxy container need to write a file into the /bin directory, why would a PostgreSQL container make an outbound network connection, why would your Redis server spawn a shell process?

With the addition of Anchore Engine and Sysdig Falco you can build an open and secure container infrastructure.

Introducing Anchore Enterprise 1.1

Today, we’re proud to be announcing the availability of Anchore Enterprise version 1.1. This release of services and software from Anchore will now provide a common framework for users seeking to achieve a secure, compliant container image environment. As container-based deployments are extending further into enterprise infrastructure, our objective has remained the same: provide technology and expertise in the areas of security and operational best-practices enforcement, in order to remove as many barriers as possible toward achieving a fully automated container build process.

With Anchore Enterprise 1.1, we have added some major improvements to core Anchore technology, based on the team’s insights as well as feedback from a growing Anchore user community. We believe that both existing and new users of Anchore will find these updates and additions powerful and easy to use.

Anchore Engine: OSS for Enterprise

At the core of Anchore Enterprise 1.1 is the open-source Anchore Engine. Anchore Engine is a stand-alone service that deploys anywhere that can run a container, providing a broad API for users, clients and CI/CD frameworks alike to request container image content analyses, perform security scans, generate a variety of reports, and execute customizable security and best-practice policy evaluations. Anchore Engine can be used interactively, has been integrated into leading CI/CD frameworks for build-time security enforcement, and provides mechanisms to constantly scan and evaluate policies against your container images as new vulnerabilities are published or your own policy definitions evolve. While the latest Anchore Engine is always freely available as an open-source offering, many enterprise-focused improvements have been introduced since the last Anchore Enterprise release, including:

  • Ability to scale up the Anchore Engine service to accommodate large numbers of image scans, both in aggregate and per unit time
  • Introduction of both OS package (RPMs, Debian Package, Alpine Package) scans as well as Non-OS, language package (Node NPM, Ruby GEM, Python, and Java Archive) content and security scans
  • Refined policy language, including the ability to tune, in fine detail, security checks and image content checks
    Extended query capabilities, for obtaining deep information about the contents of container images and their build metadata
  • Enterprise storage integrations against AWS S3, Swift, and other S3 compatible storage back-ends
  • Introduction of an event subsystem that provides detail records for information and error level system events, from the engine
  • Availability of Prometheus metrics, for integration into service monitoring systems that can consume Prometheus data sources
  • Many system improvements largely targeted at processing and reporting against very large container image sets, over time.

The latest version of Anchore Engine is 0.2.4, which is at the core of Anchore Enterprise 1.1.

Anchore Enterprise


New for this release, we’re excited to introduce the Anchore Enterprise UI, which is an on-premises service that provides Anchore users a fully graphical console, accessible via any client browser. The Anchore Enterprise UI console includes:

  • Graphical container image navigation, showing all container registries, repositories, images and image histories in an interface that makes for simple viewing and navigation of the global collection of container images
  • Ability to add new images or entire image repositories via a simple graphical control
  • Complete and deep image overview, including individual controls for reviewing image contents, security scan reports, and policy evaluation results
  • Ability to generate PDF reports for sharing or offline review
  • A graphical changelog application, where users can see at a glance the differences between container images over time, at a fine-grained level of detail
  • An event log viewer, for Anchore operators to see and filter operational events that are being retrieved from the Anchore Engine
  • Container image registry configuration UI, where users can add image public and private registry credentials, supporting
  • Azure, AWS, Google, and any docker v2 on-premises registry
  • A policy manager control, to help manage your set of policies for the different phases of your container environment
  • A graphical policy editor for creating, testing and tuning Anchore security, compliance and best-practice enforcement policies

Anchore Enterprise On-prem Services

Full Control Over Vulnerability Data & Air-Gapped Operation

Anchore Enterprise 1.1 includes access to a fully on-premises Anchore Feed Service, which gives users the ability to control the access and update frequency of external vulnerability data. With the inclusion of this service, users can deploy Anchore Enterprise in an air-gapped (limited/manual access to the Internet) environment, to fully support deployments running with strict data provenance and access requirements. The Anchore Feed Service includes:

  • Ability to enable air-gapped installations of Anchore
  • API that is accessible to Anchore Engine seamlessly, for transferring vulnerability and other external data sources
  • API for monitoring the operation of the Feed Service itself

With Anchore Enterprise 1.1, available immediately, we aim to provide organizations who have already deployed a container-based environment, groups in the process of migrating to containers now, and teams planning for the future with a suite of tools and services that provide automated enforcement of security, compliance and best-practice policies, integrated directly in the build process or anywhere container images exist. We sincerely hope you enjoy our latest release, and look forward to working with you!

For more information on requesting a trial, or getting started with Anchore Enterprise 1.1, go to anchore.com/enterprise or click the button below:

Try our enterprise-ready security and compliance platform today.

Integrate Anchore Scanning into Jenkins Pipeline

This blog highlights one of the ways in which Anchore plugin can be integrated in a Jenkins Pipeline. The example is based on a simple Node application in a Docker container. A Jenkinsfile defines the Pipeline project used for building the Docker image with the application and running tests (this can be the CI process that triggers off of commits to a code repository). This example introduces Anchore scanning as one of the stages in the Jenkinsfile. The Analyze stage uses the Anchore plugin to submit the Docker image to an Anchore Engine installation for analysis. The analysis and resulting policy evaluation determine the overall status of the Jenkins build which in turn may be helpful in the decision making process in subsequent steps (such as promote build for deployment if the build passes or fix the issues and retry if the build fails). All the code used for this example can be found here on GitHub.

Let’s get started

Before going any further, make sure that you have access to an Anchore Engine installation.

Installation

If you have a Jenkins instance with Blue Ocean, Pipeline, Docker and Anchore Container Image Scanner plugins installed skip to Setup Pipeline Project. Otherwise, continue reading

Install and Configure Jenkins

This example runs Jenkins in a Docker container. It employs jenkinsci/blueocean Docker image since the image contains the current LTS release of Jenkins along with most of the required plugins (Blue Ocean, Pipeline and Docker). Docker must be installed on your operating system before you can start using it. For more information about prerequisites and installation options refer to the official docs on Jenkins.

$ docker run -u root -d --name jenkins -p 8080:8080 -p 50000:50000 -v /var/run/docker.sock:/var/run/docker.sock -v jenkins-data:/var/jenkins_home jenkinsci/blueocean

Follow the steps in https://jenkins.io/doc/book/installing/#setup-wizard to access the Jenkins instance and complete the setup

Install Anchore Container Image Scanner Plugin

Go to Manage Jenkins->Plugin Manager->available tab, search and select Anchore Container Image Scanner, click Download now and install after restart.

Select Restart checkbox to restart Jenkins instance and activate the plugin

Setup Pipeline Project

This section assumes that you have a Jenkins instance running with Blue Ocean, Pipeline, Docker and Anchore Container Image Scanner plugins installed

Login to the Jenkins classic UI and access the Blue Ocean UI by clicking Open Blue Ocean on the left

If your Jenkins instance is new or has no Pipeline projects, then Blue Ocean UI displays a Welcome to Jenkins box with a Create a new Pipeline button. Click the button to start the Pipeline project. If the Blue Ocean UI displays a dashboard view with existing Pipeline projects, click the New Pipeline button on the top right corner.

Select Git from the list of code repositories and enter “https://github.com/nightfurys/anchore-jenkins-example” for the Repository URL. Credentials are optional. Click Create Pipeline

Note: The Pipeline project can also be configured to scan and poll a GitHub repository for commits. For instructions, refer to Jenkins.

This should start up a new job that immediately transitions to a paused state

The Pipeline pauses and waits for interactive input, click anywhere on the paused row to navigate to the Configure stage of the Pipeline

To provide the configuration, click Resolve Input and enter the requested input. Enter the details for the Docker registry and repository of your choice for staging the images. Create the credentials to the Docker registry and Anchore Engine. Click Proceed

The Blue Ocean UI displays stages that have completed and the current stage in progress. While waiting on analysis to complete, you can click the dropdown button adjacent to the step to expand details

In this example, the Analyze stage uses Anchore plugin for scanning the Docker container image. At the time of analyzing this Docker image, Anchore Engine issued a policy evaluation report with a “fail” end result due to the policy in play (which contains a rule that triggers upon finding high severity CVEs in the Docker container image). As a result, Anchore plugin fails the Jenkins build indicated by the Blue Ocean interface turning red

Follow Up

Policy bundles must be created/managed in Anchore Engine, independent of Jenkins.

Anchore plugin is configurable and allows the user to supply a Policy Bundle ID to be used by Anchore Engine on policy evaluations. The plugin can also be configured to not fail the Jenkins build on policy evaluation failure if necessary. Pipeline Syntax/Snippet Generator tool is a good way to explore plugin options and tune them according to your requirements

Anchore plugin generates reports that are accessible only from the classic Jenkins UI. Exit the Blue Ocean view by clicking the Go to classic icon at the top right corner

Navigate to the build page in the classic UI and look for the Anchore Report icon. Clicking the link should display the Anchore report with Policy and Security tabs

Policy Evaluation Summary and Report

Vulnerabilities List

Conclusion

You’ve just used Anchore Container Image Scanner plugin in a stage defined in the Jenkinsfile. The Pipeline project defined by this Jenkinsfile builds the Docker image with the application and scans the image using Anchore plugin

Jenkinsfile for this Pipeline project along with the Node application is on GitHub. You can try out this example as it is without forking the repository. If you are interested in tailoring this example to your use cases such as replace the Node application with your own, use predefined configuration instead of interactive input or other customizations, fork the repository and edit the Jenkinsfile and other application code

Add security and compliance to your CICD container pipeline in minutes with the Anchore Plugin for Jenkins

Updates to the Anchore Plugin for Jenkins

An update to the Anchore Container Scanner Plugin is now available through the Jenkins Plugin Manager. Version 1.0.16 adds to the existing configurability and allows the plugin to exercise a broader set of functionality offered by Anchore Engine. This version of the plugin was developed and tested against Anchore Engine version 0.2.3.


Anchore Container Scanner Plugin Version 1.0.16

  • New configuration to specify policy bundle ID for image evaluation. The policy bundle must exist on Anchore Engine in advance of the plugin usage. If left blank, Anchore Engine will use the default bundle for policy evaluation
  • New configuration to specify annotations on images submitted to Anchore Engine for analysis
  • Project level overrides for the plugin’s global settings. The plugin can be configured to use a different Anchore Engine URL, credentials or SSL verification in a given Jenkins project without impacting the global settings or other projects

  • Raw vulnerability report in addition to previously existing policy evaluation report post-completion

In addition to the new features, this update has a few improvements to the plugin operation

  • Enable/disable toggle in global settings has been deprecated. Anchore Container Scanner plugin is enabled by default
  • Improved logging reduces the verbosity of the logs in the default INFO level and makes it easier to follow the progress of the plugin operations

These updates are intended to improve the pipeline scripting usage of the plugin significantly and to keep the plugin up-to-date with the latest Anchore Engine functionality.

Add security and compliance to your CICD container pipeline in minutes with the Anchore Plugin for Jenkins

Container Security & Compliance Scanning For Codeship

This will walk through integrating Anchore scanning into a Codeship pipeline. During the first step, a Docker image will be built from a Dockerfile. Following this, during the second step Anchore will scan the image, and depending on the result of the policy evaluation, proceed to the final step. During the final step, the built image will be pushed to a Docker registry.

Prerequisites

Setup

Prior to setting up your Codeship build pipeline, an Anchore Engine service needs to be accessible from the pipeline. Typically this is on port 8228. In this example, I have an Anchore Engine service on AWS EC2 with standard configuration. I also have a Dockerfile in a Github repository that I will build an image from during the first step of the pipeline. In the final step, I will be pushing the built image to an image repository in my personal Dockerhub.

The Github repository can be referenced here.

Repository contents:

  • codeship-services.yml (Contains all services needed to run your CI/CD builds)
  • codeship-steps.yml (Contains all the steps for your CI/CD process)
  • Dockerfile
  • dockercfg.encrypted (Docker registry credentials)
  • env.encrypted (Environment variables)

For more info on using encrypted files with Jet CLI visit here.

Most typically, we advise on having a staging registry and production registry. Meaning, being able to push and pull images freely from the staging/dev registry while maintaining more control over images being pushed to the production registry. In this example, I am using the same registry for both.

I’ve added the following environment variables via the envfile:

If ANCHORE_FAIL_ON_POLICY is set to true, the pipeline will fail, and the image will not be pushed to the registry.

  • ANCHORE_CLI_URL
  • ANCHORE_CLI_USER
  • ANCHORE_CLI_PASS
  • ANCHORE_CLI_IMAGE
  • ANCHORE_RETRIES
  • ANCHORE_FAIL_ON_POLICY

The Docker registry has been configured with the dockercfg file:

{
	"auths": {
		"https://index.docker.io/v1/": {
			"auth": "anZhbGFuY2U6MjI2MTM3QGtLaw=="
		}
	},
	"HttpHeaders": {
		"User-Agent": "Docker-Client/17.10.0-ce (linux)"
	}
}

Build Image

In the first step of the pipeline, we build a Docker image from a Dockerfile as defined in our codeship-steps.yml:

- name: imagebuildstep
  service: imagebuild
  type: push
  image_name: jvalance/sampledockerfiles
  encrypted_dockercfg_path: dockercfg.encrypted

and our codeship-services.yml:

imagebuild:
  build:
    dockerfile: Dockerfile
  cached: true

Conduct Anchore Scan

In the second step of the pipeline, we scan the built image with Anchore as defined in our codeship-steps.yml:

- name: anchorestep
  service: anchorescan
  command: sh -c 'echo "Adding image to Anchore engine" && 
    anchore-cli image add $ANCHORE_IMAGE_SCAN &&
    echo "Waiting for image analysis to complete" &&
    counter=0 && while (! (anchore-cli image get $ANCHORE_IMAGE_SCAN | grep 'Status: analyzed') ) ; do echo -n "." ; sleep 10 ; if  ; then echo " Timeout waiting for analysis" ; exit 1 ; fi ; counter=$(($counter+1)) ; done &&
    echo "Analysis complete" &&
    if  ; then anchore-cli evaluate check $ANCHORE_IMAGE_SCAN  ; fi'
  encrypted_env_file: env.encrypted

and our codeship-services.yml:

anchorescan:
  image: anchore/engine-cli:latest
  encrypted_env_file: env.encrypted

Depending on the output of the policy evaluation, the pipeline may or may not fail. In this case, I have set ANCHORE_FAIL_ON_POLICY to true and exposed port 22. This is in violation of a policy rule, so the build will fail during this step.

Push Image

In the final step of the pipeline, we push the Docker image to a registry as defined in the codeship-steps.yml:

- name: imagepushstep
  service: imagebuild
  type: push
  image_name: jvalance/sampledockerfiles
  encrypted_dockercfg_path: dockercfg.encrypted

and our codeship-services.yml:

anchorescan:
  image: anchore/engine-cli:latest
  encrypted_env_file: env.encrypted

As a reminder, we advise having separate Docker registries for images that are being scanned with Anchore, and images that have passed an Anchore scan. For example, a registry for dev/test images, and a registry to certified, trusted, production-ready images.

Anchore & Falco, End-to-End OSS Container Security Solution

While open source solutions have historically provided the core layer of infrastructure, there have been areas in which organizations would need to look at proprietary solutions. The most notable of which is a security that had until recently remained the bastion of commercial vendors.

For container infrastructure there are typically two key security needs:

1. Image Security

Analyzing images to ensure they do not contain vulnerabilities and are in compliance with your organization’s operational and security policies.

2. Runtime Security

Real-time monitoring of containers to ensure report on or block malicious activity at the network, system or storage layers.

We have spoken at length about the first area: image security and covered how the open source Anchore Engine can quickly and easily be integrated into your CI/CD pipeline, container registries and Kubernetes infrastructure to ensure that only images that meet your organization’s policies are deployed. In this blog, we will introduce you to another open source project, Falco, from the team at Sysdig. Like Anchore Engine, Falco is open source, making it easy for organizations to download and run Falco in their environment and like Anchore there is company behind Falco that provides a commercial offering with centralized management, added features and integration.

Over the last decade, it has become clear that open source technologies provide the right foundation for infrastructure and at Anchore we believe that security and analysis tools should be open source so that anyone can inspect the code to validate that the results are fair and accurate. And since security tools typically are granted the highest level of privilege in terms of access and control of resources you need the mantra of “Trust but verify” is especially true.

With Anchore Engine, we ensure that only the right content, from known sources configured in the right way, is promoted from your CI/CD system and deployed in production but once deployed unknown vulnerabilities or misconfigurations can lead to a container being exploited. The traditional approach to security monitoring involved looking for known signatures is network traffic, files, etc. Similar to the approach taken in the early days of antivirus software where security vendors played an endless game of cat and mouse with virus authors, requiring the antivirus software to be continually updated with new signatures and new viruses were detected in the wild. Over time these solutions evolved to use heuristics in addition to signature mapping.

A similar technique is used by the Falco project which takes a more behavioral approach to detection. While there are many different ways that a container could be compromised all of which would need to be explicitly monitored for Falco looks at what is happening once the attacker has compromised the container allowing you to report and then block anomalous behaviors. For example, why would a reverse proxy container need to write a file into the /bin directory, why would a PostgreSQL container make an outbound network connection, why would your Redis server spawn a shell process?

Falco taps into host kernel for syscall monitoring using either a kernel module or a new approach using extended Berkley Packaged Filters (eBPF) which is available in modern kernels (see an excellent introduction to eBFG in LWN). This approach maximizes visibility into the system while minimizing overhead. Rules can be created that can monitor any activity including network access, file I/O and even interprocess communication (IPC). The Falco Wiki contains some great examples that illustrate the power of this level of integration, for example alerting when a process attempts to write into a directory containing system binaries, they even created default runtime security rules for the most popular Docker images.

With the addition of Anchore Engine and Sysdig Falco you can build an open and secure container infrastructure.

How Often are Docker Images Updated – Revisited

Refreshing the Data

Almost a year ago we looked at the frequency with which some of the most popular images in the Docker registry are updated and compared the frequency of base image (alpine, debian, etc) updates with that of popular non-OS images. We found that while updates to base images came in around once a month, non-OS images updated much more frequently – up to eight to ten updates in the case of the widely used node:latest and php:latest packages.

We learned that while all official images should follow DockerHub best practices and should, therefore, be well maintained it is clear from our historic data that many images can be updated infrequently and carry security vulnerability for many weeks. Understanding these gaps in the update is crucial to a comprehensive and container and application security policy, so we decided it was time to take a second look.

Using Anchore Cloud (anchore.io) makes it easy to check the update history of each image:

This lets us easily see the image creation date as well as the date of the most recent Anchore analysis.

The Anchore service continually polls DockerHub and when an update to a repository has detected the list of tags and images are retrieved and any new images are downloaded and analyzed. In addition, Anchore scans images on a regular cadence to ensure that the results of each scan include the latest CVEs and other known vulnerabilities.

We went ahead and pulled the data from the last 18 months for the library/debian:latest images from the database:

Our last analysis was in September of 2017 you can see that since then updates have become more infrequent. We observed in September that while a monthly cadence can seem ideal, what really matters is the timeliness of updates, particularly updates that fix new critical vulnerabilities. With updates coming less frequently (as seen above) this image becomes less likely to have rapidly addressed any issues that may have arisen.

Users of these base images need to be proactive about their own image fixes during these periods to avoid exposure. Tools like Anchore.io allow users of images to subscribe to the results of each Anchore CVE analysis, an analysis that is conducted regularly in-between image updates and well as immediately after updates occur.

Update Frequency – Most Popular Images

Let’s look at the relative update frequency across popular base images:

We see a similar pattern across the major operating system repositories. None have a fixed update schedule, and while some such as Ubuntu and Oracle Linux are consistent, repositories like Fedora and Alpine can go up to four months without an update!

As we pointed out in our previous post on this topic, these gaps do not immediately imply vulnerabilities. Lightweight operating systems like Alpine and BusyBox require less maintenance due to the relatively small number of packages and therefore potential vulnerabilities. However, if an image hasn’t been updated it is always worth analyzing and confirming the image you are using for production applications is still protected.

An encouraging pattern to look for is present in the Ubuntu and Oracle Linux update timings as well. In addition to the semi-regular monthly updates, updates are pushed at seemingly random times throughout the month. These updates each represent opportunities for the various teams to address new security concerns in a timely fashion. Anchore’s regular post-update scans serve to confirm this to be the case.

Moving on to some popular non-OS images we see a much greater update frequency. The increased complexity in the images necessitates these shortened update cycles and ideally, there is also an update that follows soon after the underlying base image is updated. This is not always the case our analysis shows that some applications are not rebuilt for several weeks or are rebuilt on top of an older base image.

Our assessment from September holds true today. While all official images should follow DockerHub best practices and be well maintained many images can be updated infrequently and carry security vulnerabilities for many weeks.

The timing of an image update can be an indicator of the health of the image, but the content of an image is even more important. Check out the Anchore Cloud to explore image contents, update timelines, and vulnerabilities as well as subscribe to the analysis of the images you use every day.

If you’d like to do this scanning on-prem, check out the open source anchore-engine.

For a great follow-up and to help understand the best course of action to take when it comes to determining how often you update the images your applications rely on, check out Just because they pushed doesn’t mean you need to pull.

The Real Difference Between CI & CD? Confidence

As an industry when we talk about DevOps we tend to lump together the terms CI and CD as if they are exactly the same thing. Looking back on our blogs and collateral, we are certainly guilty of that, but there are a number of differences between CI and CD and the implications of these differences are significant, so in this blog, we wanted to set the record straight and discuss the differences and talk about an interesting new project that promises to simplify CI and CD for Kubernetes environments.

There are three terms that we will cover:

  • Continuous Integration
  • Continuous Delivery
  • Continuous Deployment

While each of these practices shares common practices but differs in terms of scope – how far they go in terms of automation and release.

Continuous Integration (CI)

Over recent years continuous Integration has become the norm for engineering teams, where every merge to a source control repository such as git triggers and automatic build of the application which then passes through automated testing. If the build fails or if the automated testing shows regressions the commit does not get accepted into the master branch. This methodology improves the overall quality of a product by finding problems early in the cycle.

For CI to work you need extensive and robust automated testing, the successful compilation is not enough,  your application needs to be run through an extensive set of automated tests to ensure that each small, incremental change does not break existing functionality. This model requires more upfront work in writing tests alongside your code, often writing tests before code is implemented but this investment pays off in terms of quality, velocity and resources as the need for long manual QA cycles is drastically reduced. Automated testing should be quick so a developer can address issues rapidly and then get to work on the next test, bugfix or feature.

In most of our users’ deployments we see the Anchore scan happening after a container is built and before automated testing. This allows any security and compliance issues to be flagged before automated testing to save time and resources – there is no point testing an application that will be failed due to security and compliance issues later. Some users run Anchore after automated testing as they argue that there’s no point running a security and compliance test on broken code. Anchore is flexible to be run in either model, we would recommend that you run the shortest tests first, whether that is Anchore or your automated test suite.

Continuous Delivery (CD)

Continuous Delivery builds on top of the CI process.

There is no deliverable produced as part of the CI process, the result of CI is a well-tested codebase in your source control system. CD goes a step further by automating the next steps in the release process by taking all the steps necessary to prepare for a deployment such as building and packaging the application. While no code is deployed to production all the steps necessary have been performed and so the software can be released or deployed as required however the next step, the actual deployment, is manual.

When running with a CD model there is no need to deploy every build, you make the business decision when you release or promote your software. The beauty of this model is that you can deploy at any time.

Continuous Deployment

Continuous Deployment goes one step further: every commit to the source code repository for a given project is built, tested, packaged and deployed into production automatically. There are no manual steps, no final approval. If the software passes all testing then it is deployed.

While the move step from continuous delivery to continuous deployment may only involve a single click there is are huge organizational implications not least of which is the need for robust operational, monitoring and support practices. For this reason, most organizations stop at continuous delivery until they have the confidence in their infrastructure, testing and procedures.

Jenkins X

The name Jenkins is synonymous with CI/CD and in survey after survey we see their continued domination of the space. But the industry is changing rapidly with cloud deployments being the norm, organizations now deploying microservices, implementing DevOps practices and generally moving to a ‘cloud native’ philosophy. It’s fair to say that even with recent updates Jenkins is showing its age (or perhaps it’s maturity).

Recently the Jenkins community announced Jenkins X which represents the next generation of Jenkins which focuses on the cloud, more specifically on Kubernetes with built-in DevOps best practices, extensive automation and tooling. Over the years we have become used to building Dockerfiles, Jenkins files and now Helm charts and then piecing together tools to automate builds and deployment. The goal of Jenkins X is to automate this work and let developers concentrate on building applications and not infrastructure.  You can read more about Jenkins X in their project announcement blog.

This week the Jenkins X team announced the release of their add-on for the Anchore Engine.
With a single command: jx create addon anchore Anchore scanning is automatically added to your Jenkins X pipelines allowing every image built to be scanned for security vulnerabilities. You can now simply call jx get cve to produce a security vulnerability report showing the vulnerabilities in your environments.

This is just the first step in integrating security and compliance more deeply into Jenkins X, there are a number of interesting possibilities that are opened up by integrating two open source projects:

  • Policy-based scanning:
    Looking at more than just CVEs – adding support for policy checks that can include checks for secrets (keys, passwords), required packages, blacklisted packages, dockerfile best practices, etc.
  • Automating remediation
    Once Anchore has scanned an image it can continually track the policy and security status of the image. For example, if a new vulnerability has been discovered in an application that has already been built and deployed in your Kubernetes infrastructure. Anchore can send a webhook to notify Jenkins X that a vulnerability has been discovered and that a fix has been published by the operating system or library vendor. What if Jenkins X then automatically triggered a rebuild and test cycle to remediate this issue?

We’re excited to work with the Jenkins X team and encourage you to check out Jenkins X and the Anchore integration.  But you don’t need to be running Jenkins X to take advantage of Anchore’s security and compliance scanning, you can add Anchore to your existing Jenkins projects today whether you are using freestyle or pipeline syntax using our free Jenkins plugin.

Why CVE Scanning Still Isn’t Enough

On Thursday the Node Package Manager team removed a node package from the NPMJS.org registry. You can read more about the discovery in this bleepingcomputer article or on the incident reported on the npm blog. This package was found to have a malicious payload which provided a framework for a remote attacker to execute arbitrary code. While the module was removed from the NPM registry you may already have this module in your environment.

We saw something very similar last year and blogged about adding an Anchore policy to blacklist this node module to block it. You can follow the same steps to block the getcookies module today. This will stop future deployments of images with this vulnerability and allow you to scan previously created images to ensure they do not contain this malicious content.

As of today, there is no CVE published for this vulnerability in the NIST National Vulnerability Database (NVD) and since this module was not packaged by operating distributions such as Red Hat and Debian it will not appear in their custom vulnerability feeds but this can still simply be added to a custom policy check-in Anchore Cloud or Anchore Engine.

Two weeks ago we blogged about adding scanning to your container infrastructure even if you were not yet ready to consider policy checks or some form of gating in your CI/CD infrastructure. This incident provides a great example of why scanning your environment now will pay off later.

The Container Chronicle Volume 2

When we launched the Container Chronicle newsletter we planned on making this a monthly newsletter to make sure there was enough content to make it a worthwhile read while not making it too long. Well, two weeks later there was so much interesting news even before we covered the KubeCon announcements that we decided to release early.

New Month, New Releases!

Red Hat announced the release of Red Hat Enterprise Linux 7.5 which includes a number of container-related improvements including a move to fully support OverlayFS, which becomes the default storage driver for containers, replacing device-mapper. Buildah is now fully supported allowing you to build Docker and OCI compliant container images without the need for any a container runtime and more significantly without any Docker tools. If you are wondering how buildah should be pronounced then you really need to hear it from Red Hat’s Dan Walsh.

Two of the most popular Linux distributions for developers announced major releases: Fedora 28 and Ubuntu 18.04 (Bionic Beaver) which is the latest long term support release from Canonical.

Microsoft announced the general availability of Azure Container Instances (ACI) which were initially previewed in the summer of 2017, allowing users to run containers directly without worrying about the underlying host OS or creating and managing clusters.

Netflix open sourced its Titus container management platform which is built on top of Apache Mesos. While Titus is designed to be a challenger to Kubernetes in the mainstream market opening up the codebase allows the wider community to benefit from the extensive operational experience that Netflix has codified in Titus.

Digital Ocean announced an early access program for their managed Kubernetes service

The Rancher team announced the release of Rancher 2.0 which includes the Rancher Kubernetes Engine (RKE) in addition to a unified cluster management system for managing RKE, Google Kubernetes Engine, Azure Container Service and Amazon EKS from a single interface.

News from KubeCon EMEA

Over 4,300 developers and operators attend KubeCon in Copenhagen and there were a number of exciting announcements including:

Red Hat Operator Framework

The CoreOS team at Red Hat announced the release of the Operator Framework based on the operator’s concept they introduced in 2016. The Framework provides a toolkit and services to help manage and deploy Kubernetes applications at scale.

Google had a Number of Announcements 

  • gVisor a new container runtime designed to provide more isolation than containers but with less overhead than a virtual machine. Unlike The Kata Containers project (previously Intel Clear Containers) which relies on a lightweight virtualization approach, gVisor provides a userspace kernel implementation that exposes most Linux syscalls to the container.
  • The beta release of Stackdriver a Kubernetes monitoring solution that integrates metrics from native Kubernetes sources including metrics, events and logs as well as from Prometheus instrumentation.

Buoyant announced the 1.0 release of the Lingerd service mesh

Bitnami announced the 1.0 release of Kubeless, their Kubernetes-native serverless framework in addition to the 1.0 release of Kubeapps which provides a simple way to launch and manager Kubernetes applications using Helm.

Tip: Head over to the Kubeapps public hub to find a simple way to install Anchore Engine.

Driving Open Source Container Security Forward

A little over seven months ago we announced the open source Anchore Engine project and since then we have seen hundreds of organizations deploy Anchore Engine to add security and compliance to their container environments.

Most organizations build their container infrastructure with open source solutions:

  • Linux for the container host
  • Docker for container runtime
  • Jenkins for CI/CD
  • Kubernetes for orchestration
  • Prometheus for monitoring

When Anchore was formed there was an obvious gap in terms of open source container security and our goal was to fill that gap with the best in breed container scanning solution that added not just reporting but policy-based compliance. At the same time, we were working on Anchore CoreOS released the Clair project which provided an open source vulnerability scanner. We are big fans of the work CoreOS has done in the container community so we looked into that project but saw a number of gaps: firstly its focus was reporting on operating system CVEs (vulnerabilities). While CVE scanning is an important first step it is just the tip of the iceberg, container security and compliance tool should be looking at policies that cover licensing, secrets, configuration, etc. The second challenge we saw was that Clair was focused more on the registry use case which given the Clair use in the CoreOS Quay registry made perfect sense. So we built a series of tools to address container scanning and compliance from the ground up. Since then we have been glad to see more open source container security solutions come to market such as Sysdig’s Falco runtime security project.

In building the Anchore Engine our philosophy has been to keep the core engine open source and feature-complete while providing value-added services on top of the engine – for example, a user interface in addition to the AP and CLI, added enterprise integrations. A user should be able to secure their CI/CD pipeline with our open source engine without requiring a commercial product and without sharing their container and vulnerability data with third parties – everything should work on-premises for free. Of course, we are happy to sell you an enterprise offering on top of the open source solution and if you are ever not satisfied with our enterprise offering you should be able to remove the added services and roll back to the fully functional open source engine.

Roughly every month we have released an update to the open source project and this week we are proud to announce the 0.2.0 release that adds a number of interesting new features including Prometheus integration, improved Debian vulnerability reporting and a number of scalability related enhancements to allow our users to scale to handle thousands of builds a day.

Prometheus Integration

Prometheus is an open source event monitoring system with a time series database inspired by Google’s internal monitoring tools (Borgmon). Prometheus has rapidly become the de facto standard for monitoring and metrics in cloud-native environments.
Anchore Engine 0.2.0 adds support for exposing metrics for consumption by Prometheus allowing collection of metrics, reporting and monitoring of Anchore Engine.

Improved Debian CVE reporting

The Anchore Engine and the Anchore Feed service have been extended to track the Debian specific no-DSA flag that indicates that while the package version is vulnerable to a given CVE the Debian build of this package, either because of build options or environment is not vulnerable. In previous versions of the Anchore Engine whitelists were used to filter these records from policy output, with Anchore Engine 0.2.0 these CVEs will not be shown on the default CVE report nor within the policy output.

Scalability Improvements

Anchore Engine 0.2.0 includes a number of features to simplify scale-out deployments of Anchore Engine on Kubernetes, Amazon ECS and other large scale environments. Many features have been added to allow Anchore Engine to support thousands of builds a day and hundreds of thousands of images stored within the Anchore database

  • Support for running multiple core services (catalog, API, queue and policy engine). Previous releases had supported the scale-out of analyzer workers only.
  • Support for storing analysis and other data in external storage systems such as Amazon S3, Swift and clustered file systems in addition to the native database support.

You can read more about the changes in the online documentation or in the changelog on GitHub.

We are currently working on a number of exciting new features for delivery over the next couple of months including:

  • Support for matching NVD vulnerabilities in software libraries including Java, Python, Ruby and Node.JS.
  • Support for scanning nest Java archives. eg. Java JAR files stored in WAR files stored in EAR files.
  • Layer reporting – exposing image layer data in the Anchore CLI and API
  • Layer based policies – allowing policies such as “only allow images built on selected based images.”

No Excuses, Start Scanning

One of the most popular features of the Anchore Cloud service is the ability to deep dive into any container image to inspect its contents to see what files, packages and software libraries make up an image. Before I import any public image into my development environment I check out the list of security vulnerabilities in the image, if any, the policy status (does it fail basic compliance checks) and then I dig into the contents tab to see what operating system packages and libraries are in the image. I am still surprised at just how large many images are.

This content view allows you to dig into every artifact in the image – what operating system packages, what Node.JS NPM modules including details such as their license and versions as well as how they got pulled in – for example, multiple copies of the same module being pulled in as dependencies of other modules.

While this level of inspection is useful before you pull in a new public Docker image this level of detail is even more useful when applied to your own internal images.

When most people talk about container security and compliance the focus is on security vulnerabilities: “Do I have any critical or high vulnerabilities in my image.” As we have covered previously CVEs are just the tip of the iceberg and that organizations should be looking at policies that cover licensing, secrets, configuration, etc. Many organizations that we talk to see the value in policy-based compliance and are planning to implement container scanning as part of their CI/CD workflows but are not ready to make the investment required to add checkpoints and gates within their build or deployment infrastructure.

When the Equifax news broke about their massive breach caused by an unpatched Apache Struts vulnerability I think that every CIO in every organization was on the phone with their operations team and developers to ask if they had a vulnerable version of Apache Struts. While it’s simple to find out what version of a library you are running today on your servers, do you know what was run on your production cluster last week, last month, last year?

Even if you do not have the time or resources to invest in securing your CI/CD pipeline today with policies, reports and compliance checks it will take less than 10 minutes to download Anchore’s open source Engine, point it to your container registry and start it scanning. The Anchore Engine will discover new tags and images deployed to your repos, download and analyze them and maintain a history of tags and images over time. When you are ready to start putting in place policies, vulnerabilities, or gate deployments based on compliance checks you already have data at hand to help you track trends, compare images and run reports on changes over time. We find many organizations just using this data to produce detailed build summaries or changelogs.

Get started today, for free, either with Anchore’s cloud service or download and run the open source Anchore Engine on-premises today.

Welcome to the Container Chronicle

Things change rapidly in the fast fluid world of Containers, sometimes it’s hard to keep up. So we’re starting a new newsletter called The Container Chronicle to help you stay on top of everything newsworthy from Cloud to Kubernetes, Docker to DevOps, and Beyond.

We will periodically be sending out The Container Chronicle, with the first edition shipping out this morning but in case you aren’t subscribed yet we’ve included it below so you don’t miss out. If you’d like to subscribe and stay on top of important industry news fill out the form at the bottom of the page and we will make sure it hits your inbox!

March ended on a high with the release of Kubernetes 1.10 but April is already shaping up to be a busy month in the world of containers and we are only halfway through.

Docker + Java 10 = ❤️

The month began with the general availability of Java 10 which includes a number of interesting new features, the most significant of which to container users is the ability of the Java runtime to recognize memory and CPU constraints applied to the container using cgroups. Previous versions of the Java runtime were not aware of resource constraints applied to the container in which it was running, requiring manual configuration of JVM parameters. With Java 10, memory and CPU limits are automatically detected and accounted for by the JVM’s resource management.

The folks at Docker produced a great blog covering the details:

Improved Docker Container Integration with Java 10

OCI Locks in a Distribution Specification

The Open Container Initiative announced a new project to standardize the container distribution specification. The Docker Registry API specification is already the de-facto standard for distributing container images. Any time you push or pull an image, your Docker (or compatible) client is using the Docker registry API to interact with the registry.

All the major registry providers already support this API but the specification was controlled by a single vendor. While Docker has proven to be a good citizen in the open source community having a single vendor dictate standards is not conducive to cross-vendor collaboration. As happened previously with the image and runtime specification Docker has now donated the specification to the Open Container Initiative (OCI) which has adopted the standard and will continue to drive it forward. The OCI includes industry leaders such as Amazon, Docker, Google, IBM, Microsoft and Red Hat. You can read more about the announcement at The New Stack.

Canary in the Kayenta

Google and Netflix announced the Kayenta project which was jointly developed by the two companies and now licensed as an Apache 2 project under the umbrella of the Spinnaker continuous delivery platform. Kayenta is an automated canary analysis tool. The idea behind canary analysis is that you push a new release of a service or program to a small number of users. Since only a few users get the new release any problems are limited to a small subset of users and can easily be rolled back. If the release proves successful the test audience can be expanded. Unlike the original canary in a coal mine no animals are actually harmed during these test deployments.

You can read more about Kayenta on Google’s blog or on ZDNet.

Docker Embraces Kubernetes in Docker EE


Yesterday Docker announced the release of Docker Enterprise Edition 2.0 which includes support for both Docker’s own Swarm orchestration system but also adds support for Kubernetes. Docker Inc are not alone in shifting focus away from their own orchestration platform to Kubernetes, only a few short weeks ago we saw Mesosphere announce Kubernetes-as-a-service integrated with their DC/OS offering.

While Kubernetes clearly won the short-lived orchestration war, the real beneficiaries are the end-users who now can standardize on a single platform that can be deployed on public clouds, on-premises or even on a stack of Raspberry Pis. This standardization helps to drive a rich ecosystem of vendors to provide value-added solutions that can now focus on a single, open source platform.

Thanks for hanging with us in this first edition of The Container Chronicle. You’ll see us again soon (but not too soon) so keep an eye out for our next newsletter.

How to integrate Kubernetes with Anchore Engine

By integrating Anchore and Kubernetes you can ensure that only trusted and secure images are deployed and run in your Kubernetes environment

Overview

Anchore provides the ability to inspect, query, and apply policies to container images prior to deployment in your private container registry, ensuring that only images that meet your organization’s policies are deployed in your Kubernetes environment.

Anchore can be integrated with Kubernetes using admission controllers to ensure that images are validated before being launched. This ensures that images that fall out of compliance, for example, due to new security vulnerabilities discovered, can be blocked from running within your environment. Anchore can be deployed standalone or as a service running within your Kubernetes environment.

Getting Started with Integration

How to Integrate Anchore and Kubernetes

We have recently packaged the Anchore Engine as a Helm Chart to simplify deployment on Kubernetes. Now Anchore can be installed in a highly scalable environment with a single command.

Within 3 minutes you can have an Anchore Engine installed and running in your Kubernetes environment. The following guide requires:

  • A running Kubernetes Cluster
  • kubectl configured to access your Kubernetes cluster
  • Helm binary installed and available in your path

Tiller, the server side component of Helm, should be installed in your Kubernetes cluster. To installer Tiller run the following command:

$ helm init
$HELM_HOME has been configured at /home/username/.helm
Tiller (the Helm server-side component) has been installed into your Kubernetes Cluster.
⎈ Happy Helming! ⎈

If Tiller has already been installed you will receive a warning messaging that can safely be ignored.

Next we need to ensure that we have an up to date list of Helm Charts.

$ helm repo update
Hang tight while we grab the latest from your chart repositories...
...Skip local chart repository
...Successfully got an update from the "stable" chart repository
Update Complete. ⎈ Happy Helming!⎈

By default, the Anchore Engine chart will deploy an Anchore Engine container along with a PostgreSQL database container however this behavior can be overridden if you have an existing PostgreSQL service available.

In addition to the database the chart creates two deployments

  • Cores Services: The core services deployment includes the external api, notification service, kubernetes webhook, catalog and queuing service.
  • Worker: The worker service runs the image analysis and can be scaled up to handle concurrent evaluation of images.

In this example we will deploy the database, core services and a single worker. Please refer to the documentation for more sophisticated deployments including scaling worker nodes.

The installation can be completed with a single command:

$ helm install --name anchore-demo stable/anchore-engine

Read the Documentation

Read the documentation on Anchore integration with Jenkins and get started with the integration.

Jenkins + Anchore

Anchore has been designed to plug seamlessly into your container-based CI/CD pipeline to add analytics, compliance and governance to your workflow.

Overview

Using Anchore’s freely available and open source Jenkins plugin you can secure your Jenkins CI/CD pipeline in less than 30 minutes.

By adding image scanning, including not just CVE based security scans but policy-based scans that can include checks around security, compliance and operational best practices, you can ensure only trusted vetted container images make it into production with Anchore.

Getting Started with the Integration

How to integrate Anchore and Jenkins

Anchore has published a plugin for Jenkins which, along with Anchore’s open source engine or Enterprise offering, allows container analysis and governance to be added quickly into the CI/CD process.

The following guide will allow you to add image scanning and analysis into your CI/CD process in less time than it has already taken to read this blog post!

Requirements

This guide presumes the following prerequisites have been met:

– Jenkins 2.x running on a virtual machine or physical server
– Each Jenkins node should have Docker 1.10 or higher installed.
– Anchore’s Jenkins plugin can work with single node installations or installations with multiple worker nodes.

Notes

– Docker should be configured to allow the Jenkins user to run Docker commands either directly or through the use of sudo.
– For most platforms you can simply add the Jenkins user to the docker group in /etc/group.
– For Red Hat based systems using Red Hat’s Docker distribution rather than Docker Inc. then typically the use of sudo is required.
– To use sudo ensure that the Jenkins user is part of the wheel group in /etc/group and ensure that requiretty is not set in /etc/sudoers.

Read the Documentation

Read the documentation on Anchore integration with Jenkins and get started with the integration.

Installing Anchore with a Single Command Using Helm

Helm is the package manager for Kubernetes, inspired by packaged managers such as homebrem, yum, npm and apt. Applications are packaged in Charts which are a collection of files that contain the definition and configuration of resources to be deployed to a Kubernetes cluster. Helm was created by Deis who donated the project to the Cloud Native Computing Foundation (CNCF).

Helm makes it simple to package and deploy applications to be deployed including versioning. upgrade and rollback of applications. Helm does not replace Docker images, in fact, docker images are deployed by Helm into a Kubernetes cluster.

Helm is comprised of two components a server-side service running on the Kubernetes cluster called Tiller and the client-side component, Helm. Using helm applications, packaged as charts, can be deployed and managed using a single command:

$ helm install myApp

We have recently packaged the Anchore Engine as a Helm Chart to simplify deployment on Kubernetes. Now Anchore can be installed in a highly scalable environment with a single command.

Within 3 minutes you can have an Anchore Engine installed and running in your Kubernetes environment. The following guide requires:

  • A running Kubernetes Cluster
  • kubectl configured to access your Kubernetes cluster
  • Helm binary installed and available in your path

Tiller, the server-side component of Helm, should be installed in your Kubernetes cluster. To installer Tiller run the following command:

$ helm init
$HELM_HOME has been configured at /home/username/.helm
Tiller (the Helm server-side component) has been installed into your Kubernetes Cluster.
⎈ Happy Helming! ⎈

If Tiller has already been installed you will receive a warning messaging that can safely be ignored.

Next, we need to ensure that we have an up to date list of Helm Charts.

$ helm repo update
Hang tight while we grab the latest from your chart repositories...
...Skip local chart repository
...Successfully got an update from the "stable" chart repository
Update Complete. ⎈ Happy Helming!⎈

By default, the Anchore Engine chart will deploy an Anchore Engine container along with a PostgreSQL database container however this behavior can be overridden if you have an existing PostgreSQL service available.

In addition to the database, the chart creates two deployments

  • Cores Services: The core services deployment includes the external API, notification service, Kubernetes webhook, catalog and queuing service.
  • Worker: The worker service runs the image analysis and can be scaled up to handle the concurrent evaluation of images.

In this example, we will deploy the database, core services and a single worker. Please refer to the documentation for more sophisticated deployments including scaling worker nodes.

The installation can be completed with a single command:

$ helm install --name anchore-demo stable/anchore-engine

If there server-side component, Tiller, is not installed you will see the following error message:
Error: could not find tiller

You may wish to configure Anchore Engine to synchronize policies from the Anchore Cloud service, allowing you to use the free graphical policy editor to build policies, whitelists and map these to your own repositories and images.

If you have not already created an account on the Anchore Cloud you can sign up for free at anchore.io/signup

We can pass your username and password to the Helm chart in either by using command line options or by creating a values.yaml file containing these parameters.

In the following example, the anchore.io username and password are being passed using command line options.

Note: In addition to passing your authentication credentials we also need to enable synchronization of policy bundles and disable anonymous access.

$ helm install --name anchore-demo stable/anchore-engine 
       --set coreConfig.policyBundleSyncEnabled=True 
       --set globalConfig.users.admin.anchoreIOCredentials.useAnonymous=False 
       --set globalConfig.users.admin.anchoreIOCredentials.user=[email protected] 
       --set globalConfig.users.admin.anchoreIOCredentials.password=verysecret

Alternatively, the updated values file can be passed as a parameter to the installation.

$ helm install --name anchore-demo stable/anchore-engine --values=values.yaml

In both examples the –name parameter is optional and if omitted a name will be randomly assigned to your deployment.

The Helm installation should complete in a matter of seconds after which time it will output details of the deployed resources showing the secrets, configMaps, volumes, services, deployments and pods that have been created.

In addition, some further help text providing URLs and a quick start will be displayed.

Running helm list (or helm ls) will show your deployment

$ helm ls
NAME         REVISION UPDATED           STATUS   CHART                NAMESPACE
anchore-demo 1 Wed Jan 20 10:46:10 2018 DEPLOYED anchore-engine-0.1.0 default

We can use kubectl to show the deployments on the Kubernetes cluster.

$ kubectl get deployments
NAME                                DESIRED CURRENT UP-TO-DATE AVAILABLE AGE
anchore-demo-anchore-engine-core    1       1       1          0         1m
anchore-demo-anchore-engine-worker  1       1       1          1         1m
anchore-demo-postgresql             1       1       1          1         1m

When the engine is started for the first time it will perform a full synchronization of feed data, including CVE vulnerability data. This first sync may last for several minutes during which time the service will be responsive but will queue up images for analysis pending successful completion of the feed sync.

The Anchore Engine exposes a REST API however the easiest way to interact with the Anchore Engine is through the Anchore CLI which can be installed using Python PiP.

$ pip install anchorecli

Documentation for installing the CLI on Mac, Linux and Windows can be found in the wiki.

The Anchore CLI can be configured using command line options, environment variables or a configuration file. See the getting started wiki for details.

In this example, we will use environment variables.

ANCHORE_CLI_USER=admin
ANCHORE_CLI_PASS=foobar

The password can be retrieved from Kubernetes by accessing the secrets passed to the container.

ANCHORE_CLI_PASS=$(kubectl get secret --namespace default anchore-demo-anchore-engine -o jsonpath="{.data.adminPassword}" | base64 --decode; echo)

Note: The deployment name in this example, anchore-demo-anchore-engine, was retrieved from the output of the helm installation or helm status command.

The helm installation or status command will also show the Anchore Engine URL, for example:

ANCHORE_CLI_URL=http://anchore-demo-anchore-engine.default.svc.cluster.local:8228/v1/

To provide external access you can use kubectl to expose the external API port, 8228 to the internet.

$ kubectl expose deployment anchore-demo-anchore-engine-core 
       --type=LoadBalancer 
       --name=anchore-engine 
       --port=8228

service “anchore-engine” exposed

The external IP can be retrieved from the Kubernetes cluster using the get service call:

$ kubectl get service anchore-engine

NAME           CLUSTER-IP   EXTERNAL-IP PORT(S)        AGE
anchore-engine 10.27.245.63 <pending>   8228:31622/TCP 22s

If the external IP is shown as pending then try re-running the command after a minute.

$ kubectl get service anchore-engine

NAME           CLUSTER-IP   EXTERNAL-IP    PORT(S)        AGE
anchore-engine 10.27.245.63 35.186.160.168 8228:31622/TCP 49s

In this example the Anchore URL should be set to:

ANCHORE_CLI_URL=http://35.186.160.168:8228/v1

Now you can use the Anchore CLI to analyze and report on images.

For example:

To view the status of the Anchore Engine:

$ anchore-cli system status

To add an image to be analyzed:

$ anchore-cli image add docker.io/library/alpine:latest

To list images:

$ anchore-cli image list

To list CVEs found in an image:

$ anchore-cli image vuln library/alpine:latest os

You can follow the Getting Started Guide to learn more about using the Anchore Engine including adding subscriptions, evaluating policies and inspecting images.

Handling False Positives

If like me you’re subscribed to receive updates for popular base images such as CentOS, then this morning you may have received an email like this from Anchore:

Here, you are receiving a warning that a new, HIGH severity CVE was just found in the CentOS image. You can read more about the vulnerability in Red Hat’s security advisory RHSA-2018:0102 which covers the impact of CVE-2017-3145 on the BIND DNS package.

As you can see from reading the advisory, an attacker could “potentially use this flaw to make named, acting as a DNSSEC validating resolver, exit unexpectedly … via a specially crafted DNS request.”

However the base CentOS image does not include the BIND DNS package, but it does include the bind-license package which contains a single text file container copyright information for BIND. While the security advisory lists all bind-* packages the copyright license file can obviously not be exploited by a specially crafted DNS request!

While this CVE can safely be ignored in the security vulnerability page for library/centos:latest or any images built from this base image it is likely that your policy checks will fail this image due to the High Severity vulnerability.

In my environment, I use the Global Whitelist feature for this very reason. It allows me to add an exception to ensure that the RHSA-2018:0102 vulnerability does not incorrectly block my CentOS or RHEL images.

In the screenshot below you can see that I have whitelisted RHSA-2018:0102 and in the package field I have specified the bind-license package to ensure that we only whitelist this package and not a binary package that is actually exploitable.

Using the free Anchore Cloud service you can receive notifications for image updates, paid subscribers receive policy and CVE updates such as the one covered by this blog.

Scanning Images on Amazon Elastic Container Registry (ECR)

The Anchore Engine supports analyzing images from any Docker V2 compatible registry however when accessing an Amazon ECR registry extra steps must be taken to handle Amazon Web Services authentication.

The Anchore Engine will attempt to download images from any registry without requiring further configuration. For example, running the following command:

$ anchore-cli image add prod.example.com/myapp/foo:latest

This would instruct the Anchore Engine to download the myapp/foo:latest image from the prod.example.com registry. Unless otherwise configured the Anchore Engine will try to pull the image from the registry without authentication.

In the following example, we fail to add an image for analysis due to an error.

$ anchore-cli image add prod.example.com/myapp/bar:latest
Error: image cannot be found/fetched from registry
HTTP Code: 404

In many cases it is not possible to distinguish between an image that does not exist and an image that you are not authorized to access since many registries do not wish to disclose the existence of private resources to unauthenticated users.

The Anchore Engine can store credentials used to access your private registries.

Running the following command lists the defined registries.

$ anchore-cli registry list

Registry                                                User            
docker.io                                               anchore
quay.io                                                 anchore
registry.example.com                                    johndoe
123456789012.dkr.ecr.us-east-1.amazonaws.com            ABC

Here we can see that 4 registries have been defined. When pulling an image the Anchore Engine checks to see if any credentials have been defined for the registry, if none are present then the Anchore Engine will attempt to pull images without authentication but if a registry is defined then all access of metadata or pulls for images from that registry will use the specified username and password.

Registries can be added using the following syntax:

$ anchore-cli registry add REGISTRY USERNAME PASSWORD

The REGISTRY parameter should include the fully qualified hostname and port number of the registry. For example registry.anchore.com:5000

Amazon AWS typically uses keys instead of traditional usernames & passwords. These keys consist of an access key ID and a secret access key. While it is possible to use the aws ecr get-login command to create an access token, this will expire after 12 hours so it is not appropriate for use with Anchore Engine, otherwise, a user would need to update their registry credentials regularly. So when adding an Amazon ECR registry to Anchore Engine you should pass the aws_access_key_id and aws_secret_access_key.

For example:

$ anchore-cli registry add /
             1234567890.dkr.ecr.us-east-1.amazonaws.com /
             MY_AWS_ACCESS_KEY_ID /
             MY_AWS_SECRET_ACCESS_KEY /
             --registry-type=awsecr

The registry-type parameter instructs Anchore Engine to handle these credentials as AWS credentials rather than traditional usernames and passwords. Currently, the Anchore Engine supports two types of registry authentication standard username and password for most Docker V2 registries and Amazon ECR. In this example we specified the registry type on the command line however if this parameter is omitted then the CLI will attempt to guess the registry type from the URL which uses a standard format.

The Anchore Engine will use the AWS access key and secret access keys to generate authentication tokens to access the Amazon ECR registry, the Anchore Engine will manage regeneration of these tokens which typically expire after 12 hours.

In addition to supporting AWS access key credentials Anchore also supports the use of IAM roles for authenticating with Amazon ECR if the Anchore Engine is run on an EC2 instance.

In this case, you can configure the Anchore Engine to inherit the IAM role from the EC2 instance hosting the engine.

When launching the EC2 instance that will run the Anchore Engine you need to specify a role that includes the AmazonEC2ContainerRegistryReadOnly policy.

While this is best performed using a CloudFormation template, you can manually configure from the launch instance wizard.

Select Create new IAM role.

Under the type of trusted entity select EC2.

Ensure that the AmazonEC2ContainerRegistryReadOnly policy is selected.

Give a name to the role and add this role to the Instance you are launching.

On the running EC2 instance you can manually verify that the instance has inherited the correct role by running the following command:

#curl http://169.254.169.254/latest/meta-data/iam/info
{
 "Code" : "Success",
 "LastUpdated" : "2018-01-1218:45:12Z",
 "InstanceProfileArn" : "arn:aws:iam::123456789012:instance-profile/ECR-ReadOnly",
 "InstanceProfileId" : "ABCDEFGHIJKLMNOP”
}

By default the support for inheriting the IAM role is disabled. This can be enabled by adding the following entry to the top of the Anchore Engine config.YAML file.

allow_awsecr_iam_auto: False

When IAM support is enabled instead of passing the access key and secret access key use “awsauto” for both username and password. This will instruct the Anchore Engine to inherit the role from the underlying EC2 instance.

$ anchore-cli registry add /
               1234567890.dkr.ecr.us-east-1.amazonaws.com /
               awsauto /
               awsauto /
               --registry-type=awsecr

You can learn more about Anchore Engine and how you can scan your container images whether they are hosted on cloud-based registries such as DockerHub and Amazon ECR or on private Docker V2 compatible registries hosted on-premises.

How Many CVEs?

For most users analyzing or auditing container images usually means running a CVE scan and while that is certainly required, it should be just the first step. Anchore supports creating policies that can be used to assess the compliance of your containers, these policy checks could cover security, starting with the ubiquitous CVE scan but then going further to analyze the configuration of key security components, for example, you could have the latest version of the apache webserver but have configured the wrong set of TLS Ciphers suites leading to insecure communication. Outside of security, policies could cover application-specific configurations to comply with best practices or to enable consistency and predictability.

Today there are many tools that can perform CVE scans of a container image however when we speak to users we often hear that either they do not perform these scans or if they do they do not gate container deployments based on the results of these scans. When we asked these users why they didn’t stop their deployment based on the CVE scanner’s results, we were told “if we did then we’d not deploy any containers – they all fail!

This is a common issue, for example, if you look at the official images on Docker Hub or Docker Store for CentOS, Debian, Oracle or Ubuntu they all appear to have high or critical vulnerabilities many of which are unfixed, some appear to be CVEs that are unresolved for over a year or more.

We have covered this topic previously with respect to CentOS where we saw many vulnerabilities reported by other tools in the CentOS image that were not accurate and similar issues with Oracle and RHEL images.

It has been pointed out that Debian, which as we discussed in our previous blog, is the most popular operating system used on Docker Hub seems to have the most vulnerabilities. Regardless of the CVE scanner used, the Debian image looks insecure with many unpatched vulnerabilities, but looks can be deceptive.

We will take a look at the Debian image and discuss the results found by various scanners, explain the differences in results and show how you can remove the noise and get a clear view of the security of your containers.

Which Package is Vulnerable?

Let’s start by looking at a vulnerability reported in the latest Debian image: CVE-2017-12424 which describes a vulnerability in the shadow project which provides tools and libraries for maintaining the password database.

Looking at the output of most of the CVE scanners you will see output similar to the following:

Here we can see that shadow version 4.4-4.1 is installed and vulnerable to the critical severity CVE 2017-12424. But if you look for the shadow package in your image you will not find it.

root@debian:/# dpkg -s shadow
dpkg-query: package 'shadow' is not installed and no information is available

So if you try to upgrade that individual package you’ll receive an error.

Debian reports CVEs against source packages rather than against binary packages so in this example while the source package was shadow the binary package is called passwd.

You can look up the source package for a given binary package either using the dpkg utility or using apt-get source.

root@debian:/# dpkg -s passwd | grep Source
Source: shadow

This example using the shadow package is rather straight forward, I would expect that most readers of this article would quickly work out the mapping to the passwd binary package however in many other cases things are not so simple. For example, many non-kernel binaries are created from the Linux source package this leads to some tools reporting kernel CVEs in a container image that includes no kernel.

For this reason in the Anchore Cloud and Anchore Engine both report on the binary package not the underlying source package.

How Many Vulnerabilities?

Analyzing the same image with different scanners often results in very different numbers of reported vulnerabilities. In some cases, as we described in a previous blog, this may be a result of the scanner not taking into backporting of fixes, or not using distribution’s own security vulnerability feed. In other cases the mapping of CVE to source and image package causes confusion. For example, looking at the current debian:latest image using Anchore’s scanner we can see eight packages are shown as being vulnerable to the vulnerability described in CVE 2016-2779.

This CVE was reported against the util-linux source package. The binary packages listed in this report are all built from the util-linux source package. A tool, such as Anchore, that reports on binary packages will report seven packages against that CVE while a tool that reports on source packages may only report one. Whether one or all of these binary packages are vulnerable to the vulnerability described in the CVE is something that requires digging deeper into the bug reports and mailing list traffic. Ideally, the distributions would provide more binary specific details in the vulnerability data to assist in this mapping.
A more interesting question is: if even one of these packages was vulnerable why after nearly 18 months are fixes not available for these packages? We need to dig deeper.

Is it Really Vulnerable?

As we saw in the previous example we often see unfixed CVEs in images. For example in the current debian:latest image we see 50 vulnerabilities that have no fixes and 12 of these are rated as High severity.

Even if we just counted the number of unique CVEs, not packages, we still see: three high, three medium, one low and 15 Negligible CVEs.

Why is that number so high? Since this is the latest official Debian image there is certainly more to this, especially given the fact that the Debian security team are renowned for their focus and responsiveness.

We can start by looking at the CVE in Debian’s security tracker: CVE-2016-2779. Here you can see that the current stable version of Debian, stretch, is classified as being vulnerable, however, looking in the notes section we see the following:

The security team notes that no Debian Security Advisory will be issued for this vulnerability (no-dsa). You can read more about this on the Debian Security FAQ here, however, the concept here is that while a source package may be vulnerable the way that it is compiled or deployed may mitigate the issue. In some cases, this may be because the package is built with specific compile-time options that don’t trigger the security issue in other cases this may be due to the environment in which it is run. In this specific case, it was decided that the best approach was to address the underlying issue in the Linux kernel so that no version of this package could trigger the vulnerability.

Based on this data we should not be concerned about this high criticality CVE in our scan results. There is certainly an argument to be made that given this fact maybe this CVE should not be reported in the Debian vulnerability feed, which is the approach that the Red Hat-based distributions such as CentOS, Oracle and RHEL take. I have not looked into the history around this decision but can imagine the strong arguments to be made on both sides. Presumably anticipating this issue, the Debian team includes metadata in their vulnerability feed that indicates the No Debian Security Advisory decision and commentary. This is data we can then use as part of our analysis of the image.

Looking at the current debian:latest image using Anchore Cloud we can view the image’s policy status to see if it PASSES or FAILES based on the default image policy.

Here we can see that the image has failed, scrolling down we can see 12 High criticality vulnerabilities that led to this result. You can read more about the image policies here.

Anchore includes support for whitelists which allows for certain policy checks, such as select CVEs, to be suppressed. A CVE may be present in a package but not exploitable in that package’s configuration as we saw earlier in this blog. So using the Anchore policy editor a user can create and manage whitelists to filter out false positives.

Whitelists can be created and managed in the policy editor or from the image’s policy view but in the case of Debian security advisories it is easier to create a whitelist and upload into the Anchore Cloud.

We have published a simple utility that creates whitelists based on the data published in the Debian security tracker. You can clone this utility from our public GitHub repository.

git clone

Running the debian-whitelist.py utility will create a JSON document for each of the current Debian releases: Wheezy, Jessie, Stretch and Buster (which right now has no whitelisted CVEs).

1. Create a free account on the Anchore Cloud

2. Open the Policy editor by selecting the menu icon on the left navigation menu.

3. Expand the Whitelist editor

4. For each whitelist press the “Upload Whitelist Item” button and upload the JSON document. The whitelists will be named based on the version of Debian and the date. These names can be edited to be more user friendly.

You will now have whitelists for each Debian version.

Next, we need to use the Mapping Editor to define what whitelist is used for a specific image.

5. Expand the Mapping Editor

6. Select “Create New Mapping” to create a new mapping.

7. Give your mapping a name, eg. “Debian latest”

8. Specify library/debian as the repository name

9. Specify latest as the tag

10. Select the whitelist you created from the dropdown.

11. Select “Save All” to save the whitelist and policy mapping.

Now when you view the Debian image you will see that a user-defined policy has been used and that the image passes.

The whitelists CVEs can be viewed by checking the Show Whitelisted entries checkbox.

Currently, Anchore only applies the whitelist to the policy view and not to the list of CVEs presented in the security tab which shows all CVEs present in the image.

By using the default policy we are just performing basic CVE policy checks on the image but using the policy editor you can create policies that do much more.

Anchore Cloud 2.0

Today Anchore announced the release of Anchore Cloud 2.0 which builds on top of Anchore’s open source Engine to provide a suite of tools to allow organizations to perform a detailed analysis of container images and apply user-defined policies to ensure that containers meet the organization’s security requirements and operational best practices.

Anchore released the Anchore Navigator back in October 2017 and since then thousands of users have used the service to search for container images, perform analysis on these images and sign up to receive notifications when images were updated.

The Anchore Cloud 2.0 release adds a number of exciting new features for all users and a new paid tier which offers support and added features for subscribers.

Graphical Policy Editor

The new graphical policy editor allows all users to define their own custom policies and map which policies are used with which images. These policies can include checking for security vulnerabilities, package whitelists, blacklists, configuration files, secrets in image, manifest changes, exposed ports and many other user-defined checks. The policy editor supports CVE whitelisting – allowing a curated set of CVEs to be excluded from security vulnerability reporting.
Using the policy mapping feature, organizations can set up multiple different policies that will be used on different images based on use case. For example, the policy applied to a web-facing service may have different security and operational best practices rules than a database backend service.

Anchore policy editor view

Private Repositories

Subscribers can configure the Anchore Cloud to scan and analyze images in private repositories stored on DockerHub and Amazon EC2 Container Registry (ECR).

Once configured the service checks for changes to the repository approximately every 15 minutes. When a change is detected, for example, a new image is added to the repository or changes to tags, Anchore will download any new images, perform deep inspection and evaluate the images based on the policies defined by the user.

Anchore registries editor view

Notifications

Previously the Anchore Cloud allowed users to subscribe to a tag and be notified when that tag was updated – for example when a new debian:latest images were pushed to Docker Hub.

For subscribers, the Anchore Cloud can now alert you by email when CVEs have been added or removed from your image and when the policy status of your image has changed, for example, an image that previously passed is now failing policy evaluation.

Example of Anchore notification

On-Premises Integration

Anchore Cloud supports integration with Anchore’s open-source Engine for on-premises deployments, allowing the policies defined on Anchore Cloud service to be applied to images created and stored on-premises.

Anchore Cloud supports integration with CI/CD platforms such as Jenkins, allowing containers built in the cloud or on-premises to be scanned as part of the CI/CD workflow ensuring proper compliance prior to production deployment.

More Than Just Security Updates

In our last blog, we talked about how quickly different repos respond to updates to their base images. Any changes made by the base image will need to be implemented in the application images built on top of it, so updates to popular base images spread far and, as we saw from the last blog, quickly.

The only type of update we have covered so far in this series of blogs is security updates. However, that is only one part of the picture; package updates may contain non-security bug fixes and new features. To gain some insight into what is being changed in these updates, we have broken down exactly what packages change for a few of the more popular operating system images.

One interesting time to look at package differences is when the operating system gets updated to a new version.


Centos 7.4 overview in Anchore

Looking at the overview tab for library/centos:latest, when it just got updated to version 7.4, the Navigator shows in the chart on the righthand side that there were many changes with this update. Shown below is a breakdown of which packages have been updated since last September. Only a portion of the packages are shown, you can find the rest in the link below.

Focusing in on just that most recent update, we see that 80 of the 145 packages have been updated. The image from Sep 13th was CentOS 7.3, while the one from Sep 14th is CentOS 7.4. Looking into some of the changes, bash, like many others, received backports of bug fixes. Other packages were new additions, such as elfutils-default-yama-scope, while one, pygobject3-base, was removed from the image. In terms of CVE/Security updates, this was an ineffectual update; a quick check of the security tab of both versions (7.3, 7.4) shows that there were no changes in CVEs between the two.

Click the button below to access the full spreadsheet with all package updates for 6 popular operating systems.

View the Full Spreadsheet

In the spreadsheet, you’ll see Alpine stands out in terms of image size and reduced package count. Having more packages means having more packages to maintain. Even if Alpine were to update almost all of its 11 packages, as it did on May 25th, there would not be as many changes as a standard Debian update, such as the one on June 7th, where 25 of 81 packages were updated. There is a trend towards lightweight images, and the appeal of simpler updates might be one reason behind it. Among public repositories, Alpine is growing its share of usage as a base image. Other base operating systems are beginning to including slim versions of their containers, such as Debian, which has a slim version of each of its releases as well as Oracle and Red Hat.

Comparing the sizes of the two Debian tags included in the spreadsheet, stretch and stretch-slim, we see that the slim version is about half the size of the original, 95 MB vs 53 MB. The trend goes across releases too; Debian Stretch (Debian 9) images are around 90 MB while Jessie (Debian 8) images are around 120 MB. Ubuntu 16.04 is around 120 MB while 17.04 is around 90 MB. One repository not slimming its images is CentOS. It does not currently include slim versions, even though Red Hat Enterprise Linux, from which CentOS is based, has a slim image known as RHEL Atomic.

Part of slimming down containers is removing packages that are not necessary. In some instances, packages are included that are arguably not required in the context of a container, such as device-mapper or dracut. This harkens back to a previous blog, where we discussed how containers are often being used as micro-VMs rather than microservices. The packages listed above, among others, lend themselves to running a full machine, rather than running just a single application. Removing these extra packages is not as simple as it initially appears. For example in the CentOS 7 image dracut, which builds initramfs images to boot an OS, is pulled in as a requirement by kmod, which provides an infrastructure for kernel module loading, which is pulled in by systemd. We see many similar examples in the traditional Linux vendors’ images, where the package management system was designed before the advent of containers. This is a topic we will revisit in a future blog.

Even though smaller base images require less maintenance and storage, having fewer packages means less functionality. Most application images built on top of Alpine require that users add many more packages onto the base image so application images are often significantly larger than the 4MB base image. But having the choice to add to an image rather than working out how to remove packages certainly simplifies maintenance for the developer and allows for a reduced attack surface. In our next blog, we will look at some popular application images that are available based on multiple distributions to see how the image size, bug count and update frequencies compare.

To Update or Not to Update

In the previous blog, we presented our analysis of image update frequency for official DockerHub images and the implications for application images built on top of these base images. It was pointed out in a Reddit reply by /u/AskOnDock29 that users can update the operating system packages in the images themselves, independently of the official image and so the frequency, or infrequency, of base image updates, is not a concern since this is easily manageable by end-users. This Redditor is indeed correct, users can update operating system packages when building on top of an official or other base image. Whether this happens, in reality, is an interesting question that we will get to shortly.

When the Anchore Navigator downloads images from Docker Hub we derive the Dockerfile from metadata contained in the image. The Anchore Navigator’s Build Summary pane on the overview tab displays this information by showing the commands run in each layer of the dockerfile. Using library/msyql as an example, we see that new files and packages are added to the image however the base packages are not updated.

This is the view that the navigator gives of the mysql dockerfile. The derived Dockerfile is not identical to the Dockerfile used to construct the image, since metadata such as the name of files copied or the image that was used as a base, for example, are lost during the build. But the derived Dockerfile does include the commands used and image metadata. In this example, searching through each layer, we do not find package update instructions.

Running some quick analysis against our dataset, out of the 22,413 non-official images tagged as ‘latest’ since September of last year, 6,099 (27%) included package update commands in their Dockerfiles. Grouping by repository instead of image, 80 out of 559 (14%) non-official repositories at some point over the last year had update commands. This does not mean that all of these images have outdated packages or known CVEs since their base images may be up to date and there are other ways to include the latest packages, for example starting from scratch and adding in files and packages manually. Anchore’s dataset includes file and package manifests for all of these images so we can verify the package set to look for updates without requiring analysis of the Dockerfile.

So should a user upgrade operating system packages when they build their images? Ideally no. Docker’s best practices recommend that the user should not run apt-get upgrade or dist-upgrade within their Dockerfile, but should instead contact the maintainer of the parent image used. Minimizing package changes within the image also helps to improve the reproducibility of the build.

If there are no upgrade/update commands or manual package management, then there are two ways to keep the base image up to date: the user can update it manually, or the maintainers can push a new image whenever the base image is updated, which the user then has to use as they rebuild their image. As previously covered, the second method is preferable. Since the majority of repositories do not use upgrade commands and therefore depend on the maintainer or user updating the base image, it would be interesting to see how well repositories are at handling the responsibility and keeping up to date with base image updates.

Starting with about 10,000 public community images, we see that a new, updated image is pushed close to a week (six days and 20 hours) after an updated operating system image is made available. We have excluded the first image of each repository from the analysis since our focus is the frequency and timing of updates. The analysis does include many images that are just small side projects that served a single purpose and aren’t actively updated. At the same time, images that get updated nightly are also in there, so there is a balance.

However, looking at a number of the most popular community images offers a view into repositories that have a following and need to be maintained more actively than other images.

Here, the average time to update is just a little over five days, a good bit lower than the average for all of the images.

As mentioned earlier, no official images include update commands, so updates have to come in the form of image updates. Due to their elevated standard and visibility, these updates need to be timely; an update to the base image should be responded to quickly. We see that this is, in fact, the case; the average update times across the official images are about one day and 10 hours.

Taking a similar look into popular images, things to note are that none of these respond in longer than three days, and there is no real correlation between popularity and update times among these images. A repo like library/node takes nearly three days on average, while library/mysql takes a little over half a day. There is certainly a correlation on a larger scale – more popular images have quicker update times – but there is quite a bit of variance along the way.

To fully visualize see why these updates matter, we’ll go through the life cycle of a security flaw, RHSA-2017:1481. This flaw exploited the glibc package in Red Hat Enterprise Linux (RHEL) and could allow a user to increase their privileges. Because CentOS is compiled from RHEL sources, any images that are built on top of RHEL or CentOS carry this flaw. To focus on just one, we will be looking at jboss/wildfly, which is built on top of CentOS. Knowledge of the flaw was made public on June 19th of this year, and a fix was published by Red Hat almost immediately, with the fix for CentOS being made available on June 20th. The CentOS image was then updated to include the fix 15 days later on July 5th.

Using the security tab for that image, you can see that RHSA-2017:1481 is not present.

However, clicking on the previous image button will take you to the image that was pushed on June 5th, which was affected by the glibc flaw.

The maintainers of the jboss/wildfly image, have a really good update schedule, so a new image that implemented the fix was made available within only 50 minutes of the CentOS image being released, however since the parent image was only updated after 15 days the wildfly image was vulnerable during that period.

There are a number of key points to take away from this analysis:

  • Choose your base images carefully. Ensure that the base image you are using is well maintained. If not consider maintaining your own base image or pick a different base image to use.
  • Just because an image is official that does not mean that it is frequently updated or necessarily the best image to build from. You may other repos that have images suited to your needs.
  • Keep track of updates to the base images that you use. One method for tracking updates and receiving notifications is covered in this blog.

The frequency of updates is not the only metric to consider when looking at images; you need to know what has changed. Was the image just rebuilt based on a schedule? Or were files and packages changed? Users often focus solely on CVE (security) updates but do not consider other package updates that include bugfixes. In our next blog, we will take a deeper look into what changes in an image update.

A Look at How Often Docker Images are Updated

In our last blog, we reported on operating systems usage on Docker Hub, focusing on official base images.

Most users do not build their container image from scratch, they build on top of these base images. For example, extending an image such as library/alpine:latest with their own application content. Whenever one of these base operating system images is updated, images built on top are typically rebuilt in order to inherit the fixes included in the base image. In this blog, we will be looking at the update frequency of base images: frequency of updates, changes made and how that impacts end users.

Whenever one of these base operating system images is updated, images built on top are typically rebuilt in order to inherit the fixes included in the base image. In this blog, we will be looking at the update frequency of base images: frequency of updates, changes made and how that impacts end users.

If you want to check on the updated history of a particular image the Navigator makes that simple.

For example, looking at debian:latest, currently the most popular base operating system among official images.

Here you can see the date that the image was created and when it was analyzed by Anchore.
The Anchore service continually polls Docker Hub and when an update to a repository is detected the list of tags and images are retrieved and any new images are downloaded and analyzed. Anchore maintains a database with image and tag history so at any point in time previous versions of a Tag may be inspected. Clicking on the Previous Image button navigates to the image that was tagged library/debian:latest previously. The Next Image button is disabled because, at the time the screenshot was acquired, image ID this was the latest image tagged as library/debian:latest.

By clicking on Previous Image in the top left, you can explore the Navigator’s analysis of older images of the same tag. In this case, the previous version is only a week old, but for the most part, you will see that Debian is updated every two to five weeks.

Putting these dates onto a timeline, we see that debian:latest is updated roughly every month. Looking at the update frequency of other popular official operating system images, once a month is just about average. While this might seem ideal, what really matters is the timeliness of updates and the content of the update. For example, if a new critical vulnerability is discovered the day after the scheduled image update then a user should not wait another month for an update. Users can certainly update these images with fixes, in fact, this should be part of the due diligence that is performed in creating images, however, the content published in public registries should be secure off-the-shelf.

This timeline compares the update frequency of some major operating system repositories. Of these repos, none have a fixed update schedule. Ubuntu and Debian are pretty consistent, while the rest are quite varied. For example, CentOS sticks to about an update a month now, but before would have large gaps, up to 3 months long, between updates. On the flip side, Oracle Linux has clusters where multiple updates will come out in a short time period. What is interesting is that there are 4 that all have had 8 or 9 updates over the last year. Is that the number where exposure to security issues and pushing too many updates is balanced? Something else to consider is that having more packages means that there are more things to keep up to date, so lightweight operating systems like Alpine and BusyBox do not need as much maintenance. However, this doesn’t explain why CentOS and Fedora are updated infrequently, as they are both much larger than Debian and Ubuntu.

Moving on to popular non-OS images, the difference in update frequency is striking. NGINX, the repo with the fewest updates here, has more updates than Oracle Linux, which had the most updates of all the operating systems. Calling back to the fact that more complexity means more maintenance, this increase makes sense. In future blogs, we will dig into what is changing between image updates.

Because many of the application images are built on top of official base operating system images, in theory, they should be rebuilt when the underlying base image is updated. Sadly that is often not the case, where we will see a base operating system image be updated with a fix but the application image may not be rebuilt for several weeks and in some cases, it is rebuilt on top of an older base operating system image.

While all official images should follow Docker Hub best practices and should, therefore, be well maintained it is clear from our historic data that many images can be updated infrequently and carry security vulnerability for many weeks.

If you are trying to choose a non-official image, it is important that you look into its update history, since many images on Docker Hub are one-offs that were built by an engineer to ‘scratch an itch’ pushed to Docker Hub and never maintained. While that image may seem to have exactly what you are looking for it’s important to note that you are in effect adopting the image and you are then responsible for its care and feeding!

One last interesting piece of information is that there are a few days (10/21, 1/17, 2/28, 4/25, …) where many of the repos push updates at the same time. In many cases this occurs the day after their base image, debian:latest was updated. This backs up the idea that these images update more frequently because they have to keep up with updates of their base image.

As we alluded to earlier the content of an image update is just as, if not more, important than the timing of an update. In the next blog, we’ll dig into a more detailed timeline of updates, starting with the disclosure of a vulnerability, when the operating system vendor patched it, when that patch was included in a container image and when an application image pulled in the update.

Just Because They Pushed Doesn’t Mean You Need to Pull

While that may sound like advice your mother gave you after you got into a fight at school we are actually talking about Docker images.

Yesterday we started to notice a lot of activity on our worker nodes on anchore.io which were analyzing a large number of images that were updated on Docker Hub.

The Anchore service monitors Docker Hub looking for changes made to our customer’s private images, official images and thousands of other tags of popular images on Docker Hub.

We poll Docker Hub and when images are updated our workers pull down the new images and perform analysis and policy evaluations. Users can also subscribe to images to get notifications when images they use are updated.

Since yesterday we’ve seen over a thousand images get updated including official OS based images such as Alpine, CentOS, Debian, Oracle, and Ubuntu.

What was odd was that looking at these images we saw no changes in files or package manifests. As part of Anchore’s analysis we look at all the files in the image down to the checksum level and all the package data, this allows us to perform policy checks that go beyond the usual CVE checks that you see with most tools.

We show a brief changelog summary on the overview page for an image, showing how many files and packages were added, removed or changed.

What had us scratching our heads yesterday was the high number of images with no apparent changes. The image metadata, such as ID and Digest were changed but the underlying content was the same.

Digging deeper it appears that while with the actual content of the images has not changed, the manifests have been updated. This seems to have been driven by a change to the bashbrew utility which is used to build official images. Bashbrew now defaults to using the manifest list format which allows for multi-arch images, so even if an image has been built only for a single architecture it will now use the manifest list.

We will continue to dig into this but in the meantime, we’d recommend that you look to see what, if anything, changed in an image before you rebuild all your application images on top of a new base image.

Introducing the Anchore Engine

Today Anchore announced a new open source project that allows users to install a local copy of the powerful container analysis and policy engine that powers the Anchore Navigator service.

The Anchore Engine is an open source project that provides a centralized service for inspection, analysis and certification of container images. The Anchore Engine is provided as a Docker container image that can be run standalone or on an orchestration platform such as Kubernetes, Docker Swarm, Rancher or Amazon ECS.

Using the Anchore Engine, container images can be downloaded from Docker V2 compatible container registries, analyzed and evaluated against user-defined policies. The Anchore Engine can integrate with Anchore’s Navigator service allowing you to define policies and whitelists using a graphical editor that is automatically synchronized to the Anchore Engine.

The Anchore Engine can be integrated into CI/CD pipelines such as Jenkins to secure your CI/CD pipeline by adding image scanning including not just CVE based security scans but policy-based scans that can include checks around security, compliance and operational best practices.

The Anchore Engine can be accessed directly through a RESTful API or via the Anchore CLI. Adding an image to be analyzed is a simple one-line command:

$ anchore-cli image add docker.io/library/nginx:latest

The Anchore Engine will now download the image from the registry and perform deep inspection collecting data on packages, files, software artifacts and image metadata.

Once analyzed we can retrieve information about the image. For example, retrieving a list of packages:

$ anchore-cli image content docker.io/library/nginx:latest os

Will return a list of operating system (os) packages found in the image. In addition to operating system packages, we can retrieve details about files, Ruby GEMs and Node.JS NPMs.

$ anchore-cli image content docker.io/library/rails:latest gem
Package Version Location
actioncable 5.0.1 /usr/local/bundle/specifications/actioncable-5.0.1.gemspec
actionmailer 5.0.1 /usr/local/bundle/specifications/actionmailer-5.0.1.gemspec
actionpack 5.0.1 /usr/local/bundle/specifications/actionpack-5.0.1.gemspec
actionview 5.0.1 /usr/local/bundle/specifications/actionview-5.0.1.gemspec
activejob 5.0.1 /usr/local/bundle/specifications/activejob-5.0.1.gemspec
activemodel 5.0.1 /usr/local/bundle/specifications/activemodel-5.0.1.gemspec
activerecord 5.0.1 /usr/local/bundle/specifications/activerecord-5.0.1.gemspec
activesupport 5.0.1 /usr/local/bundle/specifications/activesupport-5.0.1.gemspec
arel 7.1.4 /usr/local/bundle/specifications/arel-7.1.4.gemspec

And if we wanted to see how many security vulnerabilities in an image you can run the following command:

$ anchore-cli image vuln docker.io/library/ubuntu:latest os
Vulnerability ID Package Severity Fix Vulnerability URL
CVE-2013-4235 login-1:4.2-3.1ubuntu5.3 Low None http://people.ubuntu.com/~ubuntu-security/cve/CVE-2013-4235
CVE-2013-4235 passwd-1:4.2-3.1ubuntu5.3 Low None http://people.ubuntu.com/~ubuntu-security/cve/CVE-2013-4235
CVE-2015-5180 libc-bin-2.23-0ubuntu9 Low None http://people.ubuntu.com/~ubuntu-security/cve/CVE-2015-5180
CVE-2015-5180 libc6-2.23-0ubuntu9 Low None http://people.ubuntu.com/~ubuntu-security/cve/CVE-2015-5180
CVE-2015-5180 multiarch-support-2.23-0ubuntu9 Low None http://people.ubuntu.com/~ubuntu-security/cve/CVE-2015-5180

As with the content sub-command we pass a parameter for the type of content we want to analyze – in this case, OS for operating system packages. Future releases will add support for non-package vulnerability data.

Next, we can evaluate the image against a policy that was defined either manually on the command line or using the Anchore Navigator

$ anchore-cli evaluate check registry.example.com/webapps/frontend:latest
Image Digest: sha256:86774cefad82967f97f3eeeef88c1b6262f9b42bc96f2ad61d6f3fdf54475ac3
Full Tag: registry.example.com/webapps/frontend:latest
Status: pass
Last Eval: 2017-09-09T18:30:22
Policy ID: 715a6056-87ab-49fb-abef-f4b4198c67bf

Here we can see that the image passed. To see the details of the evaluation you can add the –detail parameter. For example:

$ anchore-cli evaluate check registry.example.com/webapps/broker:latest --detail
Image Digest: sha256:7f97f3eeeef88c1b6262f9b42bc96f2ad61d6f3fdf54475ac354475ac
Full Tag: registry.example.com/webapps/broker:latest
Status: fail
Last Eval: 2017-09-09T17:30:22
Policy ID: 715a6056-87ab-49fb-abef-f4b4198c67bf

Gate                   Trigger              Detail                                                          Status        
DOCKERFILECHECK        NOHEALTHCHECK        Dockerfile does not contain any HEALTHCHECK instructions        warn
ANCHORESEC             VULNHIGH             HIGH Vulnerability found in package - libmount1 (CVE-2016-2779 - https://security-tracker.debian.org/tracker/CVE-2016-2779)                    stop          
ANCHORESEC             VULNHIGH             HIGH Vulnerability found in package - libncurses5 (CVE-2017-10684 - https://security-tracker.debian.org/tracker/CVE-2017-10684)                stop          
ANCHORESEC             VULNHIGH             HIGH Vulnerability found in package - libncurses5 (CVE-2017-10685 - https://security-tracker.debian.org/tracker/CVE-2017-10685)                stop

Here you can see that the broker image failed the policy evaluation due to 3 high severity vulnerabilities.

We can subscribe to an image to receive webhook notifications when an image is updated when new security vulnerabilities are found or if the image’s policy status is updated – for example going from Fail to Pass.

$ anchore-cli subscription activate image tag_update registry.example.com/webapps/broker:latest

A Breakdown of Operating Systems of Docker Hub

While containers are thought of as “micro-services” or applications, if you open up the image you will see more than just an application – more often than not, you’ll see an entire operating system image along with the application. If you dig into the image you will find that certain parts of the operating system are missing such as kernel and hardware-specific modules and often, but sadly not always, the package list is reduced. If you are deploying a pre-packaged container built by a 3rd party you may not even know what operating system has been used to build the container let alone what packages are inside.

As part of the analysis that Anchore performs on the container, it identifies the underlying operating system. To check this out go to the Anchore Navigator and search for the image that you wish to inspect. Halfway down on the overview tab you’ll see the operating system name and version listed. For example, searching for library/nginx:latest will show that it is built on top of Debian 9, Stretch.

nginx

Let’s take a look at what operating systems are used on Docker Hub:

  • Which operating system gets used the most?
  • How has the choice of operating system changed over time?
  • Are there different usage patterns for official images compared to public images?

To get our toes wet, here is the breakdown of what operating systems official images are being built on.

It is clear that Debian is the most popular, with Alpine taking second place, and then a number of others each taking a smaller share. Raspbian will also be analyzed even though it doesn’t appear in this chart, because it is not used as a base OS by any official images. When looking at public images’ usage of operating systems, we will see that Raspbian gets used a fair bit. These make up the 7 most popular operating systems amongst Docker repositories, with all others taking up a little less than 2% of the share, so they will be excluded to keep things uncluttered. A notable exclusion here is Red Hat Enterprise Linux. The license agreement prohibits redistribution, which is likely why we see CentOS but no RHEL in the list of official images however, our data shows many public RHEL images from users.

The repositories that are included in our dataset are those that have been analyzed by Anchore. This means all official repos, the most popular (based on a combination of pulls and stars) public community repos, and user-requested images. Right now Anchore is pulling data only from Docker Hub, but soon we will be expanding to includes images on Amazon EC2 Container Registry (Amazon ECR).

From these repositories, we looked at only the latest tag so that the information was pulled from tags that were being consistently updated. Also, different repositories have different update schedules; where one will push updates every other month, another might update every week. If we counted each update, it would skew results towards operating systems that have a couple of repositories that update multiple times a day. For this reason, we only counted a repository’s use of an operating system on its latest tag once, unless it switched to a different operating system later on.

Something else to note is the “Unknown” on the chart. If you look at library/swarm:latest, for example, you will see that the operating system is listed as “Unknown.” What this means is that swarm doesn’t have a standard operating system install and so the system cannot recognize what it is built on top of. Images like these are often statically compiled binaries, and so don’t require anything extra beyond what’s needed to run the application. With Docker’s recent improvements to multi-stage builds, binaries might see a rise in the near future as developers become more familiar with the process and greatly decrease their file size.
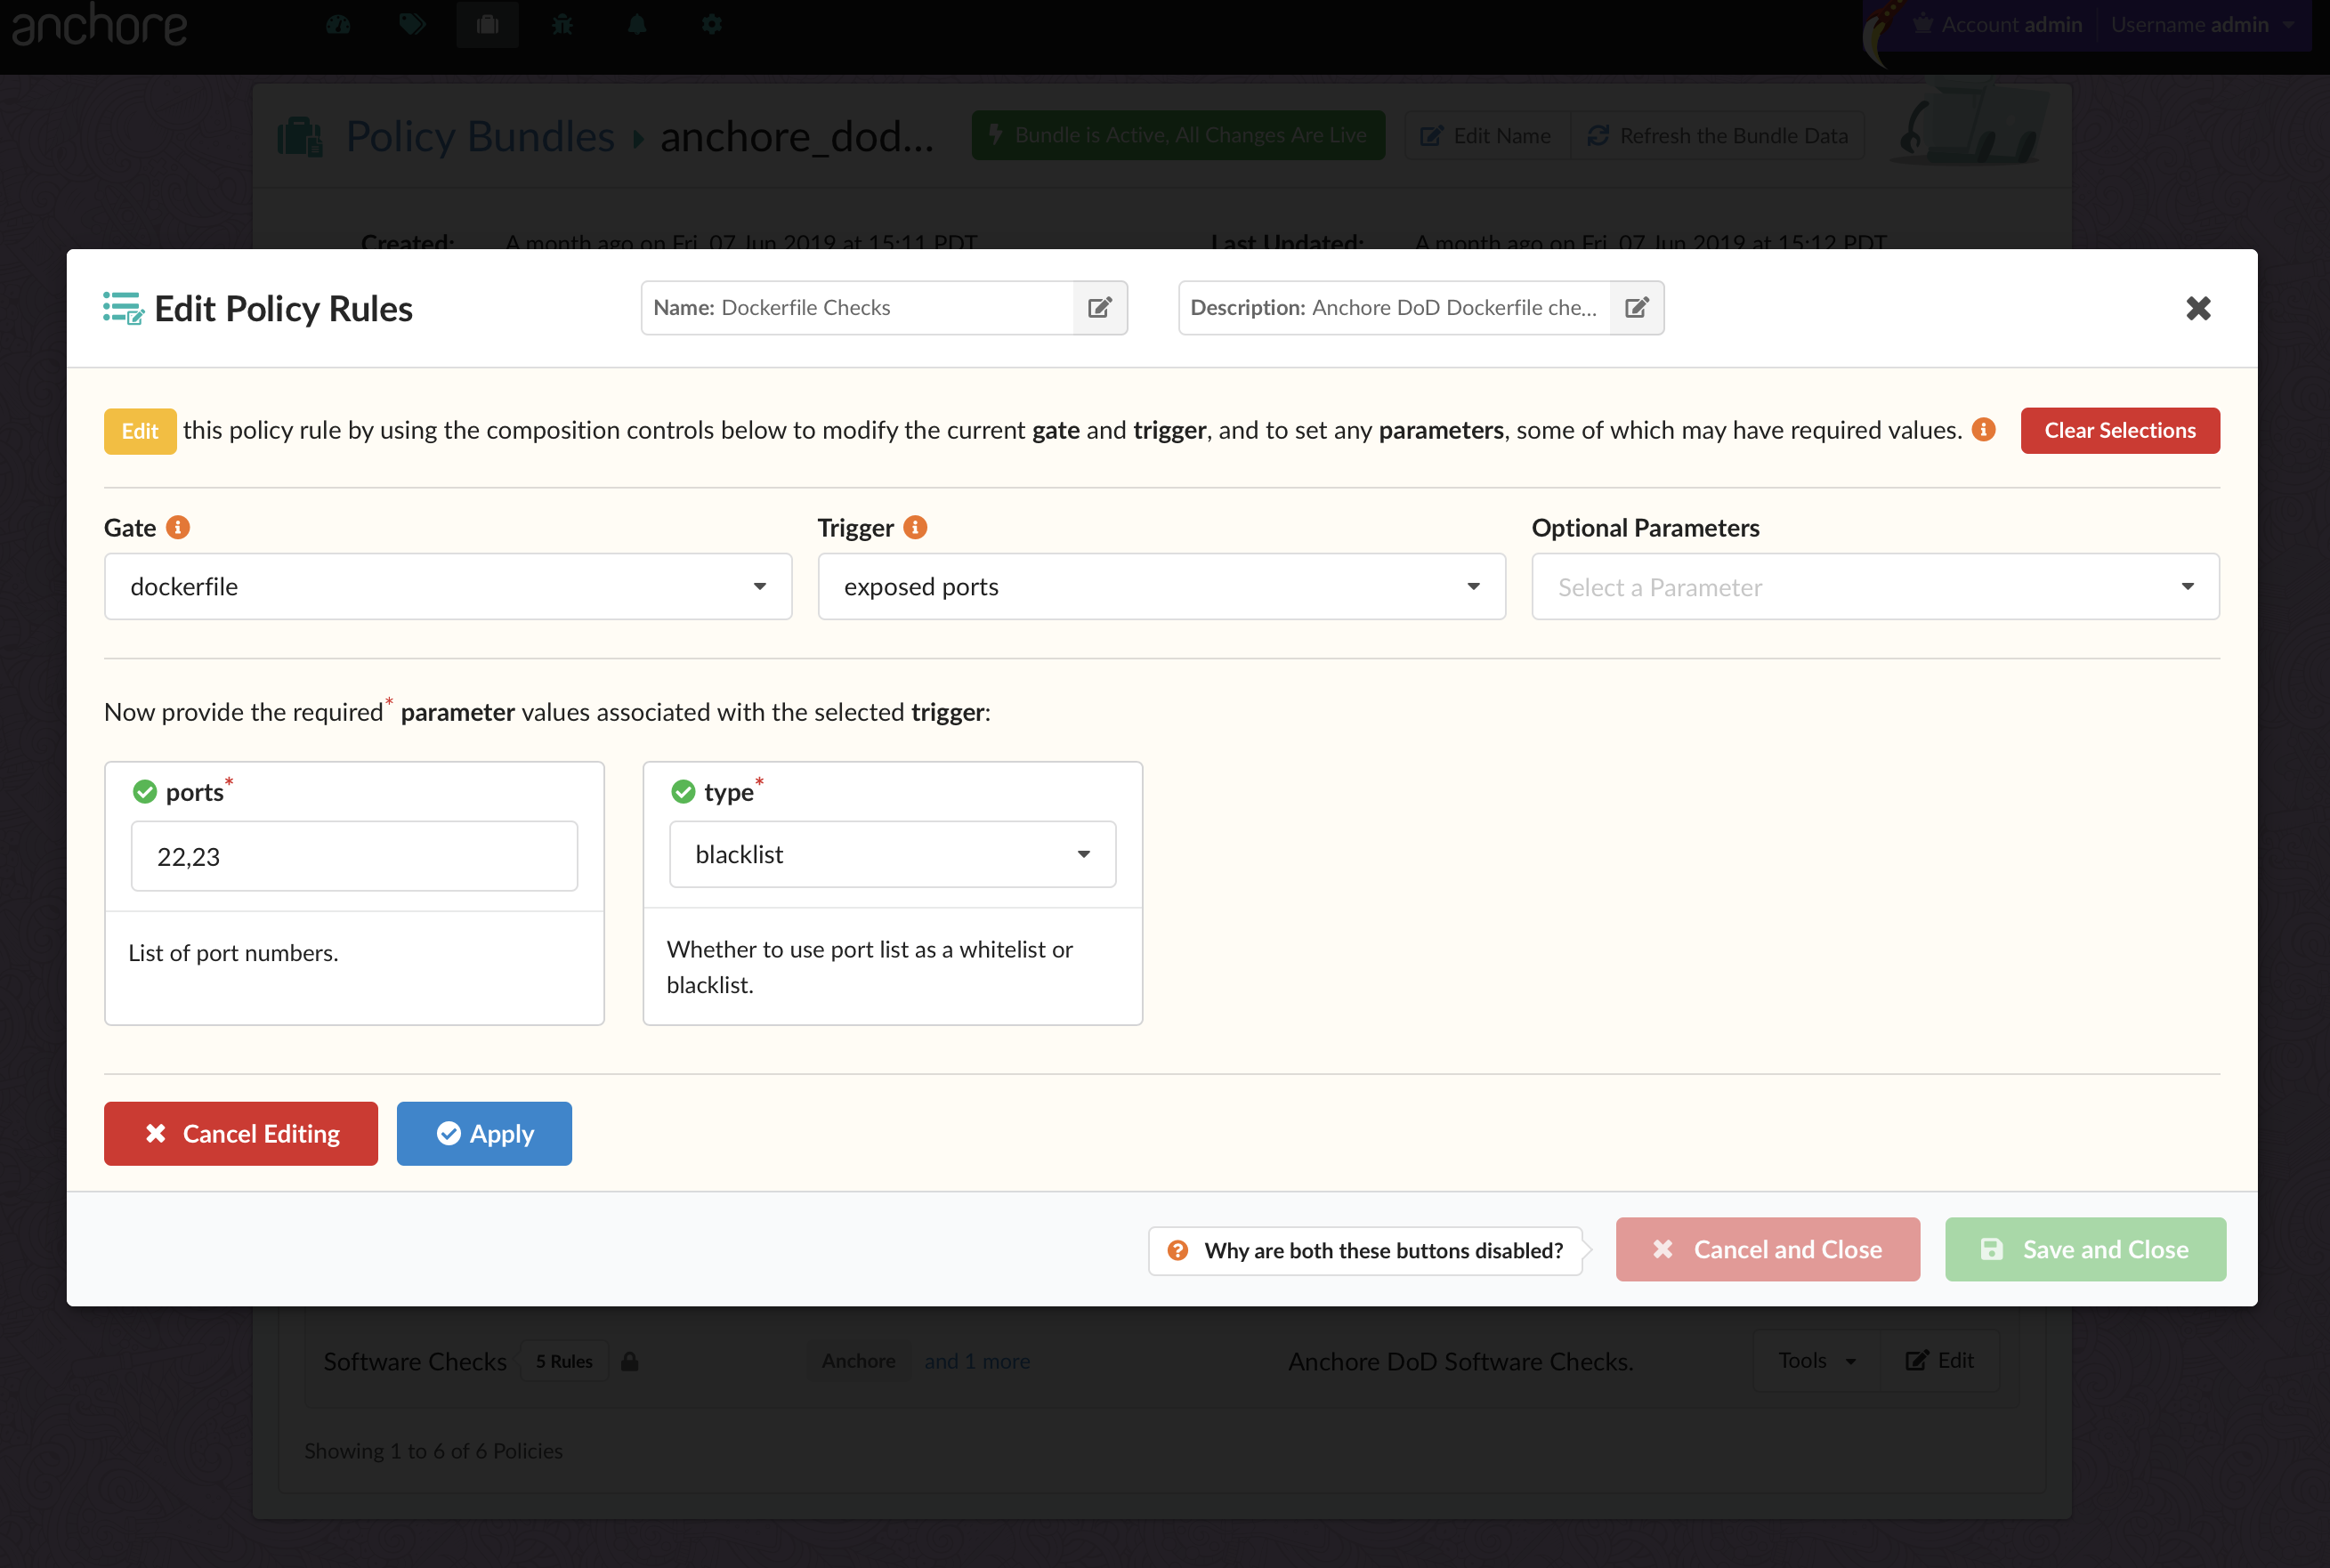
Image size is often used as a criteria for the selection of base images so we performed some quick analysis to see the average size of official images broken down by the operating system distribution.

To get some context, here are the sizes of the images of popular operating systems.

The difference in image size is striking: the range goes from BusyBox at 1MB all the way up to Fedora at 230MB. It’s interesting to see the clustering happening. Alpine and BusyBox are lightweight and right near 0MB, then the midweights like Debian and Ubuntu are around 100MB, and the largest are heavyweights such as CentOS and Oracle Linux up by 200MB.

Shown here is the size of official images split by what underlying OS it uses. Do note that the OS image is not excluded from the average, so for lesser-used operating systems, the average is brought down.

You can see that as application images are built on top of these base images their size grows as dependencies are added. For example, adding required runtimes such as Python or Java.

The pie chart above showing official OS distribution only covers the creation of images in the last three months, but our data extends further back.

Taking a look at the distribution of operating systems over the course of the past year, we see that Debian has always held its popularity among official repositories. It had a peak of over 80% back in February, and since then appears to have been ever so slowly tailing off. It looks like Alpine is gradually growing, but it is difficult to see any sure trends due to the fluctuation of the data, especially during the summer months which are traditionally slower. We will continue to monitor and report on this trend.

Digging more into Debian’s two-thirds share, we can look at the distribution of versions of Debian. Debian 8, Jessie, has held near 100% of the share until July amongst official images, with only a small number of images being built on Wheezy (7) and Stretch (9). This, of course, makes sense as Debian 9 was only released halfway through June, and has since been adopted by more than a third of images and growing. Before its stable release, a few repositories were using the unstable release, presumably favoring new features enough to make the jump ahead of everyone else.

Docker Hub official repositories make up only a small number of the total repositories on DockerHub. They follow best practices, are often base images that users build their own apps on top of, and are updated frequently. These standards don’t apply to community images. However, the most popular ones – those that we analyze – only just don’t make that mark. Despite that, there are quite a few differences in operating system usage between the community and official images.

Debian still holds the largest share, but only just. Both Alpine and Ubuntu see their percentage nearly double, with raspbian emerging and taking a small percentage, focused on IoT use cases. Ubuntu’s popularity might be explained by the fact that it is the most commonly used Linux distribution by users, and people like to work with something they are familiar with especially as they learn new technology. For Alpine, it’s possible that community repos are quicker to change tech quicker, and the appeal of the security and tiny size of Alpine is pulling more developers towards it.

To counter that willingness to change, Stretch doesn’t see as much adoption amongst community images as official ones, getting about half as much usage. What is interesting, however, is that unstable Stretch received more usage here than among official images, which may come from some users experimenting with it to see new features.

The graph of community operating system usage over time is much more interesting than the graph for official images, as there are a few trends to see. At the end of 2016, the distribution of operating systems was much more spread. Although Debian was leading then, it had a smaller share than it does now. Starting in February we saw a reduction in the usage of Ubuntu, and now it only has half of the usage of the leaders. Alpine started growing shortly after to take Ubuntu’s place at the top, joining Debian. The other four operating systems all have steadily tailed off, as developers choose to use one of the main three. Going forward, it will be interesting to see if Ubuntu’s recent uptick will continue at the expense of Debian.

Official images are typically smaller than public images since they are used as a foundation to build an application image. However, Alpine contradicts this trend, and public images using it are half the size of official images on average.

In our next blog, we will dig deeper into updates – looking at how frequently images are updated and the relationship between operating system patches, base image patches and updates to end-user images.

Scanning for Malicious Content

Ivan Akulov just published a rather worrying blog entitled Malicious Packages in NPM in which he documents a recent discovery of several malicious NPM packages that were copies of existing packages with similar names which, while they contained the same functionality, also included malicious code that would collect and exfiltrate environment variables from your system in the hope of finding sensitive information such as authentication tokens.

In the past, a developer would either write a software library or purchase a library from a software vendor. Today you can pick a free, open source library off-the-shelf from one of many different registries, each catering to a different community: NuGet for .NET developers, CPAN for Perl developers, RubyGems.org for Ruby developers, npmjs.org for Node.js developers, PyPi for Python developers, maven.org, etc.

This move to open source and community-focused development has helped drive the rapid pace of innovation that we’ve seen over the last 10 to 15 years. But as this story shows us, free software doesn’t come without a cost! Just because a piece of software is free that doesn’t mean that you shouldn’t perform the same level of due diligence in assessing the software as you would if you had to pay for it: where is the software coming from? how well is it maintained? how is it licensed? This process should not discourage the adoption of open source however it should ensure that you know what open source components you have, where they came from and how to support them internally.

The best approach is to start this process as early in the development cycle as possible, putting in place a process to screen software and libraries before they enter your ‘supply chain’. There are many tools that can help in this regard and the newer generation of tools from other vendors are designed with this new open source software paradigm in mind.
But no matter what tools and policies you have in place there will always be something that slips through the cracks, so it’s good to have a final check that you can put in place to ensure that software you deploy meets your compliance and operational best practices. And this is where Anchore comes in.

One of the policy rules that Anchore supports is the ability to blacklist certain packages, not just operating system packages but also software libraries such as Ruby Gems or Node.js NPMs.

So inspired by Ivan’s blog let’s add a policy check that blacklists these NPMs which will allow us to see if any of our images include these modules.

Once logged on launch the policy editor from the icon on the Navigation Bar.

For simplicity, we’ll just edit the default policy however you can create custom policies that can be mapped to images based on their registry, repository, and tag.

Pressing the   icon expands the list of policy items

We will create a new rule by pressing the button.

In the Gate field select NPM Checks and in the Trigger field select NPM Package Match (Name).

Then in the Parameters field select NPM Name-only match.

We now need to enter the modules that we are looking for.

Paste the following into the field and press the save button:

babelcli, crossenv, cross-env.js, d3.js, fabric-js, ffmepg, gruntcli, http-proxy.js, jquery.js, mariadb, mongose, mssql.js, mssql-node, mysqljs, nodecaffe, nodefabric, node-fabric, nodeffmpeg, nodemailer-js, nodemailer.js, nodemssql, node-opencv, node-opensl, node-openssl, noderequest, nodesass, nodesqlite, node-sqlite, node-tkinter, opencv.js, openssl.js, proxy.js, shadowsock, smb, sqlite.js, sqliter, sqlserver, tkinter

Under action, select  WARN to indicate that the presence of these packages will raise a warning rather than fail or stop the image.

Finally, click the  button to save the policy.

Next, from the Anchore Navigator home page search for an image that you wish to check. Once you have found the image navigate to the Image Policy tab to see if any warnings have been raised based on our new policy.

One of the great features of the Navigator is that it keeps historic data about tags and images so that you can navigate back through a tag’s history to look at previous versions. So perhaps the image you have deployed today does not include one of the trojan modules however an older version of this tag may have included a vulnerable component. This ability to look back may prove valuable in reviewing previous deployments either for audit purposes or when performing a post-mortem as part of incidence response.

The Case of the Missing Vulnerability

We extended one of the most popular features of the Anchore Navigator, tag notifications, in our latest Previously users could subscribe to a tag and receive a notification when a new image was pushed with that tag. For example, if you used the Debian image as the base image for your containers then you could subscribe to receive a notification when a new release was pushed.

In addition to tag update notifications, the Navigator can now send notifications when we detect changes to the policy status of your image, for example, if your image is now failing its policy check, or when CVEs change on your image.

Seeing a CVE change notification is common but usually, you expect to see “CVE Added” however this email is different.

Here you can see that I subscribed to library/python:latest and the current image ID that’s tagged with that tag is 968120d8…. and in the body of the notification you can see that one medium severity CVE has been removed.

When the Anchore Navigator first analyzed image ID 968120d8… a list of packages was retrieved. The Anchore service regularly pulls down vulnerability data from sources such as operating system distributors and the National Vulnerability Database (NVD). We match this data against the package manifest to identify vulnerabilities in the image.

The most common change we see is when a new vulnerability is reported against a specific package. The actual workflows we see vary from distribution to distribution. It is common to see a vulnerability of unknown severity added to an image when the vulnerability is first been disclosed then once the vulnerability has been triaged it moves from unknown severity to a specific severity such as Critical, High, Medium, Low or Negligible.

In some cases as more in-depth analysis occurs a distributor or the upstream vulnerability database provider may change their assessment of not just the severity but also the version number of the vulnerable package. For example, if may initially be thought that version 2.x of package foo is vulnerable to a CVE but on further analysis, it may be found that only version 2.1 is vulnerable.
In this example, the vulnerability was analyzed and it was found that the current version of ImageMagick (version 8:6.8.9.9-5+deb8u9) in Debian Jessie is not vulnerable to this issue and so the associated feed was updated by the Debian security team. Anchore picked up the change to this feed which triggered the notifications.

Sadly seeing vulnerabilities being removed from an image is not very common, you are more likely to see new vulnerabilities being added to images or vulnerability severities being increased which is why it’s important not just to check the image once but keep a constant eye on the status of the image which is where the Anchore Navigator’s notifications feature can help.

Democratizing Container Certification

Today Red Hat announced a new certification program for container images. Key to this announcement is the concept of a container health index that is used to grade a container which is “determined by Red Hat’s evaluation of the level of critical or important security errata that is missing from an image”.

Certifications are certainly not a new thing for Red Hat, it could be said that Red Hat built their enterprise business on top of an industry-leading certification program. Enterprises need to have confidence in their deployments, to know that when they deploy an application it will work, it will be secure, it can be maintained, and it will be performant. In the past, this confidence came through certification. In the early days of Linux, Red Hat really set the standard and worked with hardware and software vendors on certification programs to give a level of assurance to end-users that the operating system would run reliably on their hardware and also offer insurance in the form of enterprise-grade commercial support if they encountered issues.

One Size Doesn’t Fit All

Today the problem is more complex and there can no longer be just a single certification. For example, the requirements of a financial services company are different from the requirements of a healthcare company handling medical records, and these are different from the needs of a federal institution and so on. Even the needs of individual departments within any given organization may be different.

What is needed now is for IT operations and security to be able to define their own certification requirements, which may differ even from application to application, allowing them to define these policies and evaluate them before applications are deployed into production.

What we are talking about is the democratization of certification.

Rather than placing certification in the hands of a small number of vendors or standards bodies, organizations need to define what certification means to them.

Anchore’s goal is to provide a toolset that allows developers, operations, and security teams to maintain full visibility of the ‘chain of custody’ as containers move through the development lifecycle while providing the visibility, predictability, and control needed for production deployment.

At the heart of Anchore’s solution is the concept of users certifying container images based on rules that they define. In the past, certifications for applications typically came from operating systems vendors who defined their own standards and worked with independent software vendors (ISVs) on certification programs to give a level of assurance to end users that the application was compatible with the underlying operating system. Other organizations have created standards and certification tests to cover various forms of compliance validation, especially in the government sector or regulated industries.

Container Certification on Your Terms

Today the baseline feature set for container security is a CVE scan and that’s certainly required but it’s just the first step. An image may contain no operating system CVEs but may still be insecure, misconfigured or in some other way out of compliance. Container images typically contain hundreds, often thousands of files – some coming from operating system packages, some from configuration files, some from 3rd party software libraries such as Node.JS NPMs, Ruby GEMs, Python modules, Java Archives, and some may be supplied by the user. Each one of these artifacts should undergo the same level scrutiny as the operating system packages.

I’m sure that the policies you have in place today for your traditional deployments are more than just ensuring that you’ve updated all operating system packages. While these policies should cover security, starting with the ubiquitous CVE scan, they should go further to analyze the configuration of key security components, for example, you could have the latest version of the Apache or NGINX web server but have configured the wrong set of TLS Ciphers suites leading to insecure communication. Outside of security, certification policies should cover application-specific configurations to comply with best practices or to enable consistency and predictability. With Anchore organizations can define policies and certify containers on their terms – applying the specific policies that matter to them which can even be workload specific and these policies can be applied to any operating system.

As we move away from traditional IT models toward cloud, PaaS, containers and hybrid deployments, the operating system becomes less visible and applications become the focus. However, the operating system is still critical whether as part of a container or underpinning your PaaS platform, and as such it should be secure and well maintained. Some of Anchore’s users have policies requiring that containers should only be built on top of Red Hat Enterprise Linux (RHEL) since this is their corporate standard. Others may use different base operating systems but apply a consistent set of policies to all of these images. Tthis becomes especially important as organizations may consume containers from many sources, including freely available containers on public registries as well as containers provided by software vendors.

With Anchore you own the certification.

Watching Images for Updates

The majority of Docker users do not build their images from scratch, instead, they are built on top of base images that have been created and published by others. Usually, these are official images that have been created by an organization or community and submitted to Docker Inc. and the community for official review.

Images should be regularly updated by their publishers to include the latest content like the latest release of operating system packages to add new features or fixes to security vulnerabilities or new versions of an application or software library. As a developer how do I know when an image has been pushed?

DockerHub supports the concept of webhooks that allow a user to receive a notification via an HTTP message when a new image has been pushed. This feature can be used in a number of ways, most commonly it’s used to trigger builds or deployments of applications based on a specific image. This feature has a major limitation: It only supports webhooks for images owned by a user, meaning you can trigger webhooks for images you have created but not for other images such as a base image from an official publisher.

Yesterday the Debian team updated their base image; you can inspect the image here using the Anchore Navigator. But how would you know that the image has been updated? The most common approach is just to try and pull the image to see if a new version has been published.

# docker pull debian:latest

If an updated image is present the docker client will download the newer image.

Trying to pull repository docker.io/library/debian ...
sha256:476959f29a17423a24a17716e058352ff6fbf13d8389e4a561c8ccc758245937: Pulling from docker.io/library/debian
10a267c67f42: Pull complete
Digest: sha256:476959f29a17423a24a17716e058352ff6fbf13d8389e4a561c8ccc758245937
Status: Downloaded newer image for docker.io/debian:latest

If you already have the latest image then the docker client will report that your image is up to date.

Trying to pull repository docker.io/library/debian ...
sha256:476959f29a17423a24a17716e058352ff6fbf13d8389e4a561c8ccc758245937: Pulling from docker.io/library/debian
Digest: sha256:476959f29a17423a24a17716e058352ff6fbf13d8389e4a561c8ccc758245937
Status: Image is up to date for docker.io/debian:latest

One of the most popular free features of the Anchore Navigator is the ability to subscribe to images in order to receive notifications when images are updated.

In the search results you will see a list of repositories. Anchore Navigator can search through all public images on DockerHub. You will see two types of repositories: Analyzed and Preview.

Repositories and TAGs that Anchore is monitoring. For these repositories and TAGS any time a new image is pushed Anchore will download the image and perform detailed inspection including image metadata, package manifests, file lists, security vulnerabilities and policies.

Repositories that are publicly available on DockerHub but that Anchore has not yet downloaded images.

For example, searching for debian gives the following initial results.

As you can see the first two repositories in the results list have already been analyzed and you can select the repository to view a list of tags and inspect individual images.

If the repository and tag that you wish to monitor has not yet been analyzed you can press the button to submit this TAG to Anchore to be analyzed.

All the official repositories and several hundred of the most popular public repositories are already analyzed by Anchore so the chances are you’ll find the image you are looking for right away.

Here you can see the overview page for the official Debian image. If you want to receive notifications from Anchore when the image is updated press the Subscribe button and Anchore will notify you when the image has been updated.

You can unsubscribe from the image from the image’s overview page and you can see a list of your image subscriptions and favorited images from the “My Images” page accessible from the left navigation menu.

Here’s an example notification email including details of which subscribed images have been updated. From here you can click on the links to be taken to the overview for the new images:

This is just one example of the features available for free to all Anchore Navigator users.

A Snapshot of the Container Ecosystem

Over the last 2 months, we ran a short survey to collect information about Container usage. The survey was slightly shorter than the one we performed in conjunction with DevOps.com and Redmonk 6 months ago but provides deep insight into how the container ecosystem has shifted and continued to evolve over a short period of time. Running multiple surveys gives us the ability to see trends develop and as we review the results of each survey we think of new questions to ask in the next survey to dig deeper.

One of the most interesting data points we extracted, which backs up what we’ve seen in the field, is who is paying for container infrastructure: how much of the container infrastructure is paid -vs- free. In our next survey, we’ll dig deeper into this topic to see where organizations are financially investing in their container infrastructure.

Another interesting finding from the survey data was that many companies/container users still lack the necessary security practices to safely deploy containers in production environments.  Operations and security are still racing to catch up with developers when it comes to the use of containers, but they will need to adapt quickly and put the governance in place to effectively execute and capitalize on the benefits of true microservices architecture.

Anatomy of a CVE

We often mention CVEs in our blogs but we usually skip over the topic, explaining that while CVE checking is important, it is just the tip of the iceberg and that you need to look deeper into the image to check configuration files, non-packaged files, software artifacts such as Ruby GEMs and Node.JS NPMs.

We recently got a Tweet from Marc Boorshtein from Tremolo Security asking why Anchore reported less CVEs in an image than were reported in scan results from the Docker Store.

So we’re going to take this opportunity to dig into some more details about CVEs to understand what they are, where the data comes from, and how we report on vulnerabilities, and then we’ll use that information to answer Marc’s question. For those who don’t want to read all the way through, the tl;dr here is that Anchore’s results are correct!

The Common Vulnerabilities and Exposures (CVE) system establishes a standard for reporting and tracking vulnerabilities. CVE Identifiers are assigned to vulnerabilities to make it easier to share and track information about these issues. The identifier takes the following form: CVE-YEAR-NUMBER, for example CVE-2014-0160.

The CVE identifier is the official way to track vulnerabilities, however, in some cases, well-known vulnerabilities are given names and even logos such as the famous Heartbleed vulnerability. Whether this trend of naming and branding vulnerabilities is a good thing is debatable. Some argue that this branding helps raise awareness others feel it’s a distraction. Either way this trend started by Codenomicon with Heartbleed has continued with many new vulnerabilities receiving catchy names such as Dirty Cow and Badlock. Not all serious vulnerabilities get branded and not all branded vulnerabilities are serious.

The CVE database is maintained by the Mitre Corporation under contract from the US Government. While Mitre retains responsibility for maintaining the CVE list there are a number of organizations who, under Mitre’s direction, can issue CVE numbers – these are called CVE Numbering Authorities. As of today, there are 53 organizations participating in this program, usually, these are hardware or software vendors such as Canonical, Google, IBM and Red Hat. Many vendors have their own vulnerability tracking databases and CVE helps by providing the glue that links these databases together, for example, a vulnerability in vendor’s hardware appliance may be traced back to an issue in a software library used by many other applications. Having a common identifier to refer to this issue simplifies tracking and reduces complexity.

Another database that you’ll see referenced frequently is the National Vulnerability Database (NVD) which is run by the National Institute of Science and Technology (NIST). This database builds on top of the CVE database by adding extra information such as severity scores, fix information and vendor-specific details.

Let’s use an example to dig deeper into CVEs:

CVE-2016-5195 is a bug that impacts the Linux kernel. It’s a race condition that if successfully exploited can allow local users to gain root privileges. This vulnerability is better known as “Dirty COW,” since it leverages incorrect handling of a copy-on-write (COW) feature.

Reading the details in the CVE database you can see that this issue impacts Linux kernel versions 2.x, 3.x and 4.x before version 4.8.3. More details can be found in the NVD database here. Listed in the NVD database you will find information about the severity score of the vulnerability and links to vendors advisories.

So, in theory, any Linux kernel prior to version 4.8.3 is vulnerable to this exploit however in practice things are more complicated. Take for example CentOS, where the latest available kernel is version 3.10 (or more accurately 3.10.0-514.10.2).

At first, you might expect this kernel to be vulnerable to “Dirty Cow” however Red Hat backported the fix from 4.8.3 into an older kernel version. Backporting is a popular practice for enterprise focussed software products whose users want to keep a well known, stable version of a software platform but still take advantage of security fixes or new features. Backporting selective features and fixes minimize the risk of adopting a completely new release of a software platform.

As you can see from this example, while the practice of backporting has many advantages for end-users it complicates the process of auditing installed software using the CVE database.

For this reason, many vendors produce their own vulnerability tracking feeds that link back to the CVE database but provides vendor-specific information. For example, Red Hat issues Red Hat Security Advisories (RHSAs) which are publicly available and can also be used to map between RHSAs and CVEs. Other distributions such as Debian, Oracle, SUSE and Oracle provide similarly detailed feeds.

These vendor-specific feeds contain valuable information that may not be easily obtained from the NVD database. For example, a Linux distributor may discern that while the upstream project that they are using for a given software package may be impacted with a certain CVE, the way that the package is configured and compiled on their platform may not be impacted by this CVE. A good example can be seen here in Debian’s security tracker. For this reason, a combination of using a vendor’s specific feed and whitelists will provide more accurate information in a security scan.

We started this blog by referencing a Tweet that compared Anchore’s scan results to Docker Store’s scan result. The image is question was based off CentOS so we will use this as the foundation for comparison.

You can view Anchore’s analysis of the latest CentOS image in the Anchore Navigator here:
Selecting the Security tab will show known vulnerabilities.

Inspecting the same image in DockerHub or DockerStore will show significantly more vulnerabilities. With at least 12 packages with critical vulnerabilities.

For example, here we see that the bash package has 3 critical vulnerabilities two of which date back to 2014.

Let’s review the first vulnerability: CVE-2014-6277:

While the CVE database does show that bash prior to version 4.3 is vulnerable to this CVE Red Hat’s analysis of the fixes applied in their release states the following:

Red Hat no longer considers this bug to be a security issue. The change introduced in bash errata RHSA-2014:1306, RHSA-2014:1311 and RHSA-2014:1312 removed the exposure of the bash parser to untrusted input, mitigating this problem to a bug without security impact.

Using Red Hat’s data feed allows us to benefit from their detailed analysis and provide more accurate and relevant information. While this requires that Anchore needs to add distribution specific features to our codebase the benefits far outweigh the cost.

Looking in detail through the results for CentOS in DockerStore and in Anchore we are confident that we are displaying the correct results, however, this leads to a very interesting question – how would you know if we were making a mistake?

In a previous blog, we discussed Hanlon’s Razor which states: “Never attribute to malice that which is adequately explained by stupidity.” Mistakes can obviously be made in security scanners, those mistakes could be deliberate – to purposely hide an issue for some nefarious reasons, but more likely they are just innocent mistakes. At Anchore we believe that security and analysis tools should be open source so that anyone can inspect the code to validate that the results are fair and accurate. In short, we live by the mantra “trust but verify.” But that all said, remember that CVEs are just the tip of the iceberg and you need to look far deeper into your images.

Whitelisting CVE’s

In last week’s blog, we covered how to create custom policies that can be used to evaluate your container images as part of your CI/CD pipeline or at any time during their lifetime. We explained that you should always perform a CVE scan of your container but that this is only the first step, in fact security vulnerabilities in the operating system packages are just the tip of the iceberg in terms of the tests that you should be performing.

Today we want to dig a little deeper into CVEs. Let’s start by looking at the NGINX image in the Anchore Navigator. NGINX is one of the most downloaded images on DockerHub and the chances are that if you are reading this blog you are running NGINX somewhere in your environment.

The following link will take you directly to the Security tab for the image to show you the CVEs found in this image.

At first glance, looking at the summary, you will probably be concerned: 18 high-level CVEs. The chances are that your policies are configured to fail the image and stop the deployment if any high-level CVEs are found but it’s not that simple.

Let’s drill down into the details of the first two entries in the list.

Here you can see that two packages include the following vulnerability: CVE-2016-7943 and that, currently, there is no fix available in the version of Debian that this container is built from. You may be tempted to ignore any CVE for which there is not yet a fix, however, there are may not be a fix because one is not required or perhaps there is a real vulnerability but the vendor has not yet released a patch. So let’s click on the link for CVE-2016-7943 to dig a little deeper.

This CVE has been issued against the libx11 library for X.org the graphical display server.
Libx11 is present in the image as it was pulled in by dependencies (libx11 -> libxpm4 -> nginx-module-image-filter).
The National Vulnerability Database (NVD), maintained by NIST, has this categorized as high severity. As you can see from the description this vulnerability may allow remote X servers to gain higher-level privileges. At the bottom of the page you will see the following notes:

Here you can see that the Debian security team has described it as a “minor issue”.
Given the Debian security team’s assessment, not to mention the fact that there will be no remote X window connections to this server we can safely ignore this high vulnerability.
That’s 1 down, 17 more to go …….

For the sake of this example, let’s presume that all the 18 high-level CVEs aren’t exploitable in our image. While that is certainly reassuring it’s also a lot of work for a DevOps engineer to review all CVEs in an image – there’s just too much noise and mistakes are bound to be made.

At Anchore we don’t believe that we should be producing lists of issues for engineers to review, the result of a policy evaluation should be a decision, does the image pass or fail? You will see that result on the Policy tab for this image.

We have evaluated this image with our default policy and with no whitelist, hence the failure.

The Anchore engine supports the notion of whitelists that allow users to define exceptions that should be ignored. For example, if we included CVE-2016-7943 in our whitelist then those first two high vulnerabilities would not have been shown in our policy evaluation.

Let’s move the command line to continue.

We’ll start by pulling down the latest nginx image and performing an analysis using Anchore.

# docker pull nginx:latest
# anchore analyze --image=nginx:latest

Next, we’ll create a very simple policy file called mypolicy, containing only two checks – for High and Critical CVEs

ANCHORESEC:VULNCRITICAL:STOP
ANCHORESEC:VULNHIGH:STOP

And then run a gate check against the image

# anchore gate --image=nginx:latest --policy=mypolicy
+--------------+------------------------+------------+----------+-----------------------------+-------------+
| Image Id     | Repo Tag               | Gate       | Trigger  | Check Output                | Gate Action |
+--------------+------------------------+------------+----------+-----------------------------+-------------+
| 5e69fe4b3c31 | docker.io/nginx:latest | ANCHORESEC | VULNHIGH | High Vulnerability found in | STOP        |
|              |                        |            |          | package - libx11-data       |             |
|              |                        |            |          | (CVE-2016-7943 - https      |             |
|              |                        |            |          | ://security-tracker.debian. |             |
|              |                        |            |          | org/tracker/CVE-2016-7943)  |             |
| 5e69fe4b3c31 | docker.io/nginx:latest | ANCHORESEC | VULNHIGH | High Vulnerability found in | STOP        |
|              |                        |            |          | package - libx11-6          |             |
|              |                        |            |          | (CVE-2016-7943 - https      |             |
|              |                        |            |          | ://security-tracker.debian. |             |
|              |                        |            |          | org/tracker/CVE-2016-7943)  |             |
| 5e69fe4b3c31 | docker.io/nginx:latest | ANCHORESEC | VULNHIGH | High Vulnerability found in | STOP        |
|              |                        |            |          | package - libc-bin          |             |
|              |                        |            |          | (CVE-2014-9761 - https      |             |
|              |                        |            |          | ://security-tracker.debian. |             |
|              |                        |            |          | org/tracker/CVE-2014-9761)  |             |
| 5e69fe4b3c31 | docker.io/nginx:latest | ANCHORESEC | VULNHIGH | High Vulnerability found in | STOP        |
|              |                        |            |          | package - multiarch-support |             |
|              |                        |            |          | (CVE-2014-9761 - https      |             |
|              |                        |            |          | ://security-tracker.debian. |             |
|              |                        |            |          | org/tracker/CVE-2014-9761)  |             |
| 5e69fe4b3c31 | docker.io/nginx:latest | ANCHORESEC | VULNHIGH | High Vulnerability found in | STOP        |
|              |                        |            |          | package - libc6             |             |
|              |                        |            |          | (CVE-2014-9761 - https      |             |
|              |                        |            |          | ://security-tracker.debian. |             |
|              |                        |            |          | org/tracker/CVE-2014-9761)  |             |
| 5e69fe4b3c31 | docker.io/nginx:latest | ANCHORESEC | VULNHIGH | High Vulnerability found in | STOP        |
|              |                        |            |          | package - libx11-data       |             |
|              |                        |            |          | (CVE-2016-7942 - https      |             |
|              |                        |            |          | ://security-tracker.debian. |             |
|              |                        |            |          | org/tracker/CVE-2016-7942)  |             |
| 5e69fe4b3c31 | docker.io/nginx:latest | ANCHORESEC | VULNHIGH | High Vulnerability found in | STOP        |
|              |                        |            |          | package - libx11-6          |             |
|              |                        |            |          | (CVE-2016-7942 - https      |             |
|              |                        |            |          | ://security-tracker.debian. |             |
|              |                        |            |          | org/tracker/CVE-2016-7942)  |             |
| 5e69fe4b3c31 | docker.io/nginx:latest | ANCHORESEC | VULNHIGH | High Vulnerability found in | STOP        |
|              |                        |            |          | package - libxml2           |             |
|              |                        |            |          | (CVE-2016-4448 - https      |             |
|              |                        |            |          | ://security-tracker.debian. |             |
|              |                        |            |          | org/tracker/CVE-2016-4448)  |             |
| 5e69fe4b3c31 | docker.io/nginx:latest | ANCHORESEC | VULNHIGH | High Vulnerability found in | STOP        |
|              |                        |            |          | package - libvpx1           |             |
|              |                        |            |          | (CVE-2015-1258 - https      |             |
|              |                        |            |          | ://security-tracker.debian. |             |
|              |                        |            |          | org/tracker/CVE-2015-1258)  |             |
| 5e69fe4b3c31 | docker.io/nginx:latest | ANCHORESEC | VULNHIGH | High Vulnerability found in | STOP        |
|              |                        |            |          | package - libtiff5          |             |
|              |                        |            |          | (CVE-2015-7554 - https      |             |
|              |                        |            |          | ://security-tracker.debian. |             |
|              |                        |            |          | org/tracker/CVE-2015-7554)  |             |
| 5e69fe4b3c31 | docker.io/nginx:latest | ANCHORESEC | VULNHIGH | High Vulnerability found in | STOP        |
|              |                        |            |          | package - libtiff5          |             |
|              |                        |            |          | (CVE-2016-9535 - https      |             |
|              |                        |            |          | ://security-tracker.debian. |             |
|              |                        |            |          | org/tracker/CVE-2016-9535)  |             |
| 5e69fe4b3c31 | docker.io/nginx:latest | ANCHORESEC | VULNHIGH | High Vulnerability found in | STOP        |
|              |                        |            |          | package - libxml2           |             |
|              |                        |            |          | (CVE-2016-1761 - https      |             |
|              |                        |            |          | ://security-tracker.debian. |             |
|              |                        |            |          | org/tracker/CVE-2016-1761)  |             |
| 5e69fe4b3c31 | docker.io/nginx:latest | ANCHORESEC | VULNHIGH | High Vulnerability found in | STOP        |
|              |                        |            |          | package - libtiff5          |             |
|              |                        |            |          | (CVE-2017-5225 - https      |             |
|              |                        |            |          | ://security-tracker.debian. |             |
|              |                        |            |          | org/tracker/CVE-2017-5225)  |             |
| 5e69fe4b3c31 | docker.io/nginx:latest | FINAL      | FINAL    |                             | STOP        |
+--------------+------------------------+------------+----------+-----------------------------+-------------+

For the sake of this example let’s presume that all of these CVEs have been analyzed and based on the results whitelisted. We’ll create a file called mywhitelist that contains a line for each unique CVE along with the name of the gate: ANCHORESEC

Eg.

ANCHORESEC CVE-2014-9761
ANCHORESEC CVE-2015-1258
ANCHORESEC CVE-2015-7554
ANCHORESEC CVE-2016-1761
ANCHORESEC CVE-2016-2779
ANCHORESEC CVE-2016-3881
ANCHORESEC CVE-2016-4448
ANCHORESEC CVE-2016-6711
ANCHORESEC CVE-2016-6712
ANCHORESEC CVE-2016-7942
ANCHORESEC CVE-2016-7943
ANCHORESEC CVE-2016-9535
ANCHORESEC CVE-2017-0393
ANCHORESEC CVE-2017-5225

Now if we run the gate analysis passing the whitelist we’ll see a very different result.

# anchore gate --image=nginx:latest --policy=mypolicy --global-whitelist=mywhitelist
+--------------+------------------------+-------+---------+--------------+-------------+
| Image Id     | Repo Tag               | Gate  | Trigger | Check Output | Gate Action |
+--------------+------------------------+-------+---------+--------------+-------------+
| 5e69fe4b3c31 | docker.io/nginx:latest | FINAL | FINAL   |              | GO          |
+--------------+------------------------+-------+---------+--------------+-------------+

The gate command supports a –show-whitelisted flag that shows which allows a user to see which items were whitelisted and from which whitelist.

# anchore gate --image=nginx:latest --policy=mypolicy --global-whitelist=mywhitelist --show-whitelisted
+--------------+------------------------+------------+----------+-------------------------+-------------+-------------+
| Image Id     | Repo Tag               | Gate       | Trigger  | Check Output            | Gate Action | Whitelisted |
+--------------+------------------------+------------+----------+-------------------------+-------------+-------------+
| 5e69fe4b3c31 | docker.io/nginx:latest | ANCHORESEC | VULNHIGH | High Vulnerability      | STOP        | global      |
|              |                        |            |          | found in package -      |             |             |
|              |                        |            |          | libx11-data             |             |             |
|              |                        |            |          | (CVE-2016-7943 - https  |             |             |
|              |                        |            |          | ://security-tracker.deb |             |             |
|              |                        |            |          | ian.org/tracker/CVE-201 |             |             |
|              |                        |            |          | 6-7943)                 |             |             |
| 5e69fe4b3c31 | docker.io/nginx:latest | ANCHORESEC | VULNHIGH | High Vulnerability      | STOP        | global      |
|              |                        |            |          | found in package -      |             |             |
|              |                        |            |          | libx11-6 (CVE-2016-7943 |             |             |
|              |                        |            |          | - https://security-trac |             |             |
|              |                        |            |          | ker.debian.org/tracker/ |             |             |
|              |                        |            |          | CVE-2016-7943)          |             |             |
| 5e69fe4b3c31 | docker.io/nginx:latest | ANCHORESEC | VULNHIGH | High Vulnerability      | STOP        | global      |
|              |                        |            |          | found in package -      |             |             |
|              |                        |            |          | libvpx1 (CVE-2017-0393  |             |             |
|              |                        |            |          | - https://security-trac |             |             |
|              |                        |            |          | ker.debian.org/tracker/ |             |             |
|              |                        |            |          | CVE-2017-0393)          |             |             |
| 5e69fe4b3c31 | docker.io/nginx:latest | ANCHORESEC | VULNHIGH | High Vulnerability      | STOP        | global      |
|              |                        |            |          | found in package -      |             |             |
|              |                        |            |          | libc-bin (CVE-2014-9761 |             |             |
|              |                        |            |          | - https://security-trac |             |             |
|              |                        |            |          | ker.debian.org/tracker/ |             |             |
|              |                        |            |          | CVE-2014-9761)          |             |             |
| 5e69fe4b3c31 | docker.io/nginx:latest | ANCHORESEC | VULNHIGH | High Vulnerability      | STOP        | global      |
|              |                        |            |          | found in package -      |             |             |
|              |                        |            |          | multiarch-support       |             |             |
|              |                        |            |          | (CVE-2014-9761 - https  |             |             |
|              |                        |            |          | ://security-tracker.deb |             |             |
|              |                        |            |          | ian.org/tracker/CVE-201 |             |             |
|              |                        |            |          | 4-9761)                 |             |             |
| 5e69fe4b3c31 | docker.io/nginx:latest | ANCHORESEC | VULNHIGH | High Vulnerability      | STOP        | global      |
|              |                        |            |          | found in package -      |             |             |
|              |                        |            |          | libc6 (CVE-2014-9761 -  |             |             |
|              |                        |            |          | https://security-tracke |             |             |
|              |                        |            |          | r.debian.org/tracker/CV |             |             |
|              |                        |            |          | E-2014-9761)            |             |             |
| 5e69fe4b3c31 | docker.io/nginx:latest | ANCHORESEC | VULNHIGH | High Vulnerability      | STOP        | global      |
|              |                        |            |          | found in package -      |             |             |
|              |                        |            |          | libx11-data             |             |             |
|              |                        |            |          | (CVE-2016-7942 - https  |             |             |
|              |                        |            |          | ://security-tracker.deb |             |             |
|              |                        |            |          | ian.org/tracker/CVE-201 |             |             |
|              |                        |            |          | 6-7942)                 |             |             |
| 5e69fe4b3c31 | docker.io/nginx:latest | ANCHORESEC | VULNHIGH | High Vulnerability      | STOP        | global      |
|              |                        |            |          | found in package -      |             |             |
|              |                        |            |          | libx11-6 (CVE-2016-7942 |             |             |
|              |                        |            |          | - https://security-trac |             |             |
|              |                        |            |          | ker.debian.org/tracker/ |             |             |
|              |                        |            |          | CVE-2016-7942)          |             |             |
| 5e69fe4b3c31 | docker.io/nginx:latest | ANCHORESEC | VULNHIGH | High Vulnerability      | STOP        | global      |
|              |                        |            |          | found in package -      |             |             |
|              |                        |            |          | libvpx1 (CVE-2016-6711  |             |             |
|              |                        |            |          | - https://security-trac |             |             |
|              |                        |            |          | ker.debian.org/tracker/ |             |             |
|              |                        |            |          | CVE-2016-6711)          |             |             |
| 5e69fe4b3c31 | docker.io/nginx:latest | ANCHORESEC | VULNHIGH | High Vulnerability      | STOP        | global      |
|              |                        |            |          | found in package -      |             |             |
|              |                        |            |          | libvpx1 (CVE-2016-6712  |             |             |
|              |                        |            |          | - https://security-trac |             |             |
|              |                        |            |          | ker.debian.org/tracker/ |             |             |
|              |                        |            |          | CVE-2016-6712)          |             |             |
| 5e69fe4b3c31 | docker.io/nginx:latest | ANCHORESEC | VULNHIGH | High Vulnerability      | STOP        | global      |
|              |                        |            |          | found in package -      |             |             |
|              |                        |            |          | libxml2 (CVE-2016-4448  |             |             |
|              |                        |            |          | - https://security-trac |             |             |
|              |                        |            |          | ker.debian.org/tracker/ |             |             |
|              |                        |            |          | CVE-2016-4448)          |             |             |
| 5e69fe4b3c31 | docker.io/nginx:latest | ANCHORESEC | VULNHIGH | High Vulnerability      | STOP        | global      |
|              |                        |            |          | found in package -      |             |             |
|              |                        |            |          | libvpx1 (CVE-2015-1258  |             |             |
|              |                        |            |          | - https://security-trac |             |             |
|              |                        |            |          | ker.debian.org/tracker/ |             |             |
|              |                        |            |          | CVE-2015-1258)          |             |             |
| 5e69fe4b3c31 | docker.io/nginx:latest | ANCHORESEC | VULNHIGH | High Vulnerability      | STOP        | global      |
|              |                        |            |          | found in package -      |             |             |
|              |                        |            |          | libvpx1 (CVE-2016-3881  |             |             |
|              |                        |            |          | - https://security-trac |             |             |
|              |                        |            |          | ker.debian.org/tracker/ |             |             |
|              |                        |            |          | CVE-2016-3881)          |             |             |
| 5e69fe4b3c31 | docker.io/nginx:latest | ANCHORESEC | VULNHIGH | High Vulnerability      | STOP        | global      |
|              |                        |            |          | found in package -      |             |             |
|              |                        |            |          | libtiff5 (CVE-2015-7554 |             |             |
|              |                        |            |          | - https://security-trac |             |             |
|              |                        |            |          | ker.debian.org/tracker/ |             |             |
|              |                        |            |          | CVE-2015-7554)          |             |             |
| 5e69fe4b3c31 | docker.io/nginx:latest | ANCHORESEC | VULNHIGH | High Vulnerability      | STOP        | global      |
|              |                        |            |          | found in package -      |             |             |
|              |                        |            |          | libtiff5 (CVE-2016-9535 |             |             |
|              |                        |            |          | - https://security-trac |             |             |
|              |                        |            |          | ker.debian.org/tracker/ |             |             |
|              |                        |            |          | CVE-2016-9535)          |             |             |
| 5e69fe4b3c31 | docker.io/nginx:latest | ANCHORESEC | VULNHIGH | High Vulnerability      | STOP        | global      |
|              |                        |            |          | found in package -      |             |             |
|              |                        |            |          | util-linux              |             |             |
|              |                        |            |          | (CVE-2016-2779 - https  |             |             |
|              |                        |            |          | ://security-tracker.deb |             |             |
|              |                        |            |          | ian.org/tracker/CVE-201 |             |             |
|              |                        |            |          | 6-2779)                 |             |             |
| 5e69fe4b3c31 | docker.io/nginx:latest | ANCHORESEC | VULNHIGH | High Vulnerability      | STOP        | global      |
|              |                        |            |          | found in package -      |             |             |
|              |                        |            |          | libxml2 (CVE-2016-1761  |             |             |
|              |                        |            |          | - https://security-trac |             |             |
|              |                        |            |          | ker.debian.org/tracker/ |             |             |
|              |                        |            |          | CVE-2016-1761)          |             |             |
| 5e69fe4b3c31 | docker.io/nginx:latest | ANCHORESEC | VULNHIGH | High Vulnerability      | STOP        | global      |
|              |                        |            |          | found in package -      |             |             |
|              |                        |            |          | libtiff5 (CVE-2017-5225 |             |             |
|              |                        |            |          | - https://security-trac |             |             |
|              |                        |            |          | ker.debian.org/tracker/ |             |             |
|              |                        |            |          | CVE-2017-5225)          |             |             |
| 5e69fe4b3c31 | docker.io/nginx:latest | FINAL      | FINAL    |                         | GO          | none        |
+--------------+------------------------+------------+----------+-------------------------+-------------+-------------+

Whitelisting with Jenkins Plugin

The latest version of the Anchore plugin for Jenkins (version 1.0.9) includes the ability to pass a whitelist file to Anchore to the custom policy file. Using this mechanism you can include a whitelist in the workspace of your project that will be automatically picked up at analysis time.

To update to the latest version of Anchore login to the Jenkins web interface and select:

Manage Jenkins -> Manage Plugins

Press the “Check now button” to ensure that you have the latest plugin metadata.

From the “Updates” tab ensure that you’re upgrading to the latest Anchore plugin – at least version 1.0.9.

To use whitelists within your Jenkins project go to the Anchore Container Image Scanner build step where you will see a similar screen as shown above including the new “Global White list file” entry field.

From this screen press the “Save” button the new setting will not be honored until Save is pressed once.

The upcoming Anchore 2.0 release will support the graphical creation of whitelists and policies along with the ability to define a mapping file that allows the user to define which policies and whitelists are used for any given image based on its registry, repo name and tag.

In our next blog, we’ll dig deeper into advance policy and whitelist options as well as discussing curated whitelists.

Becoming a Container Security Champion

Since we released Anchore’s open source project almost a year ago we’ve seen fast-growing adoption by users who want to perform detailed inspection and analysis of their container images. By far the most common use case we see with our users is deploying Anchore within their continuous integration and deployment pipelines (CI/CD) especially with Jenkins.

In some of the recent events we’ve attended it’s been great to talk to end-users who are already using Anchore. We’ve heard a pretty consistent message in the conversations we’ve had:

Developers love Docker and it’s already a vital part of their development process and they are either already deploying Docker in production or are planning to do so. What we hear from operations and security folks is often a little different! We hear talks of ‘Shadow IT’ and unmanaged deployments. Right now it seems like the security and operations teams are racing to catch up with development.

Rather than trying to slow things down, most of the operations teams that we talk to want to just “get out of the way and let developers innovate” but they need to balance this with their organization’s needs around security and compliance.

Based on the experience we have already built with organizations in addressing these issues, today we are launching a new offering that we call Anchore Champion that provides a combination of services and support to jumpstart the process of securing an organization’s CI/CD pipeline and adding compliance and governance into their DevOps environment.

The Anchore Champion service begins with a container policy and compliance working session where we, virtually, get together with all the stakeholders: developers, operations and security to work through their requirements for compliance and then build a set of sample policies and whitelists that encompass their needs.

Next, we provide support for architecting a secure container build environment – helping integrate Anchore into a Jenkins or other CI/CD pipeline.

And we provide ongoing support for creating policies, configuration and general operation of Anchore.

Creating Policies

At the heart of Anchore’s solution is the concept of users certifying container images based on rules that they define. In the past certifications for applications typically came from operating systems vendors who defined their own standards and worked with independent software vendors (ISVs) on certification programs to give a level of assurance to end users that the application was compatible with the underlying operating system. Other organizations have created standards and certification tests to cover various forms of compliance validation, especially in the government sector or regulated industries.

Today the problem is more complex and there can no longer be just a single certification. For example, the requirements of a financial services company are different from the requirements of a healthcare company handling medical records and these are different from the needs of a federal institution and so on.

Anchore believes that rather than having certification in the hands of a small number of vendors or standards bodies, we want to allow organizations to define what certification means to them. In effect, we want to democratize certification.

Today we are seeing the baseline feature set for container security is a CVE scan and that’s certainly required but it’s just the first step.I’m sure the policies and you have in place today for your traditional deployments are more than just ensuring that you’ve updated all operating system packages.

These policies could cover security, starting with the ubiquitous CVE scan but then going further to analyze the configuration of key security components, for example, you could have the latest version of the apache webserver but have configured the wrong set of TLS Ciphers suites leading to insecure communication. Outside of security, policies could cover application-specific configurations to comply with best practices or to enable consistency and predictability.

In this blog, we will walk through some sample policies and cover how users can customize these policies as well as create and share their own policies.

Let’s start by looking at the policy evaluation of a test image. We will be using the anchore gate command. In Anchore’s terminology gates are checks that are run on images as they pass through the CI/CD pipeline or later when performing an evaluation on existing images.

Instead of using the default policy, we will use a customized policy called “basic-policy” that will be loaded by the CLI.

# anchore gate --image=testimage --policy=basic-policy
+--------------+------------------+-----------------+---------------+-------------------------+-------------+
| Image Id     | Repo Tag         | Gate            | Trigger       | Check Output            | Gate Action |
+--------------+------------------+-----------------+---------------+-------------------------+-------------+
| 9ebc746ba558 | testimage:latest | DOCKERFILECHECK | NOHEALTHCHECK | Dockerfile does not     | WARN        |
|              |                  |                 |               | contain any HEALTHCHECK |             |
|              |                  |                 |               | instructions            |             |
| 9ebc746ba558 | testimage:latest | PKGBLACKLIST    | PKGNAMEMATCH  | Package is blacklisted: | STOP        |
|              |                  |                 |               | openssh-server          |             |
| 9ebc746ba558 | testimage:latest | ANCHORESEC      | VULNMEDIUM    | Medium Vulnerability    | WARN        |
|              |                  |                 |               | found in package -      |             |
|              |                  |                 |               | bind-license            |             |
|              |                  |                 |               | (RHSA-2017:0276 - https |             |
|              |                  |                 |               | ://rhn.redhat.com/errat |             |
|              |                  |                 |               | a/RHSA-2017-0276.html)  |             |
| 9ebc746ba558 | testimage:latest | ANCHORESEC      | VULNMEDIUM    | Medium Vulnerability    | WARN        |
|              |                  |                 |               | found in package -      |             |
|              |                  |                 |               | openssl-libs            |             |
|              |                  |                 |               | (RHSA-2017:0286 - https |             |
|              |                  |                 |               | ://rhn.redhat.com/errat |             |
|              |                  |                 |               | a/RHSA-2017-0286.html)  |             |
| 9ebc746ba558 | testimage:latest | ANCHORESEC      | VULNMEDIUM    | Medium Vulnerability    | WARN        |
|              |                  |                 |               | found in package - vim- |             |
|              |                  |                 |               | minimal (RHSA-2016:2972 |             |
|              |                  |                 |               | - https://rhn.redhat.co |             |
|              |                  |                 |               | m/errata/RHSA-2016-2972 |             |
|              |                  |                 |               | .html)                  |             |
| 9ebc746ba558 | testimage:latest | ANCHORESEC      | VULNHIGH      | High Vulnerability      | STOP        |
|              |                  |                 |               | found in package -      |             |
|              |                  |                 |               | bind-license            |             |
|              |                  |                 |               | (RHSA-2017:0062 - https |             |
|              |                  |                 |               | ://rhn.redhat.com/errat |             |
|              |                  |                 |               | a/RHSA-2017-0062.html)  |             |
| 9ebc746ba558 | testimage:latest | IMAGECHECK      | BASEOUTOFDATE | Image base image        | WARN        |
|              |                  |                 |               | (docker.io/acathrow     |             |
|              |                  |                 |               | /aic-test:1a) ID is     |             |
|              |                  |                 |               | (9ebc746ba558), but the |             |
|              |                  |                 |               | latest ID for           |             |
|              |                  |                 |               | (docker.io/acathrow     |             |
|              |                  |                 |               | /aic-test:1a) is        |             |
|              |                  |                 |               | (f3e982542816)          |             |
| 9ebc746ba558 | testimage:latest | FINAL           | FINAL         |                         | STOP        |
+--------------+------------------+-----------------+---------------+-------------------------+-------------+

Here the output is formatted in a tabular view for a command line user to read however if you want to automate the processing of the output then the anchore command supports a --json or --plain command line option to output the results in a format that is easily parsed by other tools.

The most important part of the output is the last line that indicates that the final policy evaluation is “STOP”. Anchore gates will output one of three actions:

GO: The gate is open and the image should be allowed to pass through to the next stage.
STOP: The gate is closed and the image should not proceed
WARN: The gate is open and should proceed to the next step however warnings have been raised that should be reviewed.

If you are automating the use of Anchore from the command line then the return code from the anchore command can be used to evaluate the status: 0 = Go, 1 = Stop, 2 = Warn.

Looking at the output of the policy evaluation we can see that two policy checks outputted a “STOP” action. The first was due to a blacklisted package being present in the image and the second was due to a high-level CVE vulnerability.

Next, we’ll take a look at the policy.

DOCKERFILECHECK:NOTAG:STOP
DOCKERFILECHECK:NOFROM:STOP
DOCKERFILECHECK:NOHEALTHCHECK:WARN
DOCKERFILECHECK:EXPOSE:STOP:DENIEDPORTS=22
SUIDDIFF:SUIDFILEDEL:GO
SUIDDIFF:SUIDMODEDIFF:STOP
SUIDDIFF:SUIDFILEADD:STOP
IMAGECHECK:BASEOUTOFDATE:WARN
PKGBLACKLIST:PKGNAMEMATCH:STOP:BLACKLIST_NAMEMATCH=openssh-server
ANCHORESEC:FEEDOUTOFDATE:STOP:MAXAGE=2
ANCHORESEC:UNSUPPORTEDDISTRO:STOP
ANCHORESEC:VULNCRITICAL:STOP
ANCHORESEC:VULNHIGH:STOP
ANCHORESEC:VULNMEDIUM:WARN

The policy file lines are of the following format:

Gate name : Trigger : Action : Optional Parameters

You can consider a Gate as a family of checks that can be performed.

Checks can raise triggers that may have parameters.

Once a trigger is raised then an action (GO, STOP or WARN) is defined.

For example, looking at the following snippet from this simple policy:

DOCKERFILECHECK:NOHEALTHCHECK:WARN

Within the Dockerfilecheck gate there is a that looks for a healthcheck statement in the Dockerfile. If no healthcheck statement is found then the NOHEALTHCHECK trigger is raised.

In this example, we have configured Anchore to raise a warning if the Dockerfile does not include a health check.
In the next example we’ll blacklist two packages:

PKGBLACKLIST:PKGNAMEMATCH:STOP:BLACKLIST_NAMEMATCH=openssh-server,foolib

Here we have configured the PKGNAMEMATCH trigger to issue a STOP action if either openssh-server or foolib is present in the image.

The PKGBLACKLIST gate has two triggers : PKGFULLMATCH which matches both a package name and version and PKGNAMEMATCH which matches just the name of the package.

Anchore comes pre-installed with a number of policy modules that can be extended by the user and we regularly add new modules.

You can retrieve a full list of available policy options by running the following command:

# anchore gate --show-policytemplate

This will output a sample policy including all available gates including all available parameters.

The policy template option is useful for providing a policy file that you can further customize.

To get more detailed descriptions of gates, triggers and configuration options you can run the
following command:

# anchore gate --show-gatehelp
PKGCHECK:
   PKGNOTPRESENT:
     description: 'triggers if the package(s) specified in the params are not installed
       in the container image.  PKGFULLMATCH param can specify an exact match (ex:
       "curl|7.29.0-35.el7.centos").  PKGNAMEMATCH param can specify just the package
       name (ex: "curl").  PKGVERSMATCH can specify a minimum version and will trigger
       if installed version is less than the specified minimum version (ex: zlib|0.2.8-r2)'
     params: PKGFULLMATCH,PKGNAMEMATCH,PKGVERSMATCH

In this snippet, you can see the configuration options for the Package Check gate which allows a policy to specify that certain packages should be installed in the image. In addition to checking for the presence of a package, the user can configure minimum required versions.

We have set up a git repository to make it easier to share sample policies and allow the community to collaborate. You can access the repository here.

In our next blog, we’ll cover whitelists and show how you can reduce some of the noise that is often seen in CVE scans by whitelisting vulnerabilities that are not exploitable in your image.

Microservices -vs- MicroVMs

At Anchore we spend a whole lot of time looking at container images to provide detailed analysis and certification. Most of the discussions we hear in the industry around image analysis focus on CVE scanning: how many CVEs are in an image, what severity, etc. As we’ve mentioned before, we see CVE scanning as just the tip of the iceberg and that it’s possible to have all the latest operating system packages but still have an image that has security vulnerabilities or is otherwise not compliant with your operational, security or business policies.

There is another common issue in the tens of thousands of images that we’ve analyzed which we feel is more fundamental. As an industry we are moving to an architecture based on microservices and containers are really the key to enabling this. While the containers we’ve seen are often designed to run microservices, I’d argue that the majority of containers we see (both on DockerHub as well as our customer’s private images) are more like MicroVMs than Microservices. These images typically have a hundred or more packages and several thousand files.

In most cases, the images are general-purpose operating system images and differ only from their virtual machine brethren by not having a kernel installed. There has been much debate in the industry about image size and how smaller is better, allowing images to be rapidly deployed over the network. Others argue that size doesn’t matter and that the layered nature of Docker’s image format and caching largely mitigates this issue, but looking just at the size of the image doesn’t give you the complete picture.

While it’s certainly an important point to consider the real concern should be not the size of the image, but the content of the images.

Let’s take Alpine as an example. Let’s use the Anchore Navigator to view the contents and select the files tab to drill down further. Filtering this list to show the files in /bin highlights just how many executables are in the image. In a microservice, why does my image need utilities for process or file management? These come from having the busybox package in the image. While that may certainly be useful in some use cases I’d argue that having these kinds of binaries in an image that never directly calls them is an accident waiting to happen. I don’t mean to pick on Alpine which weighs in at 4MB (twenty-five times smaller than most base operating system images and certainly has less attack surface) but the point you must consider is that you must ensure that every artifact in your image serves a purpose and goes through some form of quality control to ensure that the final image is secure and meets your operational best practices.

Last month Oracle released a slimmed down Oracle Linux image which reduced the footprint down from 225MB to 114MB, you can read our analysis here, this week Red Hat upped the ante when they announced a slimmed down Red Hat Enterprise Linux Atomic Base Image.

The new RHEL image weighs in at 75MB, compared to 192MB for the standard RHEL image. In this image, Red Hat has removed a number of packages that are deemed not necessary for container deployments, two of the most interesting removals are systemd and Python. Traditionally all RHEL installs have included python since the YUM package manager is written in Python. To get around this Red Hat has created a new mini package manager called microdnf. While microdnf is not as functional as YUM or as DNF, the next generation package manager for RHEL based distributions, it does just what is needed: install, remove and update packages.

I wanted to look at what else changed in the image so I pulled the RHEL Atomic image from Red Hat’s registry. If you don’t have access to the RHEL registry, you can take a look at the analysis of the image using the Anchore navigator here:

Note: This image is not available publicly on DockerHub.

For the rest of the analysis, I’m going to use Anchore’s command line tools.

First I need to analyze the image.

# anchore analyze --image=registry.access.redhat.com/rhel7-atomic

I’ve already analyzed the standard rhel 7 image so now I want to run a query to compare the packages installed in the RHEL Atomic image with the standard RHEL image using the show-pkg-diffs query.

# anchore query --image=registry.access.redhat.com/rhel7 show-pkg-diffs registry.access.redhat.com/rhel7-atomic


Package RHEL 7 RHEL Atomic
python-chardet 2.2.1-1.el7_1 Not Installed
librhsm Not Installed 0.0.1-1.el7
yum-plugin-ovl 1.1.31-40.el7 Not Installed
libuser 0.60-7.el7_1 Not Installed
json-glib Not Installed 1.0.2-1.el7
python-urlgrabber 3.10-8.el7 Not Installed
libblkid 2.23.2-33.el7 Not Installed
audit-libs 2.6.5-3.el7_3.1 Not Installed
libsolv Not Installed 0.6.20-5.el7
xz 5.2.2-1.el7 Not Installed
file-libs 5.11-33.el7 Not Installed
rpm-build-libs 4.11.3-21.el7 Not Installed
python-libs 2.7.5-48.el7 Not Installed
qrencode-libs 3.4.1-3.el7 Not Installed
gdbm 1.10-8.el7 Not Installed
cryptsetup-libs 1.7.2-1.el7 Not Installed
dbus-libs 1.6.12-17.el7 Not Installed
tar 1.26-31.el7 Not Installed
dbus-glib 0.100-7.el7 Not Installed
cracklib-dicts 2.9.0-11.el7 Not Installed
kmod 20-9.el7 Not Installed
systemd 219-30.el7_3.7 Not Installed
subscription-manager 1.17.15-1.el7 Not Installed
libpwquality 1.2.3-4.el7 Not Installed
pygpgme 0.3-9.el7 Not Installed
python-dmidecode 3.10.13-11.el7 Not Installed
pyliblzma 0.5.3-11.el7 Not Installed
device-mapper 1.02.135-1.el7_3.3 Not Installed
kmod-libs 20-9.el7 Not Installed
shadow-utils 4.1.5.1-24.el7 Not Installed
python-pycurl 7.19.0-19.el7 Not Installed
libcap-ng 0.7.5-4.el7 Not Installed
python-rhsm-certificates 1.17.9-1.el7 Not Installed
kpartx 0.4.9-99.el7_3.1 Not Installed
python-iniparse 0.4-9.el7 Not Installed
microdnf Not Installed 2-3.el7.1.1
pam 1.1.8-18.el7 Not Installed
cracklib 2.9.0-11.el7 Not Installed
procps-ng 3.3.10-10.el7 Not Installed
pyxattr 0.5.1-5.el7 Not Installed
vim-minimal 7.4.160-1.el7_3.1 Not Installed
python 2.7.5-48.el7 Not Installed
python-rhsm 1.17.9-1.el7 Not Installed
python-ethtool 0.8-5.el7 Not Installed
cpio 2.11-24.el7 Not Installed
libutempter 1.1.6-4.el7 Not Installed
device-mapper-libs 1.02.135-1.el7_3.3 Not Installed
systemd-libs 219-30.el7_3.7 Not Installed
dmidecode 3.0-2.el7 Not Installed
m2crypto 0.21.1-17.el7 Not Installed
hardlink 1.0-19.el7 Not Installed
rpm-python 4.11.3-21.el7 Not Installed
yum-utils 1.1.31-40.el7 Not Installed
dbus-python 1.1.1-9.el7 Not Installed
python-dateutil 1.5-7.el7 Not Installed
librepo Not Installed 1.7.16-1.el7
util-linux 2.23.2-33.el7 Not Installed
usermode 1.111-5.el7 Not Installed
yum-metadata-parser 1.1.4-10.el7 Not Installed
pygobject3-base 3.14.0-3.el7 Not Installed
dracut 033-463.el7 Not Installed
rootfiles 8.1-11.el7 Not Installed
ustr 1.0.4-16.el7 Not Installed
elfutils-libs 0.166-2.el7 Not Installed
diffutils 3.3-4.el7 Not Installed
dbus 1.6.12-17.el7 Not Installed
libuuid 2.23.2-33.el7 Not Installed
gdb-gdbserver 7.6.1-94.el7 Not Installed
libmount 2.23.2-33.el7 Not Installed
libxml2-python 2.9.1-6.el7_2.3 Not Installed
yum 3.4.3-150.el7 Not Installed
virt-what 1.13-8.el7 Not Installed
libdnf Not Installed 0.7.4-2.el7.el
libsemanage 2.5-5.1.el7_3 Not Installed
gzip 1.5-8.el7 Not Installed
passwd 0.79-4.el7 Not Installed
python-kitchen 1.1.1-5.el7 Not Installed
libnl 1.1.4-3.el7 Not Installed
binutils 2.25.1-22.base.el7 Not Installed
acl 2.2.51-12.el7 Not Installed

Here you’ll see there are 80 package differences. Six packages have been added to support the new package manager: librhsm, json-glib, libsolv, microdnf, librepo and libdnf.74 packages have been removed leaving just the minimum set of packages.
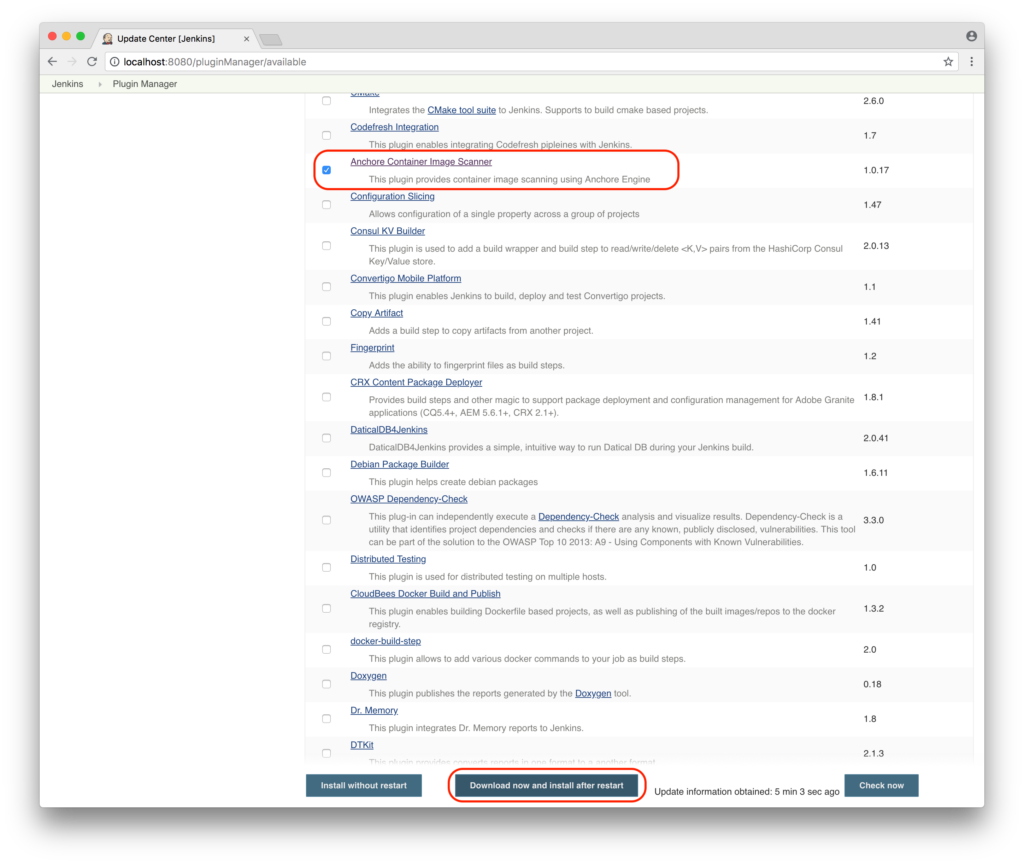
Out of interest, I wanted to see how this package list differed from Oracle’s slim image.

Package Oracle Linux Slim RHEL Atomic
python-chardet 2.2.1-1.el7_1 Not Installed
nss-tools 3.21.3-2.0.1.el7_3 3.21.3-2.el7_3
python-urlgrabber 3.10-8.el7 Not Installed
libxml2 2.9.1-6.0.1.el7_2.3 2.9.1-6.el7_2.3
audit-libs 2.6.5-3.el7 Not Installed
nss-sysinit 3.21.3-2.0.1.el7_3 3.21.3-2.el7_3
file-libs 5.11-33.el7 Not Installed
rpm-build-libs 4.11.3-21.el7 Not Installed
python-libs 2.7.5-48.0.1.el7 Not Installed
json-glib Not Installed 1.0.2-1.el7
gdbm 1.10-8.el7 Not Installed
nss 3.21.3-2.0.1.el7_3 3.21.3-2.el7_3
pyxattr 0.5.1-5.el7 Not Installed
yum-plugin-ovl 1.1.31-40.el7 Not Installed
basesystem 10.0-7.0.1.el7 10.0-7.el7
pygpgme 0.3-9.el7 Not Installed
coreutils 8.22-18.0.1.el7 8.22-18.el7
shadow-utils 4.1.5.1-24.el7 Not Installed
python-pycurl 7.19.0-19.el7 Not Installed
libcap-ng 0.7.5-4.el7 Not Installed
bash 4.2.46-21.0.1.el7_3 4.2.46-21.el7_3
python-iniparse 0.4-9.el7 Not Installed
microdnf Not Installed 2-3.el7.1.1
librhsm Not Installed 0.0.1-1.el7
kernel-container 3.10.0-0.0.0.2.el7 Not Installed
gobject-introspection Not Installed 1.42.0-1.el7
python 2.7.5-48.0.1.el7 Not Installed
cpio 2.11-24.el7 Not Installed
yum-utils 1.1.31-40.el7 Not Installed
pyliblzma 0.5.3-11.el7 Not Installed
rpm-python 4.11.3-21.el7 Not Installed
librepo Not Installed 1.7.16-1.el7
yum-metadata-parser 1.1.4-10.el7 Not Installed
libsolv Not Installed 0.6.20-5.el7
ustr 1.0.4-16.el7 Not Installed
oraclelinux-release 7.3-1.0.4.el7 Not Installed
diffutils 3.3-4.el7 Not Installed
redhat-release-server 7.3-7.0.1.el7 7.3-7.el7
libxml2-python 2.9.1-6.0.1.el7_2.3 Not Installed
yum 3.4.3-150.0.1.el7 Not Installed
libdnf Not Installed 0.7.4-2.el7.el
libsemanage 2.5-5.1.el7_3 Not Installed
python-kitchen 1.1.1-5.el7 Not Installed
gpg-pubkey ec551f03-53619141 Not Installed

Ignoring the version differences, there are 7 packages in RHEL Atomic not present in the Oracle Slim image which support the new microdnf package manager. There are 28 packages in Oracle Slim that are not in the RHEL Atomic image – unsurprisingly most of these relate to the inclusion of YUM. It will be interesting to see if Oracle Linux and the other RHEL derivatives follow suit and use microdnf in their images.

This is a great step forward for RHEL users, reducing the image size and the attack surface but still leaves a lot of, arguably, unnecessary content in the image. Take a look at the files view in the content tab of the Anchore Navigator for this image here and, as we did for Alpine earlier, filter for /bin to see the utilities and other libraries installed in the image.

At this point, the challenge in reducing the image further is that most of the packages left are required either in whole or more likely in part due to dependencies. For example, you could argue that there is no good reason to have the /bin/chmod command in the image however that is part of the coreutils package which is required by multiple other packages so any further steps forward will require some major changes in packaging.

If you have a Red Hat Enterprise Linux subscription I’d encourage you to check out the new Atomic base image and see how you can reduce the footprint and attack surface of your RHEL based images.

And whether you use RHEL, CentOS, Debian, Ubuntu, Alpine or other distributions you can use Anchore’s image analysis and compliance tools to ensure that the images you deploy meet your security and best practices requirements.

Improved Jenkins Integration

Today we have released an update to our popular open source Jenkins plugin adding a number of powerful new features.

Using Anchore’s freely available and open source Jenkins plugin you can secure your Jenkins pipeline in less than 30 minutes adding image scanning including not just CVE based security scans but policy-based scans that can include checks around security, compliance and operational best practices.

The first new feature to highlight is an updated user interface that improves both the aesthetic and the functionality of the UI. In the first screenshot below you can see that while the build has succeeded we have raised a number of warnings.

  •     The container was built from a base image with the tag latest rather than from a specific named tag
  •     The Dockerfile does not include any health check instructions which would simplify ongoing monitoring of the service.
  •     The acme-logging package has not been installed which is a recommended package for this organization.

Policies are customizable, along with whitelists, and are typically defined by the Security or Operations team.

The Policy evaluation summary is always produced by the Anchore plugin, however, there are other reports that a user can define to be run during the CI/CD pipeline.

In the first example, you can see a package manifest that has been produced – both in the form of a searchable web interface but also as a JSON file in the Jenkins project workspace that contains machine-readable output.

In the final example, we see a report detailing the difference in packages between the base image and the final image produced by the build.


Select:   Manage Jenkins > Manage Plugins > Updates

If you are already running the Anchore Jenkins plugin then you can update the Anchore plugin directly from the Jenkins web interface. At the time of writing the latest version of the plugin is version 1.0.7.

If you are not running Anchore’s plugin, there is detailed instructions on the following page.

The second interesting new feature is support for Jenkins Pipelines. In our previous examples, we have illustrated the use of Anchore within a Jenkins Freestyle Project which is the traditional way of architecting a Jenkins build, using the Jenkins web interface to define projects, adding build steps, scripts, etc.

In the Pipeline model, the entire build process is defined as code in a Jenkinsfile. This file can be created, edited and managed in the same way as any other artifact of your software project. For example, you can check your pipeline definition into your source control system, dynamically create the build instructions based on the configuration of your application or perform countless other forms of automation.

Pipeline builds can be more complex including forks/joins and parallelism. The pipeline is more resilient and can survive the master node failure and restarts. Pipelines are written in Groovy scripts and to add an Anchore scan you need to add the following simple code snippet.

node {
def imageLine = IMAGE + ' ' + env.WORKSPACE + '/DockerFile'
writeFile file: 'anchore_images', text: imageLine
anchore name: 'anchore_images', policyName: 'anchore_policy', bailOnFail: false, inputQueries: [[query: 'list-packages all'], [query: 'cve-scan all']]
}

Here the IMAGE is the ID of the container image that was just created. This could be in the form of an image ID (short or long-form), for example, 67591570dd29. Or the REPO/TAG can be used -for example, webapp/frontend:123456.

This code snippet writes out the anchore_images file that is used by the plugin to define which images are to be scanned.

The Dockerfile is read from the project workspace as is the file containing the policy that you wish to evaluate against the image, in this case, we have called the policy file anchore_policy and have stored this file in the project’s workspace.

This code snippet can be crafted by hand or built using the Jenkins UI.

Select:  Pipeline Syntax from the Project

This will launch the Snippet Generator where you can enter the required parameters and press the Generate Pipeline Script button which will produce the required snippet.

It’s quick and easy to add Image scanning and policy to your Jenkins project and we’re here to help.

If you have any questions or would like to learn more you can join our slack channel by clicking the button below or fill out the form to send us a direct message.

Updates to Anchore Open Source Project

What’s going on in the world of Anchore’s open source platform? As you might know, Anchore has an online container image navigator that provides unique visibility into the contents of container images–our system is constantly watching for updates to public container repositories, and runs a series of comprehensive analyses for every new revision. You can see how containers change over time, what packages and files have been installed, and if any known security vulnerabilities have been fixed or introduced. In our most recent update, we’ve added features to let you subscribe to images you are particularly interested in and request that we scan specific images that we may not already be processing.

Underneath the web UI that we host, that functionality is driven by our open source Anchore Engine, which you can run locally to do a wide variety of queries on your on-premise container images. There is a lot of functionality built into the tools: package queries for a number of different packaging formats including RPM, dpkg, Ruby Gem, and Node packages, and scans for known security vulnerabilities. There is also a “multitool” called anchore-toolbox that can show you a variety of other information about your containers, including the Dockerfile used to create the image, its family tree relative to other containers, and it can simply unpack a container into a directory on the filesystem for troubleshooting or examination by other tools.

We are also working on improvements to the packaging and deployment of our OSS tools. We are going to be expanding API access for easier integration into different deployment pipelines, and shipping a pre-built container image for multi-user environments. Stay tuned for updates on this effort: you can watch our progress on our GitHub page. If you’re interested in contributing to the project, here are some ways to get started:

Finally, we are planning on continuing our efforts to build useful integrations with third-party tools such as Jenkins. We know that a successful production container pipeline is made up of at least several components, and we want it to be as easy as possible to connect Anchore’s analysis and gating functionality into your own environment and make sure that every container you ship to production is safe, secure, and configured appropriately. Check out a detailed intro to our Jenkins plugin for more info.

We know that an open source project’s success depends on its community, so we want to hear from you. Stop by and say Hi, and we hope you enjoy using Anchore for all of your container analysis needs!

Slimming Down Images

Oracle just announced a new container image: Oracle Linux 7-Slim.

Their goal was to create a more lean image and improve security in the process, since reducing the footprint of the container also reduces the attack surface.

You can check out that image here using Anchore Navigator where you can see that the image weighs in at a little over 100MB, compared to the standard Oracle Linux image which is over twice that size. While that’s nowhere near as small as Alpine, which is a minuscule 4MB, Oracle’s base image is much smaller than the other major Linux distros.

The Anchore service, which powers the Navigator, tracks the most popular images on DockerHub along with images requested by registered users, so when a new image is published we pull down the image and perform our detailed analysis. From that data we can tell that Oracle does a good job of regularly updating their base image and usually this image has no security vulnerabilities (CVEs) as it’s updated frequently. You can subscribe to any image on the Navigator to receive notifications when the TAGs are updated – for example when Oracle updated their standard image on the 21st of February all users who subscribed to that image received email notification.

Last month we blogged about how you can use Anchore to compare images to see what has changed so today we took a look at the new Oracle slim image to see how Oracle shaved around 100MB off the image.

For those who want to follow along you can use the following command:

# anchore query --image=oraclelinux show-pkg-diffs oraclelinux:7-slim


Package Oracle Linux Oracle Linux Slim
procps-ng 3.3.10-10.el7 Not Installed
openssh-clients 6.6.1p1-33.el7_3 Not Installed
libuser 0.60-7.el7_1 Not Installed
oracle-logos 70.0.3-4.0.7.el7 Not Installed
tar 1.26-31.el7 Not Installed
json-c 0.11-4.el7_0 Not Installed
iputils 20160308-8.el7 Not Installed
pygobject2 2.28.6-11.el7 Not Installed
rhnsd 5.0.13-5.0.1.el7 Not Installed
rhn-check 2.0.2-8.0.4.el7 Not Installed
xz 5.2.2-1.el7 Not Installed
iproute 3.10.0-74.0.1.el7 Not Installed
libmnl 1.0.3-7.el7 Not Installed
python-hwdata 1.7.3-4.el7 Not Installed
rsyslog 7.4.7-16.0.1.el7 Not Installed
bind-license 9.9.4-38.el7_3.2 Not Installed
pam 1.1.8-18.el7 Not Installed
acl 2.2.51-12.el7 Not Installed
dbus-glib 0.100-7.el7 Not Installed
cracklib-dicts 2.9.0-11.el7 Not Installed
vim-minimal 7.4.160-1.el7_3.1 Not Installed
systemd 219-30.0.1.el7_3.6 Not Installed
libpwquality 1.2.3-4.el7 Not Installed
libnetfilter_conntrack 1.0.4-2.el7 Not Installed
python-dmidecode 3.10.13-11.el7 Not Installed
newt-python 0.52.15-4.el7 Not Installed
hostname 3.13-3.el7 Not Installed
libestr 0.1.9-2.el7 Not Installed
device-mapper 1.02.135-1.el7_3.2 Not Installed
rhnlib 2.5.65-2.0.1.el7 Not Installed
passwd 0.79-4.el7 Not Installed
yum-rhn-plugin 2.0.1-6.0.1.el7 Not Installed
kpartx 0.4.9-99.el7_3.1 Not Installed
libblkid 2.23.2-33.0.1.el7 Not Installed
dracut 033-463.0.1.el7 Not Installed
python-gudev 147.2-7.el7 Not Installed
policycoreutils 2.5-11.0.1.el7_3 Not Installed
cracklib 2.9.0-11.el7 Not Installed
iptables 1.4.21-17.el7 Not Installed
fipscheck 1.4.1-5.el7 Not Installed
yum-plugin-ulninfo 0.2-13.el7 Not Installed
dbus-libs 1.6.12-17.0.1.el7 Not Installed
kmod 20-9.el7 Not Installed
openssh-server 6.6.1p1-33.el7_3 Not Installed
GeoIP 1.5.0-11.el7 Not Installed
systemd-libs 219-30.0.1.el7_3.6 Not Installed
python-ethtool 0.8-5.el7 Not Installed
bind-libs-lite 9.9.4-38.el7_3.2 Not Installed
libutempter 1.1.6-4.el7 Not Installed
device-mapper-libs 1.02.135-1.el7_3.2 Not Installed
sysvinit-tools 2.88-14.dsf.el7 Not Installed
m2crypto 0.21.1-17.el7 Not Installed
hardlink 1.0-19.el7 Not Installed
libgudev1 219-30.0.1.el7_3.6 Not Installed
dbus-python 1.1.1-9.el7 Not Installed
dhcp-libs 4.2.5-47.0.1.el7 Not Installed
slang 2.2.4-11.el7 Not Installed
util-linux 2.23.2-33.0.1.el7 Not Installed
usermode 1.111-5.el7 Not Installed
libnl 1.1.4-3.el7 Not Installed
newt 0.52.15-4.el7 Not Installed
dhclient 4.2.5-47.0.1.el7 Not Installed
libnfnetlink 1.0.1-4.el7 Not Installed
qrencode-libs 3.4.1-3.el7 Not Installed
rootfiles 8.1-11.el7 Not Installed
elfutils-libs 0.166-2.el7 Not Installed
libedit 3.0-12.20121213cvs.el7 Not Installed
tcp_wrappers-libs 7.6-77.el7 Not Installed
pyOpenSSL 0.13.1-3.el7 Not Installed
openssh 6.6.1p1-33.el7_3 Not Installed
dbus 1.6.12-17.0.1.el7 Not Installed
libuuid 2.23.2-33.0.1.el7 Not Installed
logrotate 3.8.6-12.el7 Not Installed
dhcp-common 4.2.5-47.0.1.el7 Not Installed
cryptsetup-libs 1.7.2-1.el7 Not Installed
libmount 2.23.2-33.0.1.el7 Not Installed
initscripts 9.49.37-1.0.1.el7 Not Installed
kmod-libs 20-9.el7 Not Installed
rhn-client-tools 2.0.2-8.0.4.el7 Not Installed
hwdata 0.252-8.4.el7 Not Installed
gzip 1.5-8.el7 Not Installed
fipscheck-lib 1.4.1-5.el7 Not Installed
libselinux-utils 2.5-6.el7 Not Installed
binutils 2.25.1-22.base.el7 Not Installed
rhn-setup 2.0.2-8.0.4.el7 Not Installed

Here you can see that 85 packages were removed from the standard image. Some of the removals are obvious optimizations – removing unneeded utilities and libraries and others are notable as they highlight some interesting issues in the regular image – for example, openssh-server has been removed – which you might argue has no business being installed in a container image in the first place.

There are other changes such as the removal of dbus and kmod that really go to highlight how many containers are being built today. I’d argue that in many cases organizations aren’t deploying microservices they are deploying microVMs. Many images look like a whole operating system but just packaged up in a Docker image. There’s a lot of other fat that can be trimmed from most containers – for example take a look at the contents of this image: navigate to the contents tab, look at the files view and filter for /bin and while you scroll through the 51 pages ask if these binaries are really needed in your image.

There’s a lot of work still to be done by most Linux distro vendors to build more efficient and more secure images. Removing selected RPMs and DEBs helps but the size and scope of many of the operating system packages still lead to more content being installed that is required.

One cautionary note:

While size certainly does matter it should not be your only consideration in selecting a base image to use from DockerHub or any other registry.

Ensure that the image is well maintained – for example, check that it gets updated frequently enough to meet your needs. Is the content coming from known-good sources? You certainly don’t want to bring in packages from an unknown origin. Are the operating system packages being maintained and tested including security fixes with published CVE security feeds, is the default out-of-the-box configuration secure?

Anchore can help you answer those questions – whether it’s by using the Navigator to pre-screen images for security issues and to view update history or by building custom policies that define your own rules for certifying your containers.

Keeping Secrets

Docker recently announced an exciting new release of Docker Datacenter that included Integrated Secrets Management from Docker 1.13. Many containers need access to sensitive information as part of their configuration, for example, they may need the password to access a database or the API key to access web services. These secrets need to be securely passed to the running container. In the past various other mechanisms have been used to pass secrets including using environment variables and volume mounting files from the host into the container. Each of these, and other, alternatives have their own individual drawbacks but all share the same issue: they store unencrypted secrets on the host that an administrator may be able to see. There are other solutions that can be used to securely manage secrets, for example, the popular Vault project from HashiCorp, however, having integrated secrets management is a great step forward.

As many organizations are now moving away from legacy approaches such as environment variables and volumes to pass secrets to using Docker’s new integrated secrets management or 3rd party solutions such as Vault it is important to ensure that you are not already inadvertently including sensitive information such as passwords, certificates and API keys within your image.

During testing and development, it is very easy to leave artifacts such as private certificates or keys within your image to simplifying testing and in many cases these can inadvertently be carried forward into your production deployment. The most famous example of this occurred last summer when Twitter’s now-defunct Vine service was analyzed by a security researcher who found that they had mistakenly disabled authentication on their Internet-facing Docker registry. The researcher was able to pull Vine’s images down to his laptop and inspect them. Within these images, he found API keys, source code and other secrets.

While many users are scanning their images for CVEs, an image may pass this basic check but may still be insecure, misconfigured or in some other way out of compliance. Container images typically contain hundreds, often thousands of files – some coming from operating system packages, some from configuration files, some from 3rd party software libraries such as Node.JS NPMs, Ruby GEMs, Python modules, Java Archives, and some may be supplied by the user. Each one of these artifacts should undergo the same level scrutiny as the operating system packages. One of the critical checks that should be performed before an image is deployed is to ensure that it does not contain source code, sensitive configuration information and secrets such as API keys and passwords.

Anchore takes a very different approach to image security than traditional image scanners that look for CVEs. Using Anchore users can define policies that specify rules to govern security vulnerabilities, package whitelists and blacklists, configuration file contents, presence of credentials in an image, manifest changes, exposed ports or any user-defined checks. These policies can be deployed site-wide or customized for specific images or categories of applications.

You can read more about Anchore’s policy-based approach, however, if you want to take a more practical approach you can use open source Anchore Engine to inspect your own images and look for secrets. The following guide will walk you through setting up Anchore and analyzing your images, it should take no more than 10 minutes.

There are a number of ways to install Anchore including using operating system packages, PIP or even via a container. In this example, I’m using a CentOS 7 host that is already running Docker. If the system is not already configured to use the Extra Packages for Enterprise Linux (EPEL) repository then I need to run:

# yum install epel-release

Installing Anchore is as simple as installing a YUM repo file and then installing a single package.

# yum install http://repo.ancho.re/anchore/1.1/centos/7/noarch/anchore-release-1.1.0-1.el7.centos.noarch.rpm
# yum install anchore

At this point Anchore is installed, all we need to do now is run a sync to download the latest security data from the Anchore service.

# anchore feeds sync

Now we are ready to analyze containers.
Presuming the container image has been pulled to the localhost you can simply run the analyze command. In my example, I’m analyzing the myapp:latest image.

# anchore analyze --image=myapp:latest

If the Dockerfile is available then you can pass the Dockerfile to the anchore command, this provides a little more information to the analysis routine but is not required.

# anchore analyze --image=myapp:latest --dockerfile=/path/to/my/Dockerfile

We can now run a policy check on the image.
The default policy does not perform any checks for secrets but we can easily add that check.
Create a file named mypolicy and enter the following lines:

DOCKERFILECHECK:NOTAG:STOP
DOCKERFILECHECK:SUDO:GO
DOCKERFILECHECK:EXPOSE:STOP:DENIEDPORTS=22
DOCKERFILECHECK:FROMSCRATCH:WARN
DOCKERFILECHECK:NOFROM:STOP
SUIDDIFF:SUIDFILEDEL:GO
SUIDDIFF:SUIDMODEDIFF:STOP
SUIDDIFF:SUIDFILEADD:STOP
PKGDIFF:PKGVERSIONDIFF:STOP
PKGDIFF:PKGADD:WARN
PKGDIFF:PKGDEL:WARN
ANCHORESEC:VULNUNKNOWN:GO
ANCHORESEC:VULNHIGH:STOP
ANCHORESEC:VULNMEDIUM:WARN
ANCHORESEC:VULNLOW:GO
ANCHORESEC:VULNCRITICAL:STOP
ANCHORESEC:UNSUPPORTEDDISTRO:WARN
FILECHECK:FILENAMEMATCH:STOP:FILECHECK_NAMEREGEXP=.*/.ssh/id_rsa$

The last line uses the FILECHECK policy check. Here we are looking at a list of all the files in the image and using a regular expression to look for any private ssh keys in the image.
The FILECHECK policy module (or gate) can do matching on filenames or on filecontents, for example looking for specific strings within any file in the image. In this example, we are simply looking for ssh keys.

# anchore gate  --image=myapp:latest --policy=/path/to/mypolicy

In my test image policy check returns two lines. The last line gives the final result of the policy check issuing a “STOP” meaning that the image has failed. The first line shows the policy that triggered this failure. Depending on your image you may see more or fewer policy violations.

+--------------+-------------------+-----------+---------------+-------------------+-------------+
| Image Id     | Repo Tag          | Gate      | Trigger       | Check Output      | Gate Action |
+--------------+-------------------+-----------+---------------+-------------------+-------------+
| 9f767c5486f4 | aic-secret:latest | FILECHECK | FILENAMEMATCH | application of    | STOP        |
|              |                   |           |               | regexp matched    |             |
|              |                   |           |               | file found in     |             |
|              |                   |           |               | container: file=/ |             |
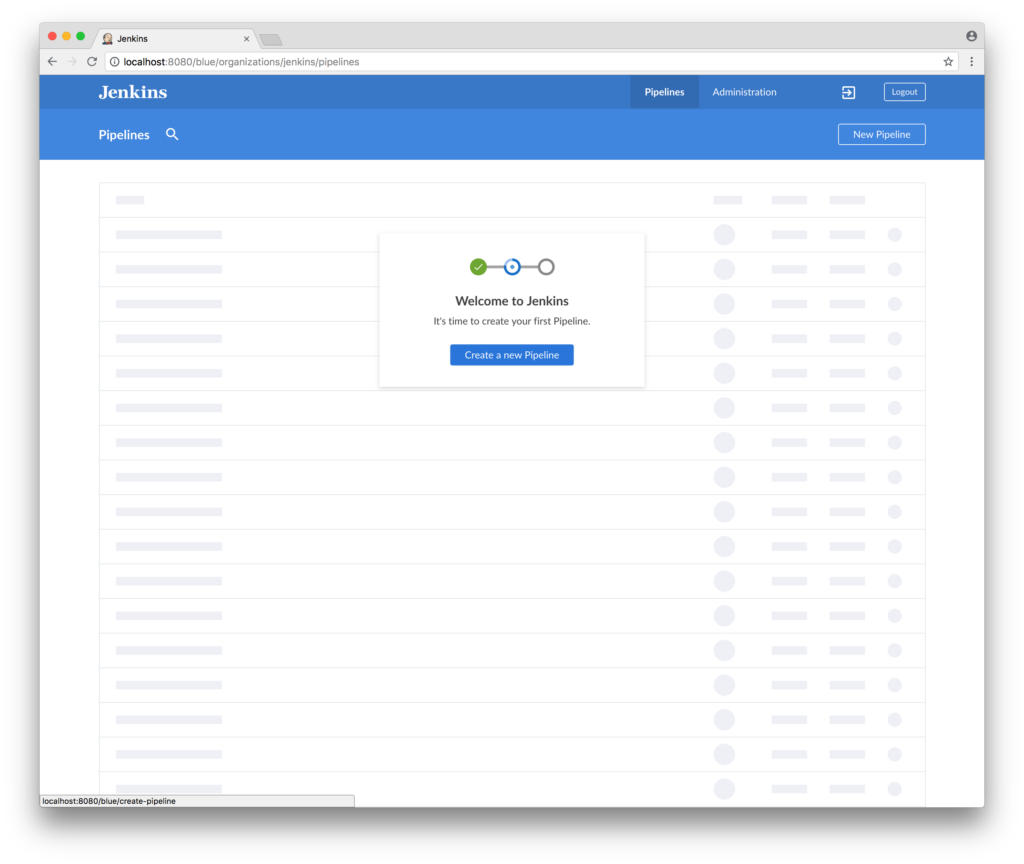
|              |                   |           |               | root/.ssh/id_rsa  |             |
|              |                   |           |               | regexp=.*/.ssh/id |             |
|              |                   |           |               | _rsa$             |             |
| 9f767c5486f4 | aic-secret:latest | FINAL     | FINAL         |                   | STOP        |
+--------------+-------------------+-----------+---------------+-------------------+-------------+

This simple policy performs just a few checks on your image and in the case of secrets only looks for private SSH keys however this policy can easily be extended to look for any secrets or blacklisted artifacts in your image.

Anchore 1.1 Has Arrived

We started the week with an exciting announcement about the Anchore Navigator which received a significant update with many new features, the two new features that are proving to be the most popular are the ability submit an image for analysis and the ability to subscribe to receive notifications when an image has been updated. But that’s not the only release that Anchore is announcing this week.

We are proud to announce the 1.1 release of the Anchore’s open source project. The open source engine is at the heart of all of our products – the Navigator, our SaaS service and our on-premise solution. The team at Anchore believes strongly in open source and especially in the need for open source solutions around compliance and governance.

How do you have confidence in a certification test if you don’t know that the test is being performed accurately and without any bias? By building the solution on top of an open source engine with compliance policies that are publicly available, anyone can re-run these tests to verify the results, in short, you can “trust but verify”.

The Most Notable Improvements in the 1.1 Release


  • Support for Ruby Gems

    Anchore now supports detailed scanning for Ruby Gems. All Gems within the container image are reported including their name, version, origin, source, license and location. Anchore’s commercial release now includes a Gem data feed that provides detailed information about Ruby Gems published on the official Gem repository and this information can be used during policy evaluations. For example to check if a Gem comes from the official repository or to report on Ruby Gems that are not up to date. Other policy checks include blacklisting and license checking.

  • CVE scanning for Alpine Linux

    Previously Anchore could report on files and packages within Alpine Linux based images but not report on CVEs. This release adds support for scanning Alpine images and reporting on known CVEs based on the vulnerability data found in Alpine’s security database and within the National Vulnerability Database (NVD) maintained by NIST.

  • Global Whitelisting

    Anchore supports the creation of whitelists on a per-image basis – for example, “exclude CVE-2015-8710 from policy evaluation for image myapp:latest”. The 1.1 release allows a global whitelist to be created allowing organizations to define a curated list of CVEs or other policy checks that are globally excluded during policy evaluation.

  • Debian CVE scanning

    Debian CVE reporting has been updated and will show the binary package that contains the CVE rather than the corresponding source package.

  • UX and performance

    A number of additional improvements have been made to improve user experience – for example simplifying command line options and to improve the performance of scanning.

More details can be found in the changelog on GitHub.

You learn more about our open source release here or contact us using the form below to schedule a 1-on-1 product demonstration.

A Better Way to Navigate Container Registries

In October 2016 Anchore announced the first release of our commercial product, built on top of our open source container analysis engine. The focus of the open source project and the commercial offering is to deliver tools that perform deep analysis on container images and allow organizations to define policies that govern the deployment of their containers, ensuring that only containers that comply with the organization’s security policy or operational best practices are deployed.

At the same time, we also released the Anchore Navigator which provided a free service to allow users to discover and analyze images on public container registries. At launch, the Navigator included in-depth analysis of all official repositories on DockerHub and 50 of the most popular repositories. Then early in December, we updated the Navigator to add support for basic analysis of all public images on DockerHub allowing users to view basic information such as the image size, layer information, image ID, Digest and creation date.

Today we are announcing a new release of the Navigator that adds a number of powerful new features to this free SaaS service.

Submit Images for Analysis

The first new feature adds the ability for users to submit any public tagged image to Anchore for analysis.

At the top of the preview page for an image, there is a button to submit the image for analysis.
Once submitted this TAG is added to Anchore’s catalog and will be queued up to be downloaded and analyzed. After the first analysis, Anchore will poll the registry for changes and will download new versions of the TAG for analysis whenever the TAG is updated.

Subscriptions

Another powerful new feature is Subscriptions. Users can subscribe to a TAG and will be notified when the TAG is updated. For example, if you use ubuntu:latest as the base image for your containers then when the Ubuntu community push a new ubuntu:latest image to the registry you will receive a notification email from Anchore. Webhook notifications will be added in an upcoming release.

Images can be marked as “favorites” to allow users to quickly access these images.

Organizing Images

A new option has been added on the menu bar for “My Images”

Within the ‘My Images’ page users can view their favorite and subscribed images and quickly see the status of these images – for example, to see when an image was last updated.

Ruby Gems Support

In addition to operating system packages, all files and Node.JS NPMs the Navigator now allows you to see a detailed list of all Ruby GEMs installed in the image, showing details of the packages, including version, license, location and Origin.

Support for Alpine Linux

Anchore Navigator now supports CVE scanning of Alpine Linux images, incorporating security feeds from the Alpine Projects Vulnerabilities database and the National Vulnerabilities Database.

Registry Support

The Navigator has been built to support multiple registries both public and private registries and to analyze images in Docker’s native format and the upcoming Open Containers Initiative (OCI) Image Format. Over the coming months, more registries including private ISV registries will be included within the Navigator’s catalog.

There are more interesting features in development including support for WebHook and Slack notifications, support for deeper analysis of Python libraries and Java Archives along with the ability to analyze private images and define custom policies and whitelists in the commercial Navigator offering.

Comparing Images

As anyone who has worked in IT support or operations for any period of time will tell you, if you get a call telling you that something stopped working, then the first question you should ask is “what changed?”. This is especially true if the application or server in question has been working well for sometime before.

Keeping track of what changed, or preventing changes from occurring is an important part of IT today, so much so that there is a large ecosystem of vendors and open source projects covering change/release management and monitoring.

Knowing just that something has changed is a good first step but you really need to know the details of what changed. The most common way to do this is to look at the changelog.

Maintaining a changelog for your application or other software project is considered best practice today and it is important to make sure the changelog is well structured and contains all relevant, but notable, information. As one great resource explains “Don’t let your friends dump git logs into CHANGELOGs”.

Operating system vendors typically create release notes that provide a high-level summary of the notable changes in a release, for example in the release notes for CentOS 7.3 and these vendors also include changelogs for individual software packages. For example:
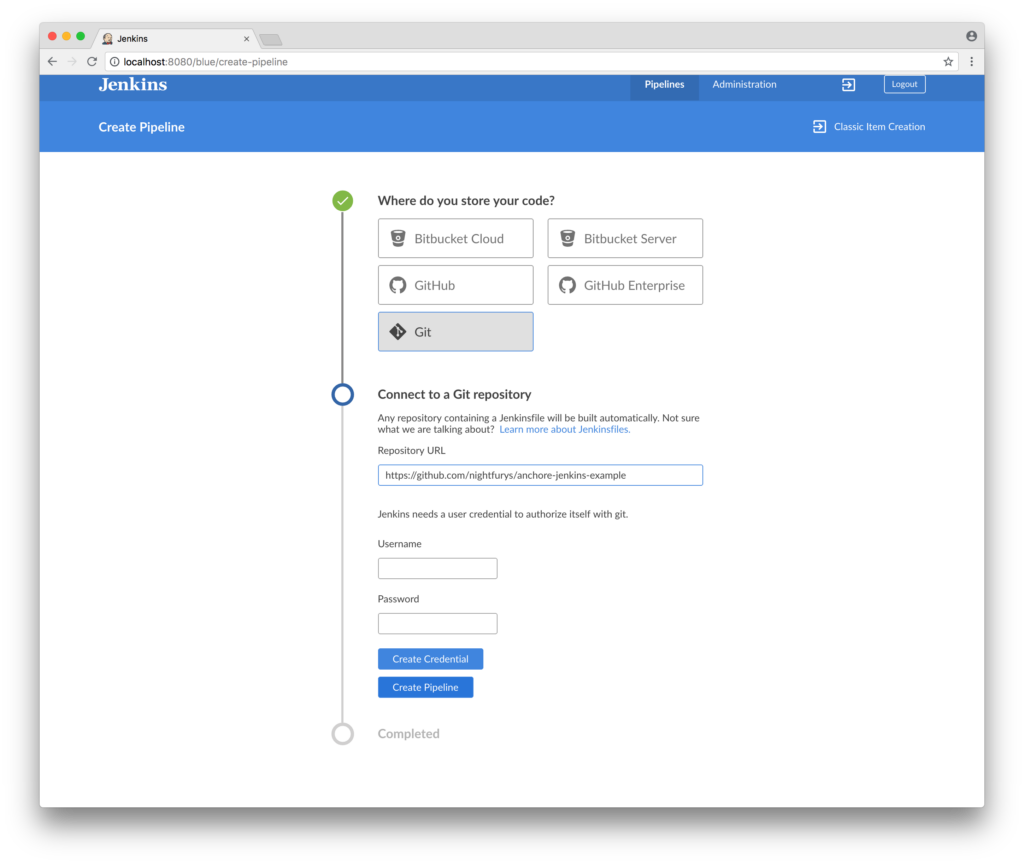
# rpm -q --changelog glibc
* Fri Dec 23 2016 Carlos O'Donell <[email protected]> - 2.24-4
- Auto-sync with upstream release/2.24/master,
 commit e9e69e468039fcd57276f783a16aa771a8e4214e, fixing:
- Shared object unload assert when calling dlclose (#1398370, swbz#11941)
- Fix runtime resolver routines in the presence of AVX512 (swbz#20508)
- Fix writes past the allocated array bounds in execvpe (swbz#20847)
- Fix building with GCC 6.2 on i686 with stack protector.
- Fix building with GCC 7.
- Fix POWER6 memset with recent binutils.
- Fix POWER math test expected failures.
- Fix cancellation in posix_spawn.
- Fix multiarch builds for POWER9.
…

But in the world of containers things aren’t quite so easy. Containers are, by design, opaque.
A user downloads an application container for the application they want, for example, NGINX, and may not know how that container is built, for example, what operating system is used under the covers, let alone what changes were made between releases.

There are no easy ways to perform a “diff” on Docker container images to see what has changed between versions. While there is a docker diff command this command shows what files have changed in a running container but will not show changes between container images. You could also look at the Dockerfile, however, the same Dockerfile used at two different times will likely produce different images since the underlying operating system packages and application files may have been updated.

So today we want to show you how you can compare two container images to see what changes have been made.

For this example, I’ll compare the latest version of the CentOS image with the previously published version.

If you want to visually inspect the latest CentOS image you can do so using Anchore Navigator you can simply search for CentOS and then select the ‘latest’ tag or you can go directly to this link:

Here you can see that this image was last updated on the 15th of December.

I’m going to pull down this image to my local machine by running

# docker pull centos:latest

Running docker images  on my local machine will show this latest version of CentOS, however, if I don’t have the previous centos:latest image I need to pull that image from Docker Hub.

While it’s simple to get the current centos:latest image from Docker Hub it’s not quite so easy to find the previous version, however, that’s something that Anchore Navigator can help with. On the overview page of the centos:latest image you’ll see a Previous Image button in the top left, clicking that will take you to the previous version of centos:latest, or you can go directly there using this link.

In the screenshot below you can see that this version is no longer tagged, it’s still available on Docker Hub but no longer has the latest tag or any other tag. It was published on the 2nd of November and then replaced on the 15th of December.

One little known feature of Docker & Docker Hub is the ability to pull an image by its digest.

So you can click the  button next to the digest to copy the digest into the clipboard and then run the following command:

docker pull centos@sha256:b2f9d1c0ff5f87a4743104d099a3d561002ac500db1b9bfa02a783a46e0d366c

This will pull down the previous version of centos:latest.

Running docker images --digests centos will show the centos images along with their corresponding digests and IDs.

REPOSITORY     TAG                 DIGEST                                                                    IMAGE ID            CREATED             SIZE
docker.io/centos    latest              sha256:c577af3197aacedf79c5a204cd7f493c8e07ffbce7f88f7600bf19c688c38799   67591570dd29        3 weeks ago         191.8 MB
docker.io/centos                        sha256:b2f9d1c0ff5f87a4743104d099a3d561002ac500db1b9bfa02a783a46e0d366c   0584b3d2cf6d        9 weeks ago         196.5 MB
docker.io/centos                        sha256:2ae0d2c881c7123870114fb9cc7afabd1e31f9888dac8286884f6cf59373ed9b   980e0e4c79ec        4 months ago        196.7 MB
docker.io/centos    7.2.1511            sha256:0d121fa7987c60c3f7ecb8d7347d8e86683018625e44f3864e69b388087a4d0b   feac5e0dfdb2        4 months ago        194.6 MB
docker.io/centos    7.0.1406                                                                                      68c19b8863f0        6 months ago        210.2 MB
docker.io/centos    7.1.1503                                                                                      80d283436f62        6 months ago        212.1 MB

We will now use Anchore to analyze both images.

# anchore analyze --imagetype=none --image=centos:latest
# anchore analyze --imagetype=none --image=0584b3d2cf6d

Now that anchore has analyzed the images we can perform queries on the images.

# anchore query --image=centos:latest show-pkg-diffs 0584b3d2cf6d

This command will show the differences in package manifests between the two images, a portion of that output is included below:

+--------------+-------------------------+------------------+--------------------------+----------------------+--------------------------+
| Image Id     | Repo Tag                | Compare Image Id | Package                  | Input Image Version  | Compare Image Version    |
+--------------+-------------------------+------------------+--------------------------+----------------------+--------------------------+
| 67591570dd29 | docker.io/centos:latest | 0584b3d2cf6d     | nss-tools                | 3.21.3-2.el7_3       | 3.21.0-9.el7_2           |
| 67591570dd29 | docker.io/centos:latest | 0584b3d2cf6d     | python-urlgrabber        | 3.10-8.el7           | 3.10-7.el7               |
| 67591570dd29 | docker.io/centos:latest | 0584b3d2cf6d     | iputils                  | 20160308-8.el7       | 20121221-7.el7           |
| 67591570dd29 | docker.io/centos:latest | 0584b3d2cf6d     | expat                    | 2.1.0-10.el7_3       | 2.1.0-8.el7              |
| 67591570dd29 | docker.io/centos:latest | 0584b3d2cf6d     | audit-libs               | 2.6.5-3.el7          | 2.4.1-5.el7              |
| 67591570dd29 | docker.io/centos:latest | 0584b3d2cf6d     | gnupg2                   | 2.0.22-4.el7         | 2.0.22-3.el7             |
| 67591570dd29 | docker.io/centos:latest | 0584b3d2cf6d     | xz                       | 5.2.2-1.el7          | 5.1.2-12alpha.el7        |
| 67591570dd29 | docker.io/centos:latest | 0584b3d2cf6d     | nss-sysinit              | 3.21.3-2.el7_3       | 3.21.0-9.el7_2           |
| 67591570dd29 | docker.io/centos:latest | 0584b3d2cf6d     | file-libs                | 5.11-33.el7          | 5.11-31.el7              |
| 67591570dd29 | docker.io/centos:latest | 0584b3d2cf6d     | rpm-build-libs           | 4.11.3-21.el7        | 4.11.3-17.el7            |
| 67591570dd29 | docker.io/centos:latest | 0584b3d2cf6d     | libgcc                   | 4.8.5-11.el7         | 4.8.5-4.el7              |

This default formatting is designed for viewing in the terminal however you can use the --json or --plain command line options to produce output more suited to automated processing.

For example:

# anchore --json query --image=centos:latest show-pkg-diffs 0584b3d2cf6d

Anchore also includes a command to show what files have changed in an image.

# anchore  query --image=centos:latest show-file-diffs 0584b3d2cf6d
+--------------+-------------------------+------------------+-----------------------------------+-----------------------------------+-----------------------------------+
| Image Id     | Repo Tag                | Compare Image Id | File                              | Input Image File Checksum         | Compare Image Checksum            |
+--------------+-------------------------+------------------+-----------------------------------+-----------------------------------+-----------------------------------+
| 67591570dd29 | docker.io/centos:latest | 0584b3d2cf6d     | /usr/bin/signtool                 | d0fd71514d28636fa0afd28f2ce8a04dc | 3094cc4c9f8b507513bd945cad92b2098 |
|              |                         |                  |                                   | a9d837e45895900ce3a293adfec4adb   | b8d6bf84956bbf1adec828690fc48c6   |
| 67591570dd29 | docker.io/centos:latest | 0584b3d2cf6d     | /var/lib/yum/yumdb/l/8b0fec58c4cb | ec25c418f1f5d51128ddbf924e633b3c5 | NOTINSTALLED                      |
|              |                         |                  | 6f239014f68fff4b4f8681694628-libb | 102649304f1c1a106afccd061f6aa35   |                                   |
|              |                         |                  | lkid-2.23.2-33.el7-x86_64/checksu |                                   |                                   |
|              |                         |                  | m_data                            |                                   |                                   |
| 67591570dd29 | docker.io/centos:latest | 0584b3d2cf6d     | /usr/bin/sha224sum                | af0e2ff0d30605159cf6d79fc59055b1a | 5c233b844571c856ce9cb7059a88e0cf6 |
|              |                         |                  |                                   | 87fdff577358439844afcbc98ca1acf   | 0ee372d43f1f1cc4a02599b9d3ac8d0   |
| 67591570dd29 | docker.io/centos:latest | 0584b3d2cf6d     | /usr/lib64/python2.7/lib-         | 1506d2df911351ae57e0c498adfa3faa4 | f0c9c6f0f6b1597624c7bb4cb55d4f2d7 |
|              |                         |                  | dynload/_codecs_kr.so             | 408ca4df07466fafa69a10613b11922   | 9d319697dff3bf6ffb27fac47afc0f7   |
| 67591570dd29 | docker.io/centos:latest | 0584b3d2cf6d     | /var/lib/yum/yumdb/s/c13227f13b29 | NOTINSTALLED                      | DIRECTORY_OR_OTHER                |
|              |                         |                  | f6866c96d050aebd6098d7a62809-setu |                                   |                                   |
|              |                         |                  | p-2.8.71-6.el7-noarch/checksum_ty |                                   |                                   |
|              |                         |                  | pe                                |                                   |                                   |
| 67591570dd29 | docker.io/centos:latest | 0584b3d2cf6d     | /usr/share/licenses/device-       | NOTINSTALLED                      | 32b1062f7da84967e7019d01ab805935c |
|              |                         |                  | mapper-libs-1.02.107/COPYING      |                                   | aa7ab7321a7ced0e30ebe75e5df1670   |
| 67591570dd29 | docker.io/centos:latest | 0584b3d2cf6d     | /usr/lib64/gconv/DEC-MCS.so       | 5d098b7ce2079a621a0f99ae44f959f20 | 764b1597a91a39f799dd3f96051540864 |
|              |                         |                  |                                   | 15a1d64527650f2cc47982a4d9bd3ab   | 9089e7b2154541a630e92fa586c11f9   |
| 67591570dd29 | docker.io/centos:latest | 0584b3d2cf6d     | /var/lib/yum/yumdb/r/1f4b80c13100 | NOTINSTALLED                      | DIRECTORY_OR_OTHER                |
|              |                         |                  | 951f6f606b7ee0519abe674f0168-rpm- |                                   |                                   |
|              |                         |                  | build-                            |                                   |                                   |
|              |                         |                  | libs-4.11.3-17.el7-x86_64/reason  |                                   |                                   |
| 67591570dd29 | docker.io/centos:latest | 0584b3d2cf6d     | /usr/lib64/python2.7/symtable.pyc | 16eef0372b200028ae390b22dd1093b00 | 533e494e479e040772edfedfdc70c2923 |
|              |                         |                  |                                   | 772c6011002c8cfb08e01e183a55dfd   | 333ceeac3520f8ef42f170b74317425   |

The challenge with interpreting the output of this command is that nearly 4,000 files have changed since 80 packages have changed so there’s a lot of “noise” since these file changes are expected. We should still look for file changes since files that are not part of an operating system package may be changed, for example, configuration files or application files.

To make this easier the enterprise release of Anchore contains the new command to show the files that are now owned by an operating system package.

# anchore query --image=centos:latest show-non-packaged-files all /

The all parameter specifies that all changes should be displayed. We can use a number such as 2 to specify the depth of directories that are analyzed, for example using 2 would show just the top-level directories that contain changes.

+--------------+-------------------------+------------------------------------------------+
| Image Id     | Repo Tags               | File/Directory Name                            |
+--------------+-------------------------+------------------------------------------------+
| 67591570dd29 | docker.io/centos:latest | /var/log/anaconda/storage.log                  |
| 67591570dd29 | docker.io/centos:latest | /run/systemd/sessions                          |
| 67591570dd29 | docker.io/centos:latest | /run/user                                      |
| 67591570dd29 | docker.io/centos:latest | /tmp/yum.log                                   |
| 67591570dd29 | docker.io/centos:latest | /usr/lib/locale                                |
| 67591570dd29 | docker.io/centos:latest | /tmp/.X11-unix                                 |
| 67591570dd29 | docker.io/centos:latest | /etc/sysconfig/network-scripts                 |
| 67591570dd29 | docker.io/centos:latest | /usr/lib64/p11-kit-trust.so                    |
| 67591570dd29 | docker.io/centos:latest | /var/log/anaconda/ks-script-s0_pQV.log         |
| 67591570dd29 | docker.io/centos:latest | /usr/lib64/pkcs11                              |
| 67591570dd29 | docker.io/centos:latest | /etc/rsyslog.d                                 |
| 67591570dd29 | docker.io/centos:latest | /var/log/anaconda/ifcfg.log                    |
| 67591570dd29 | docker.io/centos:latest | /tmp/ks-script-LRoSA2                          |
| 67591570dd29 | docker.io/centos:latest | /lost+found                                    |
| 67591570dd29 | docker.io/centos:latest | /etc/crypttab                                  |
| 67591570dd29 | docker.io/centos:latest | /run/systemd/machines                          |
| 67591570dd29 | docker.io/centos:latest | /run/log                                       |
| 67591570dd29 | docker.io/centos:latest | /usr/lib/firewalld/ipsets                      |
| 67591570dd29 | docker.io/centos:latest | /etc/alternatives/ld                           |
| 67591570dd29 | docker.io/centos:latest | /etc/group-                                    |
| 67591570dd29 | docker.io/centos:latest | /usr/lib64/fipscheck                           |
| 67591570dd29 | docker.io/centos:latest | /var/lib/alternatives/libnssckbi.so.x86_64     |
| 67591570dd29 | docker.io/centos:latest | /etc/openldap/certs/password                   |
| 67591570dd29 | docker.io/centos:latest | /var/lib/yum/yumdb                             |
| 67591570dd29 | docker.io/centos:latest | /etc/systemd/system/multi-user.target.wants    |
| 67591570dd29 | docker.io/centos:latest | /etc/systemd/system/system-update.target.wants |

And there is a similar command to compare non-packaged files between images which shows the files that are not part of operating system packages that have changed between two images.

# anchore query --image=centos:latest show-non-packaged-files-diff all / 0584b3d2cf6d

When performing this query on your own images you may find a lot of noise caused by temporary files or logs. For example /var/lib/yum may contain data from package installs or updates. Directories can be filtered out using the exclude= option on the command line.

To summarize – you should be able to quickly produce a changelog for a container in 3 simple steps:

Step 1: Analyze the images you wish to compare:

# anchore analyze --imagetype=none --image=myapp:latest
# anchore analyze --imagetype=none --image=myapp:old

Step 2: Run a query to report on the package changes

anchore query --image=centos:latest show-pkg-diffs my app:old 

Step 3: Run a query to report on the (non packaged) file changes

# anchore query --image=centos:latest show-non-packaged-files-diff all / myapp:old

These commands will produce human-readable output, complete with tables, however, you can easily add
--json or --plain  to produce machine-parsable output.

You can download and install the Anchore open source project now on GitHub or request a demo of Anchore Enterprise.

Hanlon’s Images

Occam’s razor is a well known philosophical principle that’s entered mainstream culture.
While there are many ways to describe this principle the most succinct is:

     “The simplest answer is most often correct.

The lesson behind this razor is that if there are many explanations for a particular phenomenon, then out of the many and often complex alternative explanations the simplest is likely the most likely to be correct.

In philosophy, a razor is a principle that helps you “shave off” unlikely explanations.
I’d like to share with you another razor, one that is less well known but that I have found to be very useful in assessing situations I encounter in day to day life and especially around security.

Hanlon’s Razor states:

     “Never attribute to malice that which is adequately explained by stupidity”

Or in other words:

     “Don’t assume bad intentions over neglect and misunderstanding.”

Over the last 6 months, we’ve spoken to many organizations about container security and the need to apply governance within their container infrastructure. One question that has come up often is this: “If I’m only using official images or building my own images why do I need to scan?” This is a fair question and before I invoke Hanlon it’s worth a little discussion.

Let’s start with the first point, Official images:
Of the many thousand repositories on DockerHub there are around 140 special repositories that are classified as Official repos. These are a set of curated repos that have been created by an organization or community and submitted to Docker Inc and the community for official review. The official repos are among the most popular images on DockerHub and undergo detailed review before being classified as official including adherence to Dockerfile best practices in creating the image.

Using the Official repos, especially the base operating system images, is a good best practice as it ensures that you are starting off with content from a known source. But care should still be taken in the use of these images. While some official images are updated frequently, many images (especially base OS images) are often only updated on a monthly basis or sometimes even less frequently. A quick way to get an idea of this is to look at the Anchore Navigator and sort by the “Repo Last Updated” column. You’ll notice an “Update Frequency” column on the Navigator which currently displays “Gathering Data”. Anchore’s cloud service continually monitors DockerHub for changes, pulling down and analyzing images as they are updated. We’ve gathered several months’ worth of history and over the coming weeks, we’ll give a visual indication of the frequency of updates within this column. Another common problem that we’ve heard from many organizations is that while a developer may be using the image tagged latest they may not be aware that the latest image has been updated and so the ‘new latest’ image needs to be pulled down from DockerHub.

Regardless of how often an image is updated it should still be scanned for vulnerabilities before deployment as many of the official images, not to mention the tens of thousands of public images, contain exploitable vulnerabilities. So whether you base your containers off an official image from DockerHub, a public image, or build an image from scratch then it’s good practice to ensure that all the latest package updates have been applied to the image.

Scanning and updating the operating system packages is just the first step in ensuring that your images are secure, while this will address common issues such as known vulnerabilities in operating system packages (CVEs) we believe that this is just the tip of the iceberg. It’s possible to have all the latest operating system packages but still have an image that has security vulnerabilities or is otherwise not compliant with your operational, security or business policies. One area that is often overlooked is third party software libraries that are used within your applications such as Node.JS modules pulled from the public NPM or Ruby GEM repositories. A great example of this came at the end of December where a remote code execution vulnerability was reported in the PHPMailer library that’s widely used in many in-house PHP applications as well as common off the shelf applications such as WordPress, Drupal and SugarCRM. While a CVE has been assigned to this vulnerability a simple scan of operating system packages would likely not find this since many developers do not pull in their PHP, Ruby or Node libraries from operating system packages.

Even with the latest operating system packages and with well-written applications using up to date libraries, a container image may be made insecure due to misconfiguration which may be caused by administration or debugging options that are left enabled or by misconfigured encryption or SSL certificates or through enabling unnecessary services within your container image. A great example of this was seen last year at Vine where a security researcher found source code and API keys embedded within the container image.

And Here is Where Hanlon can Help

     “Don’t assume bad intentions over neglect and misunderstanding.”

In all likelihood the security or compliance issues that you will encounter within your image won’t be due to malicious intent – where a hacker has embedded malware in a public image that you consume, most of the issues will be caused by mistakes that are made: packages that are not updated, 3rd party libraries that are vulnerable or simple application misconfigurations which is why scanning should be in place for all images no matter the source of the image even if all content was developed in house – you are looking for mistakes as well as for malice.

While image scanning solutions focus on scanning the operating system image for known vulnerabilities Anchore provides a deeper level of analysis into images looking at the operating system, 3rd party libraries, configuration files, etc. With Anchore, organizations can define their own policies that describe their certification needs, covering all aspects of the images, that can be run at any time both on images that they may consume from public sources and on images that are created in house.

Deeper Analysis with Anchore

Since we announced Anchore 1.0 back in October we have spent a great deal of time talking to our community users, partners and enterprises about their compliance and governance needs. Many of these conversations followed a similar pattern: Initial excitement about Docker and container deployments, followed by concerns about security, then the challenge of balancing the desire to support agile development and innovation with the need for compliance and security. We’ve heard from these users that many have a basic system in place to perform the first level of checks on their images, which are focused on CVEs, however, they understand that this is not enough. In our conversations with these organizations, we spend a lot of time talking about the CVE scanning being the tip of the iceberg and many of our discussions then focus on how to go deeper into container inspection and analysis.

At Anchore our focus has been to deliver tools and services that go below the surface to perform deep analysis on container images and allow organizations to define policies that specify rules to govern security vulnerabilities, package whitelists and blacklists, configuration file contents, presence of credentials in image, manifest changes, exposed ports or any user-defined checks.

Last week we outlined a number of new features we added to the Anchore Navigator which added deeper container scanning including the ability to report on Node.JS NPM modules. Today we would like to announce the latest release of both Anchore’s open source project and Anchore’s Enterprise offering.

Over the coming weeks, we will deep dive into each of the new features in this release and outline the roadmap for the coming months.

We’ll highlight the 3 most significant features in the 1.0.3 release however you can get more details from the changelog in our Github repository.

Node.JS NPM Support

In addition to the operating system packages and all files in the image Anchore now reports on all Node.js NPMs that are installed in the image. These software libraries are often overlooked; they are not covered by security scanning tools and do not undergo the same level of scrutiny and governance than the operating system yet in many cases you’ll find more NPM packages in your image than you have operating system packages.

Node.JS Data Feed

The enterprise offering builds on top of the NPM reporting in the open source project to allow organizations to build policies that govern the use of NPM modules in their container images. For example allowing an organization to blacklist specific modules, specify minimum versions or even block deployment of outdated modules.

Advanced Content Policies

It is not enough to just look at the operating system packages and software packages such as NPM modules. It’s possible to have all of the latest operating system packages but still have an image that’s got security vulnerabilities or is otherwise not compliant with your operational, security or business policies. A great example of this was seen this summer when a security researcher found source code and secrets (API keys) within a Vine container image that was publicly accessible.

In this release, we have added the ability to perform detailed checks against both the names and the contents of files. While this feature enables the ability to perform a wide variety of checks one of the most interesting use cases is to scan the image for ‘secrets’. For example, search for .CER or .PEM files that may contain private keys for certificates, look for source code or inspect the contents of specific files for saved passwords or API keys.

These are just a few of the new features added in this release. We’ll cover these in more detail in the coming days. If you want to learn more please fill out the form below and our team will reach out to you.

Anchore Joins the Open Container Initiative

Today we formally announced that Anchore had joined the Open Container Initiative (OCI).

12563465The OCI was established to develop standards for containers, initially focusing on the runtime format specification but later adding the container image format specification.

Container adoption is accelerating rapidly and the ecosystem is exploding with new vendors who are providing features such as orchestration, monitoring, deployment and reporting.

Standards are critical to the adoption of containers, ensuring that customers can choose their cloud provider, orchestration platform or monitoring tool without worrying about interoperability between these platforms and without being locked into one particular stack or vendor.

In the early days of the OCI concerns were raised about the overhead that is sometimes seen with standards bodies that can be bureaucratic and slow to come to an agreement. As such there was a real concern that the standardization process may stifle innovation in the container market which had seen rapid innovation and adoption. The incredible progress we have seen made by the OCI within its first 18 months seems to have put those concerns to rest and the OCI community is growing with nearly all of the leading players in the container market participating in this important work.

The image format specification is of particular interest to Anchore. This format covers the low-level details of container images including both the filesystem image and the associated metadata required to run the image. Today Anchore‘s Container Image scanning engine understands the low-level details of the Docker image format and is able to perform detailed analysis on these images. Over the coming months, Anchore will add support for the OCI image specification to allow customers to perform analysis, compliance and certification tests on OCI images in addition to Docker images.

We are looking forward to contributing to the specification, especially in the area of governance and compliance and by providing open source tools and services to allow OCI images to be analyzed and validated.

Containers in Production, Is Security a Barrier?

Fintan Ryan – Redmonk – December 1, 2016

16ce728

Over the last week, we have had the opportunity to work with an interesting set of data collected by Anchore (full disclosure: Anchore is a RedMonk client). Anchore collected this data by means of a user survey ran in conjunction with DevOps.com. While the number of respondents is relatively small, at 338, there are some interesting questions asked, and a number of data points which support wider trends we are seeing around container usage. With any data set of this nature, it is important to state that survey results strictly reflect the members of the DevOps.com community.

The data set covered a number of areas including container usage and plans, orchestration tools, operating system choices, CI tools and security. For this post we will be focusing on the data around containers and CI.

Read the original and complete article on RedMonk.

How Fast Can You Add Image Scanning to Jenkins?

Last month we blogged about securing your Jenkins pipeline, how within 10 minutes you could add, for free, image scanning, analysis and compliance validation. Since then we’ve spoken to many organizations who’ve had the opportunity to add security to their CI/CD pipeline. And it’s also been pointed out that if you don’t read the marketing preamble the whole process takes around 3 minutes before you are ready to analyze your first build.

So in this short blog, we want to see if we can set a record – how quickly can we really add image scanning to your CI/CD pipeline. This video was recorded on a virtual machine running Docker 1.11 and Jenkins 2.32.

Without caching or pre-loading images our time is 2 minutes and 34 seconds – from the start of the install through to kicking off the build. Can you beat that? In less time than it takes to make a coffee you can secure your Jenkins pipeline.

Please tweet us at @anchore with the hashtag #SecureWithAnchore to let us know your times.

To learn more please contact us using the form below, or request a demo by clicking the button in the menu above.

Keeping Linux Containers Safe and Secure

Jason Baker – Opensource.com – October 4, 2016

Linux containers are helping to change the way that IT operates. In place of large, monolithic virtual machines, organizations are finding effective ways to deploy their applications inside Linux containers, providing for faster speeds, greater density, and increased agility in their operations.

While containers can bring a number of advantages from a security perspective, they come with their own set of security challenges as well. Just as with traditional infrastructure, it is critical to ensure that the system libraries and components running within a container are regularly updated in order to avoid vulnerabilities. But how do you know what is running inside of your containers? To help manage the full set of security challenges facing container technologies, a startup named Anchore is developing an open source project of the same name to bring visibility inside of Linux containers.

To learn more about Anchore, I caught up with Andrew Cathrow, Anchore’s vice president of products and marketing, to learn more about the open source project and the company behind it.

In a Nutshell, What is Anchore? How does the Toolset Work?

Anchore’s goal is to provide a toolset that allows developers, operations, and security teams to maintain full visibility of the ‘chain of custody’ as containers move through the development lifecycle, while providing the visibility, predictability, and control needed for production deployment. The Anchore engine is comprised of pluggable modules that can perform analysis (extraction of data and metadata from an image), queries (allowing reporting against the container), and policy evaluation (where policies can be specified that govern the deployment of images).

While there are a number of scanning tools on the market, most are not open source. We believe that security and compliance products should be open source, otherwise, how could you trust them?

Anchore, in addition to being open source, has two other major differentiators that set it apart from the commercial offerings in the market.

First, we look beyond the operating system image. Scanning tools today concentrate on operating system packages, e.g. “Do you have any CVEs (security vulnerabilities) in your RPMs or DEB packages?” While that is certainly important, you don’t want vulnerable packages in your image, the operating system packages are just the foundation on which the rest of the image is built. All layers need to be validated, including configuration files, language modules, middleware, etc. You can have all the latest packages, but with even one configuration file wrong, insecurity sets in. A second differentiator is the ability to extend the engine by adding users’ own data, queries or policies.

Read the original and complete article on OpenSource.com.

Startup Nets $5 Million to X-ray & Secure Software Containers

Barb Darrow – Fortune – October 4, 2016

Fortune_logo_logotype_red

Anchore has $5 million in seed funding to attack knotty container issues.

Anchore, a startup that says it can ensure that software “containers” are safe, secure, and ready to deploy, is introducing its first product along with announcing $5 million in seed funding.

For non-techies, containers are an emerging way to package up all the building blocks in software—the file system, the tools, the core runtime—into a nice bundle, or container, that can then run on any sort of infrastructure. That means, theoretically at least, the container, as exemplified by the popular Docker, can work inside a company’s data center, on Amazon Web Services, or some other shared public cloud infrastructure. That’s a lot more flexible than previously when business software was pretty much welded to the underlying hardware.

Read the original and complete article on Fortune.

Confident Production Deployment With Anchore 1.0

It has been just a little over five months since Anchore opened its doors, and we’re happy to announce the General Availability of Anchore 1.0 – combining an open source platform for community participation while addressing enterprise needs through an on-prem offering with additional feature augmentation, and Anchore Navigator, anchore.com, a free service that provides an unparalleled level of visibility into the contents of container images.

As the adoption of containers continues to grow enterprises are increasingly demanding more visibility and control of their container environments. Today we see operations, security and compliance teams looking to add a level of governance to container deployments that were lacking during the early gold rush. The most common approach we have seen today is container image scanning which typically means scanning the operating system components of an image for security vulnerabilities, CVEs. While the need to scan an image for CVEs is undeniable it should only be the first step given the fact that each image typically contains hundreds of operating system packages, thousands of files along with application libraries and configuration files that are likely not part of the operating system image.

Anchore 1.0 was designed to address the lack of transparency, allowing developers, operations and security teams to get visibility into the entire contents of the containers – far more than the surface CVE scans that we have seen today. Empowered with this detailed information operations, security and compliance teams can define policies that govern the deployment of containers, including rules that cover security vulnerabilities, mandatory software packages, blacklisted software packages, required versions of software libraries, validated configuration files or any one of a hundred other tests that an enterprise may require to consider an image compliant.

The need for visibility and compliance extends beyond just point in time scanning of an image before deployment. In most cases application images are built from base images downloaded from public registries, these images may be updated often and in many cases without any obvious indication that a change was made let alone what was changed in these images. End-users have to struggle with the age-old choice: sticking with a known working but somewhat stale version, or use the latest, more feature-full, version and run the risk of security vulnerabilities, major bugs, and overall compliance deviation.

Full transparency is no longer just a good option to have in your toolset, but a mandate for application development and operations teams alike. Using the most stable and secure baseline of an IT service should no longer translate to an antiquated version of the software. With the fast pace of innovation also comes risk, and companies, big and small, will benefit greatly from simply and easily uncovering and tracking all changes throughout the application development and production lifecycle.

Is Docker More Secure?

Over the last couple of years, much has been written about the security of Docker containers, with most of the analysis focusing on the comparison between containers and virtual machines.

Given the similar use cases addressed by virtual machines and containers, this is a natural comparison to make, however, I prefer to see the two technologies as complementary. Indeed a large proportion of containers that are deployed today are run inside virtual machines, this is especially true of public cloud deployments such as Amazon’s EC2 Container Service (ECS) and Google Container Engine (GKE).

While we have seen a number of significant enhancements made to container runtimes to improve isolation, containers will continue to offer less isolation than traditional virtual machines for the foreseeable future. This is due to the fact that in the container model each container shares the same host kernel so if a security exploit or some kernel-related bug is triggered from a container then the host system and all running containers on that host are potentially at risk.

For use cases where absolute isolation is required, for example where an image may come from an untrusted source, virtual machines are the obvious solution. For this reason, multi-tenant systems such as public clouds and private Infrastructure as a Service (IaaS) platforms will tend to use virtual machines.

In a single-tenant use case such as enterprise IT infrastructure where the deployment and production pipeline can be designed and controlled with security in mind, containers offer a lightweight and simple mechanism for isolating workloads. This is the use case where we have seen exponential growth of container deployments. We are starting to see crossover technologies such as Intel’s Clear Containers that allow containers to be run in lightweight virtual machines allowing the user to provide stronger isolation for a specific container when deemed necessary.

Within the last year or so we have seen container isolation techniques improve considerably through the use of features of the Linux kernel such as Namespaces, seccomp, cgroups, SELinux and AppArmor.

Recently Joerg Fritsch from Gartner published a research note and blog where he made the following statement:

“Applications deployed in containers are more secure than applications deployed on the bare OS”.

Following on from this note Nathan McCauley from Docker wrote a blog that dug further into this topic and referenced NCC group’s excellent white paper on Hardening Linux Containers.

The high-level message here is that “you are safer if you run all your apps in containers”. More specifically the idea is to take applications that you would normally run on ‘bare metal’ and deploy them as containers on bare metal. Using this approach you would add a number of extra layers of protection around these applications reducing the attack surface, so in the case of a successful exploit against the application, the damage would be limited to the container reducing potential exposure to the other applications running on that bare metal system.

While I would agree with this recommendation there are, as always, a number of caveats to consider.  The most important of which relates to the contents of the container.

When you deploy a container you are not just deploying an application binary in a convenient packaging format, you are often deploying an image that contains an operating system runtime, shared libraries, and potentially some middleware that supports the application.

In our experience, a large proportion of end-users build their containers based on full operating system base images that often include hundreds of packages and thousands of files. While deploying your application within a container will provide extra levels of isolation and security you must ensure that the container is both well constructed and well maintained. In the traditional deployment model, all applications use a common set of shared libraries so, for example, when the runtime C library glibc on the host is updated all the applications on that system now use the new library. However in the container model, each container will include it’s own runtime libraries which will need to be updated. In addition, you may find that these containers include more libraries and binaries that are required – for example does an nginx container need the mount binary?

As always, nothing comes without a cost. Each application you containerize needs to be maintained and monitored, but it’s clear that the advantages in terms of security and agility provided by Docker and containers in general far outweigh some of the administrative overhead which can be addressed with the appropriate policies and tooling, which is where Anchore can help.

Anchore provides tooling and a service that gives unparalleled insight into the contents of your containers, whether you are building your own container images or using images from third parties. Using Anchore’s tools an organization can gain deep insight into the contents of their containers and define policies that are used to validate the contents of those containers before they are deployed. Once deployed, Anchore will be able to provide proactive notification if a container that was previously certified based on your organization’s policies moves out of compliance – for example, if a security vulnerability is found in a package you have deployed.

So far container scanning tools have concentrated on the operating system packages, inspecting the RPM or dpkg databases and reporting on the versions of packages installed and correlating that with known CVEs in these packages. However, the operating system packages are just one of many components in an image which may include configuration files, non-packages files on the file system, software artifacts such as PiP, Gem, NPM and Java archives. Compliance with your standards for deployment means more than just the latest packages it means the right packages (required packages, blacklisted packages) the right software artifacts, the right configuration files, etc.

Our core engine has already been open sourced and our commercial offering will be available later this month.

Future of Container Technology & Open Container Initiative

Open Container Initiative – August 23, 2016

The Open Container Initiative (OCI), an open source project for creating open industry standards around container formats and runtime, today announced that Anchore, ContainerShip, EasyStack and Replicated have joined The Linux Foundation and the Open Container Initiative.

Today’s enterprises demand portable, agile and interoperable developer and sysadmin tools. The OCI was launched with the express purpose of developing standards for the container format and runtime that will give everyone the ability to fully commit to container technologies today without worrying that their current choice of infrastructure, cloud provider or DevOps tool will lock them in. Their choices can instead be guided by choosing the best tools for the applications they are building.

“The rapid growth and interest in container technology over the past few years has led to the emergence of a new ecosystem of startups offering container-based solutions and tools,” said Chris Aniszczyk, Executive Director of the OCI. “We are very excited to welcome these new members as we work to develop standards that will aid container portability.”

The OCI currently has nearly 50 members. Anchore, ContainerShip, EasyStack and Replicated join existing members including Amazon Web Services, Apcera, Apprenda, AT&T, ClusterHQ, Cisco, CoreOS, Datera, Dell, Docker, EMC, Fujitsu Limited, Goldman Sachs, Google, Hewlett Packard Enterprise, Huawei, IBM, Infoblox, Intel, Joyent, Kismatic, Kyup, Mesosphere, Microsoft, Midokura, Nutanix, Odin, Oracle, Pivotal, Polyverse, Portworx, Rancher Labs, Red Hat, Resin.io, Scalock, Sysdig, SUSE, Twistlock, Twitter, Univa, Verizon Labs, VMware and Weaveworks.

Read the complete and original announcement on Open Container Initiative.

How are Containers Really Being Used?

Our friends at ContainerJournal and Devops.com are running a survey to learn how you are using containers today and your plans for the future.

We’ve seen a number of surveys over the last couple of years and heard some incredible statistics on the growth of Docker usage and of containers in general, for example, we learned last week that DockerHub had reached over 5 billion pulls. The ContainerJournal survey digs deeper to uncover details about the whole stack that users are running.

For example, who do you get your container runtime from, where do you store your images, how do you handle orchestration?

Some of the questions are especially interesting to the team here at Anchore as they cover how you create and maintain the images that you use. For example, do you pull application images straight from Docker Hub, do you just pull base operating system images and add your own application layers, or perhaps you build your own operating system images from scratch?

And no matter how you initially obtain your image how do you ensure that it contains the right content starting from the lowest layer of the image with the operating system all the way up to the application tier. While it’s easy to build and pull images, the maintenance of those images is another matter, eg. how often are those images updated?

Please head over to ContainerJournal and fill out the survey by clicking the button below.

TNS Research: A Scan of the Container Vulnerability Scanner Landscape

Lawrence Hecht – The New Stack – August 5, 2016

Container registries and vulnerability scanners are often bundled together, but they are not the same thing. Code scanning may occur at multiple points in a container deployment workflow. Some scanners will be bundled with existing solutions, while others are point solutions. There differences can be measured by the data sources they use, what is being checked, and the actions are automatically taken as the result of a scan.

Read the original and complete article at The New Stack.

Extending Anchore with Jenkins

Jenkins is one of the most popular Continuous Integration/Continuous Delivery platforms in production today. Jenkins has over a million active users, and according to the CloudBees State of Jenkins survey last year, 95% of Jenkins users are already using or plan to start using Docker within 12 months. A CI/CD build system is a very important part of any organization’s automation toolkit, and Anchore has some clear integration points with these tools. In this blog post, I’ll describe and illustrate a simple way to manually integrate Anchore’s open source container image validation engine into a Jenkins-based CI/CD environment. It’s worth noting that this is only one possible method integration between Anchore and Jenkins, and a different approach may be more suitable for your environment. We’d love to hear from you if you find a new way to use Anchore in your CI/CD pipeline!

Anchore allows you to specify “gates” — checks that are performed on a container image before it moves to the next stage of the development. These gates range from things like required or disallowed packages, properties of the image’s Dockerfile, presence of known vulnerabilities, and so on. The gate subsystem is easily extended to add your own conditions–perhaps application configuration, versioning requirements, etc.

Gates have been designed to run as part of an automated CI/CD pipeline. A popular workflow is to have an organization’s CI/CD pipeline respond to newly-committed Dockerfiles, building images, running tests, and so on. A good place to run Anchore’s Gates would be in between the build of the image and the next phase: whether it’s a battery of tests, or maybe a promotion of an application to the next stage of production. The workflow looks like this:

  1. Developer commits an updated Dockerfile to Git
  2. A Jenkins job is triggered based on that commit
  3. A new container image is built as part of the Jenkins job
  4. Anchore is invoked to analyze the image
  5. The status of that image’s gates are checked

At this point, the CI pipeline can make a decision on whether to allow this newly-created and analyzed image to the next stage of development. Gates have three possible statuses: GO, WARN, STOP. They are fairly self-explanatory: an image whose gates all pass GO should be promoted to the next stage. Images with any WARN statuses may need further inspection but may be allowed to continue. An image with a gate that returns a STOP status should not move forward in the pipeline.

Let’s walk through a simplified example. For clarity, I’ve got my Docker, Anchore, and Jenkins instances all on the same virtual machine. Production configurations will likely be different. (I’m running Jenkins 2.7.1, Docker 1.11.2, and the latest version of Anchore from PIP.)

The first thing we need to do is create a Build Job. This is not intended to be a general-purpose Jenkins tutorial, so drop by the Jenkins Documentation if you need some help. Our Jenkins job will poll a GitHub repository containing our very simple Dockerfile, which looks like this:

The relevant section of our Jenkins build job looks like this:

These commands do the following:

docker build -t anchore-test.

This command instructs Docker to build a new image based on the Dockerfile in the directory of the cloned Git repository. The image’s name is “anchore-test”.

anchore analyze –image anchore-test –dockerfile Dockerfile

This command calls Anchore to analyze the newly-created image.

anchore gate –image anchore-test

This command runs through the Anchore “gates” to determine if the newly-generated image is suitable for use in our environment.

Let’s look at the output from this build:

Whoops! Our build failed. Looks like we triggered a couple of gates here. The first one, “PKGDIFF”, is reporting an action of “STOP”. If you look at the “CheckOutput” column, it says: “Package version in container is different from baseline for pkg – tzdata”. This means that along the way the package version of tzdata has changed; probably because our Dockerfile does a “yum update -y”. Let’s try removing that command–maybe we should instead stick to the baseline image that our container team has provided.

So let’s edit the Dockerfile, remove that line, commit the change, and re-run the build. Here’s the output from the new build:

Success! We’ve passed all of the gates. You can change which gates apply to which images and how they are configured by running:

anchore gate –image anchore-test –editpolicy

(You’ll be dropped into the editor specified by the VISUAL or EDITOR environment variables, usually vim.)

Our policy currently looks like this:

DOCKERFILECHECK:NOTAG:STOP
DOCKERFILECHECK:SUDO:GO
DOCKERFILECHECK:EXPOSE:STOP:ALLOWEDPORTS=22
DOCKERFILECHECK:NOFROM:STOP
SUIDDIFF:SUIDFILEDEL:GO
SUIDDIFF:SUIDMODEDIFF:STOP
SUIDDIFF:SUIDFILEADD:STOP
PKGDIFF:PKGVERSIONDIFF:STOP
PKGDIFF:PKGADD:WARN
PKGDIFF:PKGDEL:WARN
ANCHORESEC:VULNHIGH:STOP
ANCHORESEC:VULNLOW:GO
ANCHORESEC:VULNCRITICAL:STOP
ANCHORESEC:VULNMEDIUM:WARN
ANCHORESEC:VULNUNKNOWN:GO

You can read all about gates and policies in our documentation. Let’s try one more thing: let’s change the “PKGDIFF:PKGVERSIONDIFF” policy to “WARN” instead of “STOP”, and re-enable our yum update command in the Dockerfile.

In the policy editor, we’ll change these lines:

PKGDIFF:PKGVERSIONDIFF:STOP
PKGDIFF:PKGADD:WARN

To this:

PKGDIFF:PKGVERSIONDIFF:GO
PKGDIFF:PKGADD:GO

And save and exit. We’ll also edit the Dockerfile, re-add the “RUN yum update -y” line, and commit and push the change. Then let’s run the Jenkins job again and see what happens.

Now you can see that although Anchore still detects an added package and a changed version, because we’ve reconfigured those gates, it’s not a fatal error and the build completes successfully.

This is just a very simple example of what can be done with Anchore gates in a CI/CD environment. We are planning on implementing a full Jenkins plugin for a more streamlined integration, so stay tuned for that. There are also more gates to explore, and you can extend the system to add your own. If you have questions, comments, or want to share how you’re using Anchore, let us know!

Signed, Sealed, Deployed

Red Hat recently blogged about their progress in adding support for container image signing, a particularly interesting and most welcome aspect of the design is the way that the binary signature file can be decoupled from the registry and distributed separately. The blog makes interesting reading and I’d strongly recommend reading through it, I’m sure you’ll appreciate the design. And of course, code is available online.

Red Hat is, along with the other Linux distributors, well versed in the practice of signing software components to allow end-users to verify that they are running authentic code and is in the process of extending this support to container images. The approach described is different from that taken previously by Docker Inc. however rather than comparing the two approaches I wanted to talk at a high level about the benefits of image signing along with some commentary about trust.

In the physical world, we are all used to using our signature to confirm our identity.

Probably the most common example is when we are signing a paper check or using an electronic signature pad during a sales transaction. How many times have you signed your signature so quickly that you do not even recognize it yourself? How many times in recent memory has a cashier or server compared the signature written with that on the back of your credit card? In my experience that check is likely to happen one out of every ten times and even in those cases that check is little more than a token gesture and the two signatures may not have matched.

That leads me to the first important observation: a signature mechanism is only useful if it is checked.  Obviously, when vendors such as Docker Inc, Red Hat, and others implement an image signing and validation system, the enforcement will be built into to all layers, so that in one example a Red Hat delivered image will be validated by a Red Hat provided Docker runtime to ensure it’s signed by a valid source.

However it’s more likely that the images that you deploy in your enterprise won’t just be the images downloaded from a registry, but instead, images built on top of these images or perhaps even built from scratch, so for image signing to provide the required level of security all images created within your enterprise should also be signed and have those signatures validated before the image is deployed. Some early users of image signing that we have talked to have used image signing less as a way of tracking the provenance of images but instead as a method to show that an image has not been modified between leaving the CI/CD pipeline and being deployed on their container host.

Before we dig into the topic of image signing it’s worth discussing what a signature actually represents.

The most common example of signatures that we see in our day to day life is in our web browsers where we look for the little green padlock in the address bar that indicates that the connection to the webserver from our browser is encrypted but most importantly it confirms that you are talking to the expected website.

The use of TLS/SSL certificates allows your browser to validate that when you connect to https://www.example.com the content displayed actually came from example.com.

So in this example, the signature was used to confirm the source of the (web) content. Over many years we have been trained NOT to type our credit card details into a site that is NOT delivered through HTTPS.

But that does not mean that you would trust your credit card details to any site that uses HTTPS.

The same principle applies to the use of image signatures. If you download an image signed by Red Hat, Docker Inc, or any other vendor, you can be assured that the image did come from this vendor. The level of confidence you have in the contents of the image is based on the level of trust you already have with the vendor. For example, you are likely not to run an image signed by l33thackerz even though it may include a valid signature.

As enterprises move to a DevOps model with containers we’re seeing a new software supply chain, which often begins with a base image pulled from DockerHub or a vendor registry.

This base image may be modified by the operations team to include extra packages or to customize specific configuration files. The resulting image is then published in the local registry to be used by the development team as the base image for their application container. In many organizations, we are starting to see other participants in this supply chain, for example, a middleware team may publish an image containing an application server that is in turn used by an application team.

For the promise of image signing to be fulfilled, at each stage of this supply chain, each team must sign the image to ensure that the ‘chain of custody’ can be validated throughout the software development lifecycle. As we covered previously those signatures only serve to prove the source of an image, during any point in the supply chain from the original vendor of the base image all the way through the development process the images may be modified. At any step in the supply chain a mistake may be made, an outdated package that contains known bugs of vulnerabilities may be used, an insecure configuration option in an application’s configuration file or perhaps secrets such as passwords or API keys may be stored in the image.

Signing an image will not prevent insecure or otherwise non-compliant images from being deployed, however, as part of a post mortem, it will provide a way of tracking down when the vulnerability or bug was introduced.

During each stage of the supply chain, detailed checks should be performed on the image to ensure that the image complies with your site-specific policies.

These policies could cover security, starting with the ubiquitous CVE scan but then going further to analyze the configuration of key security components. For example, you could have the latest version of the apache web server but have configured the wrong set of TLS Ciphers suites leading to insecure communication. In addition to security, your policies could cover application-specific configurations to comply with best practices or to enable consistency and predictability.

Anchore’s goal is to provide a toolset that allows developers, operations, and security teams to maintain full visibility of the ‘chain of custody’ as containers move through the development lifecycle while providing the visibility, predictability, and control needed for production deployment.

With Anchore’s tools, the analysis and policy evaluation could be run during each stage of the supply chain allowing the signatures to attest to both the source of the image and also the compliance of the image’s contents.

In summary, we believe that image signing is an important part of the security and integrity of your software supply chain however signatures alone will not ensure the integrity of your systems.

Webinar – Introduction to the Anchore Project

Today we delivered Anchore’s first webinar where we gave an introduction into Anchore’s open source project and discussed how we can democratize certification through the use of open source.

A primary concern for enterprises adopting Docker is security most notably, in the governance and compliance of the containers that they are deploying. In the past, as we moved from physical server deployments to virtual machines we saw similar issues and we spoke about “VM sprawl” but containers are set to exponentially outgrow VM deployments. It’s almost too easy to pull an application image from a public registry and run it, within seconds you can deploy an application in production without even knowing what’s under the covers.

Organizations want to have confidence in their deployments, to know that when they deploy an application it will work, it will be secure, it can be maintained and it will be performant.

In the past, this confidence came through certification. Commercial Linux distributions such as Red Hat, SuSE and others set the standard and worked with hardware and software vendors on certification programs to give a level of assurance to end-users that the operating system would run reliably on their hardware and also offer insurance in the form of enterprise-grade commercial support if they encountered issues.

Today the problem is more complex and there can no longer be just a single certification. For example, the requirements of a financial services company are different from the requirements of a healthcare company handling medical records and these are different from the needs of a federal institution and so on. Even the needs of individual departments within any given organization may be different.

What is needed now is the ability for IT operations and security to be able to define their own certification requirements which may differ even from application to application, allowing them to define these policies and evaluate them before applications are deployed into production.

What we are talking about is the democratization of certification

Rather than having certification in the hands of a small number of vendors or standards bodies, we want to allow organizations to define what certification means to them.

Anchore’s goal is to provide a toolset that allows developers, operations, and security teams to maintain full visibility of the ‘chain of custody’ as containers move through the development lifecycle while providing the visibility, predictability, and control needed for production deployment.

Please tune into the webinar where we go a level deeper to discuss the challenges around container certification, how an open source, democratized approach can help end-users and introduce our open source tooling.

Extending Anchore with Lynis

Add Lynis Scanning to Anchore Image Analysis

Note: You will need the latest Anchore code from GitHub to follow this procedure: Install it here

In this post, we focus on solving a common problem that is faced when building out a container-based deployment environment – take an existing tool/practice for deciding whether or not application code is ready to be deployed, and apply it to the steady stream of container images that are flowing in from developers on their way to production. With Anchore, we show that we can apply many existing tools/techniques to container images easily, in a way that leads to a ‘fail fast’ property where things can be checked early on in the CI/CD pipeline (pre-execution).

To illustrate this idea, we walk through the the process of adding a new analyzer/gate to Anchore – specifically I would like to include the scanning of all container images using the ‘Lynis’ open-source Linux Distro scanning utility, and then be able to use the Anchore policy system to make decisions based on the result of the Lynis scan.  Once complete, every container image that is analyzed by Anchore in the future will include a lynis report, and every analyzed image will be subject to the Lynis gate checker.

The process is broken down into two parts – first, we write an ‘analyzer’ that is responsible for running the Lynis scan whenever any container is analyzed with Anchore, and second we write a ‘gate’ which can take as input the result of the Lynis scan and emits triggers based on what it finds.  From there, we can then use the normal Anchore policy strings to make STOP/WARN/GO suggestions based on what triggers the gate emits.

Writing the Lynis Analyzer Module

First, I use the anchore tool to set up a module development environment.

Note the output where it shows the exact paths on your system.&nbsp; I run the exact command just to make sure everything is sane:

# /tmp/3355618.anchoretmp/anchore-modules/analyzers/analyzer-example.sh 0f192147631d72486538039c51ef9557be11865030be2951a0fbe94ef66db618 /tmp/3355618.anchoretmp/data /tmp/3355618.anchoretmp/data/0f192147631d72486538039c51ef9557be11865030be2951a0fbe94ef66db618 /tmp/3355618.anchoretmp

RESULT: pfiles found in image, review key/val data stored in:

/tmp/3355618.anchoretmp/data/0f192147631d72486538039c51ef9557be11865030be2951a0fbe94ef66db618/analyzer_output/analyzer-example/pfiles

Since I want to write a python module (instead of the included example shell script), I’ll start with an existing anchore python analyzer script and call it ’10_lynis_report.py’

# cp /usr/lib/python2.7/site-packages/anchore/anchore-modules/analyzers/10_package_list.py /tmp/3355618.anchoretmp/anchore-modules/analyzers/10_lynis_report.py

I’ll trim most of the code out, and change the ‘analyzer_name’ to a new name for this module – I’ve chosen ‘lynis_report’.

Next, I’ll add my code which first downloads the lynis scanner from a URL and creates a tarball that contains lynis.  Then, the code uses an anchore utility routine that takes an input tarball and the input container image, and runs an instance of the container with the input tarball stages and available, executing the lynis scanner. Finally, the routine returns the stdout/stderr output of the executed container along with the contents of a specified file from within the container (in this case, the lynis report data itself). The last thing the analyzer does is write the lynis report data to the anchore output directory for later use.

While writing this code, we use the follow command each time to iterate and get the analyzer working the way we would like (i.e. when the lynis.report output file contains the lynis report data itself, we know the analyzer is working properly)

# /tmp/3355618.anchoretmp/anchore-modules/analyzers/10_lynis_report.py 0f192147631d72486538039c51ef9557be11865030be2951a0fbe94ef66db618 /tmp/3355618.anchoretmp/data /tmp/3355618.anchoretmp/data/0f192147631d72486538039c51ef9557be11865030be2951a0fbe94ef66db618 /tmp/3355618.anchoretmp

# cat /tmp/3355618.anchoretmp/data/0f192147631d72486538039c51ef9557be11865030be2951a0fbe94ef66db618/analyzer_output/lynis_report/lynis.report

The finished module is here:

#!/usr/bin/env python

import sys
import os
import shutil
import re
import json
import time
import rpm
import subprocess
import requests
import tarfile

import anchore.anchore_utils

analyzer_name = “lynis_report”

try:
config = anchore.anchore_utils.init_analyzer_cmdline(sys.argv, analyzer_name)
except Exception as err:
print str(err)
sys.exit(1)

imgname = config
outputdir = config
unpackdir = config

if not os.path.exists(outputdir):
os.makedirs(outputdir)

try:
#datafile_dir = ‘/’.join(, ‘datafiles’])
datafile_dir = ‘/tmp/’
url = ‘https://cisofy.com/files/lynis-2.2.0.tar.gz’
r = requests.get(url)
TFH=open(‘/’.join(), ‘w’);
TFH.write(r.content)
TFH.close()

lynis_data_tarfile = ‘/’.join()
tar = tarfile.open(lynis_data_tarfile, mode=’w’, format=tarfile.PAX_FORMAT)
tar.add(‘/’.join(), arcname=’/lynis.tgz’)
tar.close()

except Exception as err:
print “ERROR: cannot locate datafile directory for lynis staging: ” + str(err)
sys.exit(1)

FH=open(outputdir + “/lynis.report”, ‘w’)
try:
fileput = lynis_data_tarfile
(o, f) = anchore.anchore_utils.run_command_in_container(image=imgname, cmd=”tar zxvf /lynis.tgz &amp;&amp; cd /lynis &amp;&amp; sh lynis audit system –quick”, fileget=”/var/log/lynis-report.dat”, fileput=fileput)
FH.write(‘ ‘.join([“LYNIS-REPORT-JSON”, json.dumps(f)]))
except Exception as err:
print str(err)

FH.close()

NOTE: this module is the basic code only meant as a demonstration, it does not include any checking for errors/faults as this would add a bit of code unrelated to the purpose of this posting.

Writing the Lynis Gate Module

The process of writing a gate is very similar to writing an analyzer – there are a few input differences and output file expectations, but the general process is the same.  I will start with an existing anchore gate modules and trim the functional code:

# cp /usr/lib/python2.7/site-packages/anchore/anchore-modules/gates/20_check_pkgs.py /tmp/3355618.anchoretmp/anchore-modules/gates/10_lynis_gate.py

Here is the module with the functional code trimmed out:

#!/usr/bin/env python

import sys
import os
import re
import anchore.anchore_utils

try:
config = anchore.anchore_utils.init_gate_cmdline(sys.argv, “LYNIS report checker”)
except Exception as err:
print str(err)
sys.exit(1)

if not config:
sys.exit(0)

imgid = config
imgdir = config
analyzerdir = config
comparedir = config
outputdir = config

try:
params = config
except:
params = None

if not os.path.exists(imgdir):
sys.exit(0)

# code will go here

sys.exit(0)

Next, we need to set up the input by putting the imageId that we’re testing against into an input file for the gate, and then we can run the module manually and check the output iteratively until we’re happy.

# echo 0f192147631d72486538039c51ef9557be11865030be2951a0fbe94ef66db618 &gt; /tmp/3355618.anchoretmp/querytmp/inputimages

# /tmp/3355618.anchoretmp/anchore-modules/gates/10_lynis_gate.py /tmp/3355618.anchoretmp/querytmp/inputimages /tmp/3355618.anchoretmp/data/ /tmp/3355618.anchoretmp/data/0f192147631d72486538039c51ef9557be11865030be2951a0fbe94ef66db618/gates_output/ PARAM=True

# cat /tmp/3355618.anchoretmp/data/0f192147631d72486538039c51ef9557be11865030be2951a0fbe94ef66db618/gates_output/LYNISCHECK

The finished module is here:

#!/usr/bin/env python

import sys
import os
import re
import json
import traceback

import anchore.anchore_utils

try:
config = anchore.anchore_utils.init_gate_cmdline(sys.argv, “LYNIS report checker”)
except Exception as err:
traceback.print_exc()
print “ERROR: ” + str(err)
sys.exit(1)

if not config:
sys.exit(0)

imgid = config
imgdir = config
analyzerdir = config
comparedir = config
outputdir = config

try:
params = config
except:
params = None

if not os.path.exists(imgdir):
sys.exit(0)

# code will go here

output = ‘/’.join()
OFH=open(output, ‘w’)

try:
FH=open(‘/’.join(), ‘r’)
lynis_report = False
for l in FH.readlines():
l = l.strip()
(k, v) = re.match(‘(S*)s*(.*)’, l).group(1, 2)
lynis_report = json.loads(v)
FH.close()

if lynis_report:
for l in lynis_report.splitlines():
l = l.strip()
if l and not re.match(“^s*#.*”, l) and re.match(“.*=.*”, l):
(k, v) = re.match(‘(S*)=(.*)’, l).group(1, 2)
if str(k) == ‘warning[]’:
# output a trigger
OFH.write(‘LYNISWARN ‘ + str(v) + ‘n’)
elif str(k) == ‘suggestion[]’:
OFH.write(‘LYNISSUGGEST ‘ + str(v) + ‘n’)
elif str(k) == ‘vulnerable_package[]’:
OFH.write(‘LYNISPKGVULN ‘ + str(v) + ‘n’)

except Exception as err:
traceback.print_exc()
print “ERROR: ” + str(err)

OFH.close()
sys.exit(0)

NOTE: this module is the basic code only meant as a demonstration, it does not include any checking for errors/faults as this would add a bit of code unrelated to the purpose of this posting.

Tie the Two Together

Now that we’re finished writing and testing the module, we can drop the new analyzer/gate modules into anchore and use the anchore CLI as normal.  First we copy the new modules into a location where anchore can use them:

cp /tmp/3355618.anchoretmp/anchore-modules/analyzers/10_lynis_report.py ~/.anchore/user-scripts/analyzers/
cp /tmp/3355618.anchoretmp/anchore-modules/gates/10_lynis_gate.py ~/.anchore/user-scripts/gates/

Next, we run the normal analyze operation which will now include the lynis analyzer:

anchore analyze –force –image ubuntu –imagetype none

Then, we can add new lines to the image’s policy that describe what actions to output if the new gate emits its triggers:

anchore gate –image ubuntu –editpolicy

# opens an editor, where you can add the following lines to the existing image’s policy
LYNISCHECK:LYNISPKGVULN:STOP
LYNISCHECK:LYNISWARN:WARN
LYNISCHECK:LYNISSUGGEST:GO

Finally, we can run the normal anchore gate, and see the resulting triggers showing up alongside the other anchore gates:

anchore gate –image ubuntu

0f192147631d: evaluating policies …
0f192147631d: evaluated.
+————–+—————+————+————–+———————————+————+
| ImageID | Repo/Tag | Gate | Trigger | CheckOutput | GateAction |
+————–+—————+————+————–+———————————+————+
| 0f192147631d | ubuntu:latest | LYNISCHECK | LYNISSUGGEST | BOOT-5180|Determine runlevel | GO |
| | | | | and services at startup|-|-| | |
| 0f192147631d | ubuntu:latest | LYNISCHECK | LYNISSUGGEST | KRNL-5788|Check the output of | GO |
| | | | | apt-cache policy manually to | |
| | | | | determine why output is | |
| | | | | empty|-|-| | |
| 0f192147631d | ubuntu:latest | LYNISCHECK | LYNISSUGGEST | AUTH-9262|Install a PAM module | GO |
| | | | | for password strength testing | |
| | | | | like pam_cracklib or | |
| | | | | pam_passwdqc|-|-| | |
| 0f192147631d | ubuntu:latest | LYNISCHECK | LYNISSUGGEST | AUTH-9286|Configure minimum | GO |
| | | | | password age in | |
| | | | | /etc/login.defs|-|-| | |
| 0f192147631d | ubuntu:latest | LYNISCHECK | LYNISSUGGEST | AUTH-9286|Configure maximum | GO |
| | | | | password age in | |
| | | | | /etc/login.defs|-|-| | |
| 0f192147631d | ubuntu:latest | LYNISCHECK | LYNISSUGGEST | AUTH-9328|Default umask in | GO |
| | | | | /etc/login.defs could be more | |
| | | | | strict like 027|-|-| | |
| 0f192147631d | ubuntu:latest | LYNISCHECK | LYNISSUGGEST | AUTH-9328|Default umask in | GO |
| | | | | /etc/init.d/rc could be more | |
| | | | | strict like 027|-|-| | |
| 0f192147631d | ubuntu:latest | LYNISCHECK | LYNISSUGGEST | FILE-6310|To decrease the | GO |
| | | | | impact of a full /home file | |
| | | | | system, place /home on a | |
| | | | | separated partition|-|-| | |
| 0f192147631d | ubuntu:latest | LYNISCHECK | LYNISSUGGEST | FILE-6310|To decrease the | GO |
| | | | | impact of a full /tmp file | |
| | | | | system, place /tmp on a | |
| | | | | separated partition|-|-| | |
| 0f192147631d | ubuntu:latest | LYNISCHECK | LYNISSUGGEST | FILE-6310|To decrease the | GO |
| | | | | impact of a full /var file | |
| | | | | system, place /var on a | |
| | | | | separated partition|-|-| | |
| 0f192147631d | ubuntu:latest | LYNISCHECK | LYNISSUGGEST | FILE-6336|Check your /etc/fstab | GO |
| | | | | file for swap partition mount | |
| | | | | options|-|-| | |
| 0f192147631d | ubuntu:latest | LYNISCHECK | LYNISSUGGEST | STRG-1840|Disable drivers like | GO |
| | | | | USB storage when not used, to | |
| | | | | prevent unauthorized storage or | |
| | | | | data theft|-|-| | |
| 0f192147631d | ubuntu:latest | LYNISCHECK | LYNISSUGGEST | STRG-1846|Disable drivers like | GO |
| | | | | firewire storage when not used, | |
| | | | | to prevent unauthorized storage | |
| | | | | or data theft|-|-| | |
| 0f192147631d | ubuntu:latest | LYNISCHECK | LYNISSUGGEST | PKGS-7370|Install debsums | GO |
| | | | | utility for the verification of | |
| | | | | packages with known good | |
| | | | | database.|-|-| | |
| 0f192147631d | ubuntu:latest | LYNISCHECK | LYNISPKGVULN | tzdata | STOP |
| 0f192147631d | ubuntu:latest | LYNISCHECK | LYNISWARN | PKGS-7392|Found one or more | WARN |
| | | | | vulnerable packages.|M|-| | |
| 0f192147631d | ubuntu:latest | LYNISCHECK | LYNISSUGGEST | PKGS-7392|Update your system | GO |
| | | | | with apt-get update, apt-get | |
| | | | | upgrade, apt-get dist-upgrade | |
| | | | | and/or unattended-upgrades|-|-| | |
| 0f192147631d | ubuntu:latest | LYNISCHECK | LYNISSUGGEST | PKGS-7394|Install package apt- | GO |
| | | | | show-versions for patch | |
| | | | | management purposes|-|-| | |
| 0f192147631d | ubuntu:latest | LYNISCHECK | LYNISSUGGEST | NETW-3032|Install ARP | GO |
| | | | | monitoring software like | |
| | | | | arpwatch|-|-| | |
| 0f192147631d | ubuntu:latest | LYNISCHECK | LYNISSUGGEST | FIRE-4590|Configure a | GO |
| | | | | firewall/packet filter to | |
| | | | | filter incoming and outgoing | |
| | | | | traffic|-|-| | |
| 0f192147631d | ubuntu:latest | LYNISCHECK | LYNISSUGGEST | LOGG-2130|Check if any syslog | GO |
| | | | | daemon is running and correctly | |
| | | | | configured.|-|-| | |
| 0f192147631d | ubuntu:latest | LYNISCHECK | LYNISWARN | LOGG-2130|No syslog daemon | WARN |
| | | | | found|H|-| | |
| 0f192147631d | ubuntu:latest | LYNISCHECK | LYNISWARN | LOGG-2138|klogd is not running, | WARN |
| | | | | which could lead to missing | |
| | | | | kernel messages in log | |
| | | | | files|L|-| | |
| 0f192147631d | ubuntu:latest | LYNISCHECK | LYNISSUGGEST | BANN-7126|Add a legal banner to | GO |
| | | | | /etc/issue, to warn | |
| | | | | unauthorized users|-|-| | |
| 0f192147631d | ubuntu:latest | LYNISCHECK | LYNISSUGGEST | BANN-7130|Add legal banner to | GO |
| | | | | /etc/issue.net, to warn | |
| | | | | unauthorized users|-|-| | |
| 0f192147631d | ubuntu:latest | LYNISCHECK | LYNISSUGGEST | ACCT-9622|Enable process | GO |
| | | | | accounting|-|-| | |
| 0f192147631d | ubuntu:latest | LYNISCHECK | LYNISSUGGEST | ACCT-9626|Enable sysstat to | GO |
| | | | | collect accounting (no | |
| | | | | results)|-|-| | |
| 0f192147631d | ubuntu:latest | LYNISCHECK | LYNISSUGGEST | ACCT-9628|Enable auditd to | GO |
| | | | | collect audit information|-|-| | |
| 0f192147631d | ubuntu:latest | LYNISCHECK | LYNISSUGGEST | TIME-3104|Use NTP daemon or NTP | GO |
| | | | | client to prevent time | |
| | | | | issues.|-|-| | |
| 0f192147631d | ubuntu:latest | LYNISCHECK | LYNISSUGGEST | FINT-4350|Install a file | GO |
| | | | | integrity tool to monitor | |
| | | | | changes to critical and | |
| | | | | sensitive files|-|-| | |
| 0f192147631d | ubuntu:latest | LYNISCHECK | LYNISSUGGEST | TOOL-5002|Determine if | GO |
| | | | | automation tools are present | |
| | | | | for system management|-|-| | |
| 0f192147631d | ubuntu:latest | LYNISCHECK | LYNISSUGGEST | KRNL-6000|One or more sysctl | GO |
| | | | | values differ from the scan | |
| | | | | profile and could be | |
| | | | | tweaked|-|-| | |
| 0f192147631d | ubuntu:latest | LYNISCHECK | LYNISSUGGEST | HRDN-7230|Harden the system by | GO |
| | | | | installing at least one malware | |
| | | | | scanner, to perform periodic | |
| | | | | file system scans|-|-| | |
| 0f192147631d | ubuntu:latest | ANCHORESEC | VULNLOW | Low Vulnerability found in | GO |
| | | | | package – glibc (CVE-2015-5180 | |
| | | | | – http://people.ubuntu.com | |
| | | | | /~ubuntu- | |
| | | | | security/cve/CVE-2015-5180) | |
| 0f192147631d | ubuntu:latest | ANCHORESEC | VULNMEDIUM | Medium Vulnerability found in | WARN |
| | | | | package – coreutils | |
| | | | | (CVE-2016-2781 – | |
| | | | | http://people.ubuntu.com | |
| | | | | /~ubuntu- | |
| | | | | security/cve/CVE-2016-2781) | |
| 0f192147631d | ubuntu:latest | ANCHORESEC | VULNLOW | Low Vulnerability found in | GO |
| | | | | package – shadow (CVE-2013-4235 | |
| | | | | – http://people.ubuntu.com | |
| | | | | /~ubuntu- | |
| | | | | security/cve/CVE-2013-4235) | |
| 0f192147631d | ubuntu:latest | ANCHORESEC | VULNMEDIUM | Medium Vulnerability found in | WARN |
| | | | | package – glibc (CVE-2016-3706 | |
| | | | | – http://people.ubuntu.com | |
| | | | | /~ubuntu- | |
| | | | | security/cve/CVE-2016-3706) | |
| 0f192147631d | ubuntu:latest | ANCHORESEC | VULNLOW | Low Vulnerability found in | GO |
| | | | | package – glibc (CVE-2016-1234 | |
| | | | | – http://people.ubuntu.com | |
| | | | | /~ubuntu- | |
| | | | | security/cve/CVE-2016-1234) | |
| 0f192147631d | ubuntu:latest | ANCHORESEC | VULNMEDIUM | Medium Vulnerability found in | WARN |
| | | | | package – bzip2 (CVE-2016-3189 | |
| | | | | – http://people.ubuntu.com | |
| | | | | /~ubuntu- | |
| | | | | security/cve/CVE-2016-3189) | |
| 0f192147631d | ubuntu:latest | ANCHORESEC | VULNMEDIUM | Medium Vulnerability found in | WARN |
| | | | | package – util-linux | |
| | | | | (CVE-2016-2779 – | |
| | | | | http://people.ubuntu.com | |
| | | | | /~ubuntu- | |
| | | | | security/cve/CVE-2016-2779) | |
| 0f192147631d | ubuntu:latest | FINAL | FINAL | | STOP |
+————–+—————+————+————–+———————————+————+

Peek Into Your Containers With 3 Simple Commands

If you are just looking to run a common Linux application such as Tomcat or WordPress it’s far simpler to download a pre-packaged image from DockerHub than to install the application from scratch. But with tens of thousands of images on DockerHub you are likely to find many variations of the application in question, even with official repositories you may find multiple different versions of an application.

In previous blog posts, we have introduced the Anchore open source project which provides a rich toolset to allow developers, operations, and security teams to maintain full visibility of the ‘chain of custody’ as containers move through the development lifecycle.

In our last blog, we covered a couple of simple use cases, allowing a user to dig into the contents of a container looking at specific files or packages. In this blog post, I wanted to introduce you to three interesting features within Anchore.

There are seven top-level commands within the Anchore command-line tools. These can be seen by running the anchore command with no other options:

Command  Description
analyze  Perform analysis on specified image IDs
explore  Search, report and query specified image IDs
gate  Perform and view gate evaluation on selected images
subscriptions  Manage local subscriptions
sync  Synchronize images and metadata
system  Anchore system-level operations
toolbox  Useful tools and operations on images and containers

In previous blog posts, we have presented the analyze, explore and gate commands, but in this blog post, we wanted to highlight a couple of the lesser-known features in the toolbox that we found very useful in our day to day use of containers.

Running anchore toolbox will show the sub-commands available:

Command  Description
setup-module-dev  Setup a module development environment
show  Show image summary information
show-dockerfile  Generate (or display actual) image Dockerfile
show-familytre  Show image family tree image IDs
show-layers  Show image layer IDs
show-taghistory  Show history of all known repo/tags for image
unpack  Unpack and Squash image to local filesystem

While Docker allows applications to be packaged as easily distributed containers, transparently providing both the underlying operating system and the application, you often need to know exactly what operating system this application is built upon. This information may be required to fulfill compliance or audit requirements in your organization or to ensure that you are only deploying operating systems for which you have commercial support agreements.

If you are lucky then the full description of the container on the DockerHub portal contains details about the operating system used. But in many cases, this information isn’t presented.

One way to ascertain what operating system is used is to download and run the image and inspect the file system however that’s a manual and time-consuming process. The show command presents a simple way to retrieve this information.

Taking a look at nginx, the most popular image on DockerHub:

IMAGEID='0d409d33b27e47423b049f7f863faa08655a8c901749c2b25b93ca67d01a470d'
REPOTAGS='docker.io/nginx:latest'
DISTRO='debian'
DISTROVERS='8'
SHORTID='0d409d33b27e'
PARENTID=''
BASEID='0d409d33b27e47423b049f7f863faa08655a8c901749c2b25b93ca67d01a470d'

Here we see the latest image is built on Debian version 8 (Jessie).

Using another useful toolbox function is show-tag history, which shows the known tags for a given image. Here we can see that the latest image is also tagged as 1.11 and 1.11.1:

+--------------+---------------------+-------------------------+
|   ImageId    |         Date        |        KnownTags        |
+--------------+---------------------+-------------------------+
| 0d409d33b27e | Wed Jun 15 14:37:03 | nginx:1.11,nginx:1.11.1 |
|              |         2016        |      ,nginx:latest      |
| 0d409d33b27e | Wed Jul 13 15:57:51 | nginx:1.11,nginx:1.11.1 |
|              |         2016        |      ,nginx:latest      |
| 0d409d33b27e | Wed Jul 13 16:35:14 |  docker.io/nginx:latest |
|              |         2016        |                         |
+--------------+---------------------+-------------------------+

The final toolbox feature I want to highlight is a feature that many users do not know is available, that is the ability to retrieve the dockerfile for a given image. The show-dockerfile command will either display the dockerfile, if it was available during the image analysis phase, or will generate the dockerfile from the image.

This information may be useful if you wish to look under the covers to understand how the container was created or to check for any potential issues with the container content. The contents of the dockerfile may also be used within our ‘gates’ feature, for example allowing you to specify that specific ports may not be exposed.

# anchore toolbox --image=nginx:latest show-dockerfile
--- ImageId ---
0d409d33b27e

--- Mode ---
Guessed

Here the mode Guessed indicates that the dockerfile was generated by the tool during image analysis.

There are other toolbox commands that include the ability to show the family tree of an image, display the image layers, or unpack the image to the local filesystem.

If you haven’t already installed Anchore and begun scanning your container images, take a look at our installation and quick-start guides at our wiki below or by going to https://github.com/anchore/anchore/wiki.

Anchore Use Cases

We just released the first version of the open-source Anchore command-line tools and we’re excited for the container community to take a look at what we’ve done and provide feedback. This blog post will outline a couple of basic use cases for some of the queries you can run using the tools, and hopefully, give you some ideas for integrating Anchore into your container image management workflow.

Anchore scans container images and records a great deal of information about them: package and file lists, image hierarchies and family trees to track provenance and changes, and maps known security vulnerabilities to the packages installed on your container images. The command-line tools provide a number of ways to query this data.

If you haven’t already installed Anchore and begun scanning your container images, take a look at our installation and quick-start guides.

Once you’re set-up, let’s run a couple of basic package queries. Maybe you want to confirm that a certain library of a specific version is installed across all of your images, for consistency–there’s nothing worse than the dependency hell of a couple of mismatched libraries causing issues throughout your infrastructure. Or maybe your organizational policies require that a certain monitoring package be installed consistently on all of your production containers. These are questions that Anchore can quickly and easily answer.

Here’s an example command that searches a file containing a list of image ids for the “curl” package, and reports the version found:

+————–+———————–+————+———+———————-+
| ImageID | Repo/Tag | QueryParam | Package | Version |
+————–+———————–+————+———+———————-+
| 6a77ab6655b9 | centos:6 | curl | curl | 7.19.7-52.el6 |
| 20c80ee30a09 | ryguyrg/neo4j-panama- | curl | curl | 7.38.0-4+deb8u3 |
| | papers:latest | | | |
| 8fe6580be3ef | slackbridge:latest | curl | curl | 7.43.0-1ubuntu2.1 |
| db688f102aeb | devbad:latest | curl | curl | 7.29.0-25.el7.centos |
+————–+———————–+————+———+———————-+

We just released the first version of the open-source Anchore command-line tools and we’re excited for the container community to take a look at what we’ve done and provide feedback. This blog post will outline a couple of basic use cases for that’s pretty simple. How about something a little bit more interesting? Since Anchore has the ability to correlate information about all of your container images together, it can make useful suggestions based on not just the contents of one image, but on all of your images. For example, the “base-image” query will show you if a particular image is up to date relative to its base image:

# anchore explore –imagefile ~/myimages.txt query base-status all
+————–+———————–+—————+———————–+————+————–+——————–+
| InputImageId | InputRepo/Tag | CurrentBaseId | CurrentBaseRepo/Tag | Status | LatestBaseId | LatestBaseRepo/Tag |
+————–+———————–+—————+———————–+————+————–+——————–+
| db688f102aeb | devbad:latest | db688f102aeb | devbad:latest | up-to-date | N/A | N/A |
| 20c80ee30a09 | ryguyrg/neo4j-panama- | 20c80ee30a09 | ryguyrg/neo4j-panama- | up-to-date | N/A | N/A |
| | papers:latest | | papers:latest | | | |
| 8fe6580be3ef | slackbridge:latest | 0b4516a442e7 | ubuntu:wily | up-to-date | N/A | N/A |
| 89fbcb00e7a2 | devgood:latest | 2fa927b5cdd3 | ubuntu:latest | up-to-date | N/A | N/A |
| 6a77ab6655b9 | centos:6 | 6a77ab6655b9 | centos:6 | up-to-date | N/A | N/A |
+————–+———————–+—————+———————–+————+————–+——————–+

If the status is ‘up-to-date’, it means that the container image the input image was initially built from (e.g. what was specified in the input image’s FROM line in its Dockerfile) is the same currently as it was when originally built. The status is ‘out-of-date’, meaning that if you were to rebuild the input image with the same Dockerfile, it would result in a different final image since the base has since been updated (indicated by the LatestBaseId column). This query can be used to determine how ‘fresh’ the analyzed container images are with respect to their base images and could trigger an action to rebuild and redeploy the application containers if they are getting too far out of date from their bases.

Anchore’s query and analysis infrastructure are pluggable, so you can write your own! Stay tuned for more interesting and useful ways to use the data that we collect: with Anchore’s help, your container infrastructure will be slim, up-to-date, and secure.

Anchore Open Source Release is Live

Whether it’s security, orchestration, management or monitoring, there are many projects, products and companies vying to provide users a way to successfully deploy their apps at scale, with a minimum amount of friction. All of these projects are trying to solve a runtime problem with containers or performing simple security vulnerability scanning, but the big question of what happens in the pre-production cycle remains a period I’ll call the “Dark Ages of the Container Lifecycle”.

With traditional IT models this problem was largely addressed by standardizing on commercial Linux distributions such as Red Hat’s Enterprise Linux, now the gold standard within Fortune 1000 companies. This helped aggregate and certify the Linux distribution with thousands of ISVs, providing a production-ready “golden image,” and ensuring enterprise-grade support. Today, that certification process for containers is mostly self-driven and highly unpredictable, with many stakeholders and no single “throat to choke.”

Anchore Open Source Release

This week’s Anchore open source release addresses a major challenge in today’s container technology space and provides a platform for the open source community to participate and share ideas. Our open source release will give users the ability to pick from a vetted list of containers, analyze new containers, and inspect existing ones — either in the public domain or behind a firewall. In the past, these tasks were left to the user, creating an even bigger challenge and the gap between developers and operations. Anchore bridges the gap between Dev. and Ops.

Data Analytics meets Container Compute

An unprecedented amount of churn (more than any other one technology in the past, and over a billion downloads), illustrates the tremendous amount of information exchange at stake and at risk for container sprawl. Managing all this data — today and over the coming years — becomes a challenging geometric problem, to say the least. Container dependencies and relationships, security checks, functional dependencies, versioning, and so on, all become incredibly hard to manage. This will widen the gap between Dev. and Ops, and in turn make transparency and predictability paramount for operations and security teams.

Pre-production data for production readiness

Tens of gigabytes of information are now at the fingertips of Anchore users. Today, our open source release provides this data for the top 10 most downloaded application containers, including Ubuntu, NginX, Redis and MySQL, with new ones to follow as the need arises. Our hosted service is continuously tracking and analyzing every update and upgrade while keeping track of earlier versions for completeness. This data can then be used as a baseline to set and enforce policies, coupled with a proactive notification mechanism that lets users see potential vulnerabilities and critical bugs in a timely fashion. Anchore will provide operations and security teams the confidence necessary to deploy in production.

Anchore longer term

We are still in the first inning of a very long game in IT. Security, orchestration and management challenges are incrementally being addressed by small and large companies alike. The transformational effect containerization will have on IT will bring about new and interesting challenges. Future releases of Anchore, starting with our beta release next month, will address the data aspects of containers, provide actionable advice based on that data, and bring about more transparency. Most importantly, Anchore promises the predictability and control needed for mission-critical production deployments.

Introducing Anchore for Docker Technology Demo & System

Today, we are going to show how Anchore technology fits into a Docker-based container workflow to provide trust, insight, and validation to your container ecosystem without inhibiting the flexibility, agility, and speed of development that makes container-based deployment platforms so valuable. This post will walk through using Anchore in a deployment scenario for a container-based application.

And we’ll also discuss the container registry, curation, and management capabilities of Anchore as well as analysis, control, inspection, and review of containers.

The rest of this document is organized around a container-based application deployment workflow composed of the following basic phases:

  1. Creation of trusted well-known base containers
  2. Creation and validation of application containers built by developers or a CI/CD system
  3. Analysis of containers to determine acceptance for production use prior to deployment

This post will present both an operations and a developer perspective on each phase, and describes how Anchore operates in each one.

Setup and Creating Anchore Curated Containers

Starting with the operations perspective, the first step is to create a registry that hosts trusted containers, and exposes them to development teams for use as the base containers from which application containers are built. This is the job of the Anchore registry management tool. The tool creates a local registry and orchestrates the images pulled fromDocker Hub (or another public-facing registry) with the image analysis metadata provided by the Anchore service.

So, let’s first create a local registry and sync it to Anchore. Starting with an installed registry tool, run the initcommand to initialize the registry and do an initial sync:

[root@tele ~]# anchore-registry init
Creating new anchore anchore-reg at /root/.local/
[root@tele ~]#

After the command is run, the registry is now initialized and contains some metadata about the base subscribed images as well as vulnerability data. You can view the set of subscribed containers by running the subscriptions command

[root@tele ~]# anchore-registry subscriptions
[]
[root@tele ~]#

To subscribe to a few more containers, for example mongo and redis, run the subscribe command. This command will not pull any data, only change the subscription values:

[root@tele ~][root@tele ~]# anchore-registry subscribe centos ubuntu mysql redis
Subscribing to containers [u’centos’, u’ubuntu’, u’mysql’, u’redis’]
Checking sources: [u’ubuntu’, u’centos’, u’busybox’, u’postgres’, u’mysql’,
u’registry’, u’redis’, u’mongo’, u’couchbase’, u’couchdb’]
[root@tele ~]#
[root@tele ~]# anchore-registry subscriptions
[u’centos’, u’ubuntu’, u’mysql’, u’redis’]
[root@tele ~]# 

To pull those containers and metadata from Anchore, run the sync command:

[root@tele ~]# anchore-registry sync
Synchronizing anchore registry with remote
[root@tele ~]#

By synchronizing with Anchore, we now have the ability to inspect the container to see what kind of analysis and information you get from a curated Anchore container. Let’s search those containers for specific packages.

We now have the ability to “navigate” the information that Anchore gathers about the subscribed containers. For example, you can find all of the containers that have a particular package installed:

[root@tele ~]# anchore --allanchore navigate --search --has-package ‘ssl*’
+--------------+--------------------+----------------------+-------------------+---------------------+
| ImageId | Current Repo/Tags | Past Repo/Tags | Package | Version |
+--------------+--------------------+----------------------+-------------------+---------------------+
| 778a53015523 | centos:latest | centos:latest | openssl-libs | 1.0.1e-51.el7_2.4 |
| f48f462dde2f | devone:apr15 | devone:latest | openssl-libs | 1.0.1e-51.el7_2.4 |
| | devone:latest | devone:apr15 | | |
| 0f0e96f1f267 | redis:latest | redis:latest | libssl1.0.0:amd64 | 1.0.1k-3+deb8u4 |
| b72889fa879c | | ubuntu:latest | libssl1.0.0:amd64 | 1.0.1f-1ubuntu2.18 |
| b72889fa879c | | ubuntu:latest | libgnutls- | 2.12.23-12ubuntu2.5 |
| | | | openssl27:amd64 | |
+--------------+--------------------+----------------------+-------------------+---------------------+
[root@tele ~]#

That output shows us which images in the local docker repo contain the ssl* package.

Analyzing Changed Containers

Now, assume that a developer has built an application container using one of the curated Anchore images and has pushed that container back into the local docker repo. In order to determine if this developer container is okay to push into production, it’s helpful to see how the container changed from its parent image (in the FROM clause of the dockerfile).

Anchore provides a specific report for this that gives insight into exactly what has changed at a file, package, and checksum level. If, for example, the developer built the container with the following steps:

[root@tele ~]# cat Dockerfile
FROM centos:latest
RUN yum -y install wget
CMD ["/bin/echo", "HELLO WORLD FROM DEVONE"]
[root@tele ~]#

[root@tele ~]# docker build --no-cache=True -t devone .
...
...
Successfully built f48f462dde2f
[root@tele ~]#

First, we need to run the analysis tools on the image. For convenience we can just specify all local images (those already processed are skipped). The result of this command is locally stored analysis data for the images that have not been analyzed yet:

[root@tele ~]# anchore --image devone analyze --dockerfile
./DockerfileRunning analyzers: 2791834d4281 ...SUCCESS
Running analyzers: f48f462dde2f ...SUCCESS
Running analyzers: 778a53015523 ...SUCCESS
Running differs: f48f462dde2f to 778a53015523...SUCCESS
Running differs: 778a53015523 to f48f462dde2f...SUCCESS
[root@tele ~]#

Now, we can view the reports and metadata that resulted from the analysis pass:

[root@tele ~]# anchore --image devone analyze --dockerfile
./DockerfileRunning analyzers: 2791834d4281 ...SUCCESS
Running analyzers: f48f462dde2f ...SUCCESS
Running analyzers: 778a53015523 ...SUCCESS
Running differs: f48f462dde2f to 778a53015523...SUCCESS
Running differs: 778a53015523 to f48f462dde2f...SUCCESS
[root@tele ~]#

With this report, we can see exactly the delta between an image and its parent:

[[root@tele ~]# anchore --image devone navigate -- report

CI/CD Gates

The next step is to determine if the image is acceptable to put into production. Anchore provides mechanisms to describe gating policies that are run against each image and can be used to gate an image’s entry into production (e.g., as a step in a continuous integration pipeline).

Gate policies can include things like file content changes, properties of Dockerfiles, and presence of known vulnerabilities. To check an image against the gates, run the control —gate command. The output will show all of the gate evaluations against the image:

[root@tele ~]# anchore --image devone control --gate
+--------------+-----------------+-------------+
| f48f462dde2f | ANCHORECHECK | GO |
| f48f462dde2f | PKGDIFF | GO |
| f48f462dde2f | DOCKERFILECHECK | GO |
| f48f462dde2f | SUIDDIFF | GO |
| f48f462dde2f | USERIMAGECHECK | GO |
| f48f462dde2f | NETPORTS | GO |
| f48f462dde2f | FINALACTION | GO |
+--------------+-----------------+-------------+
[root@tele ~]#

If these statuses are all GO, then that container has passed all gates and is ready for production or further functional testing in a CI/CD system.

Aggregate Container Introspection and Search

After some time has passed and your Docker environment has accrued more developer container images, Anchore tools can be used to perform a variety of exploration, introspection and search actions over the entire set of analyzed container images.

We can search the container image space for packages, files, common packages that have been added, and various types of differences between the application containers and their Anchore curated base images. Some example queries are illustrated below.

This query shows us all images that have an installed /etc/passwd file that is different from its base image (i.e., has been modified either directly or indirectly):

[root@tele ~]# anchore --alldocker navigate --search --show-file-diffs /etc/
passwd
+--------------+-------------------+----------------+--------------+--------------+----------------------+----------------------+
| ImageId | Current Repo/Tags | Past Repo/Tags | BaseId | File | Image MD5 | Base MD5 |
+--------------+-------------------+----------------+--------------+--------------+----------------------+----------------------+
| 3ceace5b73b0 | devfive:latest | devfive:latest | 778a53015523 | ./etc/passwd | 7073ff817bcd08c9b9c8 | 60c2b408a06eda681ced |
| | | | | | cee4b0dc7dea | a05b0cad8f8a |
| c67409e321d6 | devfive:apr15 | devfive:apr15 | 778a53015523 | ./etc/passwd | 7073ff817bcd08c9b9c8 | 60c2b408a06eda681ced |
| | | devfive:latest | | | cee4b0dc7dea | a05b0cad8f8a |
+--------------+-------------------+----------------+--------------+--------------+----------------------+----------------------+
[root@tele ~]#

The next query shows all images that are currently in a STOP Anchore gate state:

[root@tele ~]# anchore --alldocker navigate --search --has-gateaction STOP
+--------------+--------------------+--------------------+-------------+
| ImageId | Current Repo/Tags | Past Repo/Tags | Gate Action |
+--------------+--------------------+--------------------+-------------+
| 3ceace5b73b0 | devfive:latest | devfive:latest | STOP |
| 55c843b5c7a3 | devthirteen:apr15 | devthirteen:apr15 | STOP |
| | devthirteen:latest | devthirteen:latest | |
| 2785fa3ab761 | devfifteen:apr15 | devfifteen:apr15 | STOP |
| | devfifteen:latest | devfifteen:latest | |
| 4e02de1e5ca5 | devtwelve:apr15 | devtwelve:apr15 | STOP |
| | devtwelve:latest | devtwelve:latest | |
| dd490a4ef2b3 | devsix:apr15 | devsix:apr15 | STOP |
| | devsix:latest | devsix:latest | |
| a7f1bb64c477 | develeven:apr15 | develeven:apr15 | STOP |
| | develeven:latest | develeven:latest | |
| b33f58798470 | devseven:apr15 | devseven:apr15 | STOP |
| | devseven:latest | devseven:latest | |
| c67409e321d6 | devfive:apr15 | devfive:apr15 | STOP |
| | | devfive:latest | |
| f48f462dde2f | devone:apr15 | devone:latest | STOP |
| | devone:latest | devone:apr15 | |
| 0f0e96f1f267 | redis:latest | redis:latest | STOP |
| 63a92d0c131d | mysql:latest | mysql:latest | STOP |
+--------------+--------------------+--------------------+-------------+
[root@tele ~]#

This last query shows us a count of common packages that have been installed in applications containers, which can be used to determine how popular certain package installations are amongst those building containers from base images:

[root@tele ~]# anchore --alldocker navigate --search --common-packages
+--------------+-------------------+----------------+-------------------+--------------------+
| BaseId | Current Repo/Tags | Past Repo/Tags | Package | Child Images w Pkg |
+--------------+-------------------+----------------+-------------------+--------------------+
| 778a53015523 | centos:latest | centos:latest | wget | 2 |
| 778a53015523 | centos:latest | centos:latest | sudo | 2 |
| 778a53015523 | centos:latest | centos:latest | gpg-pubkey | 4 |
| 44776f55294a | ubuntu:latest | ubuntu:latest | wget | 9 |
| 44776f55294a | ubuntu:latest | ubuntu:latest | ca-certificates | 9 |
| 44776f55294a | ubuntu:latest | ubuntu:latest | libssl1.0.0:amd64 | 9 |
| 44776f55294a | ubuntu:latest | ubuntu:latest | libidn11:amd64 | 9 |
| 44776f55294a | ubuntu:latest | ubuntu:latest | openssl | 9 |
+--------------+-------------------+----------------+-------------------+--------------------+
[root@tele ~]#

Container Image Visualizations

Anchore CLI tools can be used to view, inspect, search, and perform specific queries in individual container images and sets, but it is also often helpful to be able to view a container image collection graphically and to also apply coloring to indicate certain qualities of images in the visual representation. Anchore has a number of visualizations that can be generated from analysis data.

As an example, we have a visual representation of container images in a system with just 15 total application containers, with each node being colored either green, yellow or red (indicating the level of severity of a present CVE vulnerability within the container image).

This visualization can be performed at any time against the list of static container images, or against a list of images that has been derived from the set of deployed containers.

Enterprise Networking Planet, Container Networking Challenges for Enterprises

Arthur Cole – Enterprise Networking Planet – April 28, 2016

Establishing connectivity between containers in a network fabric is one challenge; coordinating their activities is yet another. According to Computer Weekly’s Adrian Bridgwater, a key issue is predictability, which is largely a function of the enterprise’s ability to inspect, certify and synchronize container contents.

A start-up called Anchore Inc. targets this process through a common portal that application developers can use to select verified containers from established registries. In this way, they receive containers that have been pre-screened for compatibility, vulnerability and other aspects that are crucial for deploying tightly orchestrated container environments quickly and easily.

Read the original and complete article on Enterprise Networking Planet.

The Cloudcast Podcast: Trouble Inside Your Containers

Last week, our very own Tim Gerla, VP of Product, and Dan Nermi, CTO and Co-Founder, were interviewed in an episode of Cloudcast. Hosts Aaron Delp and Brian Gracely spoke with Tim and Dan about a number of issues including container security, how to avoid slowing down developers, and the challenges that Anchore is attempting to solve.

You can listen to the podcast now at The Cloudcast’s website for free.  The Cloudcast is an award-winning podcast on all things cloud computing, AWS Ecosystem, open source, DevOps, AppDev, SaaS, and SDN.

Computer Weekly: Anchore, A New Name for Container Predictability

Adrian Bridgewater – Computer Weekly – April 8, 2016

As a newly formed operational entity, Anchore Inc. has announced the formation of the company itself and (in literally the same mouthful) the firm has launched its beta program for users working with containers.

Users can sign up for the Anchore beta program now with expected availability in Q2 of 2016.

But what is Anchore and how do we achieve container predictability?

Read the original and complete article on ComputerWeekly.com.

Fortune: Stealthy Startup Says It Can Build Safer Software

Barb Darrow – Fortune – April 6, 2016

Fortune_logo_logotype_red

Anchore to certify software containers as ready for prime time.

Saïd Ziouani, one of the forces behind Ansible, the tool that helps automate software development and deployment, is back with a new company.

Anchore, based in Santa Barbara, Calif., is making its debut Wednesday with $2.5 million in seed money and what it says is a new way to inspect, track, and secure software containers. “We’re opening up the box,” Ziouani noted. “We can tell exactly where it came from, who touched it, and if it’s ready for mission-critical production environment or not.”

Read the original and complete article on Fortune.com.

Anchore’s Official Launch: How Did We Get Here?

If you spend any time in the technology industry, you’ll probably be struck by how quickly the world changes. A lot of promising technological trends disappear as quickly as they appear, but some have staying power. Most are familiar with the technology adoption life cycle, originally published in 1957. Its premise holds true, and we can see it in action every day.

I’ve spent most of my career in infrastructure technology, starting with rPath, where we pioneered the concept of “software appliances”—all-in-one software units containing all of the required dependencies all the way up to a minimal version of the base operating system. rPath was around for the introduction of cloud computing in 2006 when Amazon launched the first version of its Simple Storage Service (S3). Public cloud computing has outlasted the hype and become dominant throughout many industries because of its low barrier to entry, effectively limitless scale, and aggressive pricing.

Private cloud computing, however, has not been as successful. I spent five years at Eucalyptus Systems building and selling an on-premise implementation of Amazon’s cloud platform. OpenStack was founded during that time, and we struggled to gain community and market adoption. An amazing number of platform companies spawned during that time, including Cloud.com, Nebula, and Piston Cloud. And several older infrastructure service projects moved into the private cloud market—OpenQRM, OpenNebula, and Abiquo. Still, large-scale adoption of private cloud platforms was elusive. Amazon’s EC2 was a major competitor, and despite the hype from OpenStack, Eucalyptus, and others, the advantages of public cloud computing didn’t always translate well into on-premise environments.

Container Origins and Adoption

Unless you’ve been living in a cave (No offense to cave-dwellers! I’m envious sometimes), you’ve heard of these new things like “Docker” and “containers.” Containers are actually not new. Linux has supported containers since 2001, but only lately has container-based systems management become popular. There are a lot of advantages to running apps in their own containers; advantages we were trying to exploit at rPath by bundling all of the required dependencies into a single, minimal computing environment.

Containers promise unified environments between development, test, and production, with happier and more productive developers, greater ease of troubleshooting, fewer side effects when different system components are changed, and overall, more stable and more frequently updated applications. I spent most of 2014 skeptical of container promises thinking, “Isn’t this just virtualization again?” and, “This is more hyped than OpenStack, and look at how few production deployments of THAT exist?” But as I speak to more and more container users, I realize that adoption in production is occurring at a much faster rate than any other technological change I’ve experienced in my career.

This rapid adoption is good news for a lot of people, including container management companies, developers frustrated by slow test/release cycles, and anyone responsible for managing large-scale systems with lots of dependencies and moving parts. All of this comes with risks, however. One of the problems we struggled with at rPath was handling out-of-band changes to “appliancized” systems. There was still a long modify-test-deploy cycle. This duration sometimes led to software appliances being modified in ways that were unmanageable, taking us right back to the inflexible and expensive “golden image” model, where the carefully hand-crafted golden image was the source of truth for how an environment should be constructed. If you lost that golden image, or if you needed to make major changes, you had a lot of work to do.

Problems and Solutions

Containers face many of the same problems today, including the hand-crafted, “artisan” containers, and there are few tools to manage provenance, examine container contents, and track changes over time. While this issue may not be a burden for the developers, it will rapidly become a headache for those responsible for production operations and the security of the applications.

At Anchore, launched today, we are building tools to manage contents of the containers themselves, how they change over time, where they come from, and what’s inside, giving dev, test, and ops the visibility they need for reliable and secure application deployments. While early in our journey, we see the rapid and widespread adoption of container technology and are excited to watch what the container ecosystem has in store, and how we can help improve the agility, safety, and productivity of application developers throughout the industry.

Deploying Containers with Confidence

Container technology brings about a compute model that has been long been sought after, the ability to allow for agile application development and portability across heterogeneous environments while allowing development and operations teams to align in ways never before possible. Well, that’s the promise for now at least.

The industry backing by the likes of Google, Red Hat, Intel, IBM, VMWare, to name a few, clearly shows strength and staying power of containerized apps for years to come. Google, in fact, has been using container technology since long before the buzz. Docker has helped containers cross over to the mainstream where developers can now extract value easier and faster.

But in reality, container technology has also brought about new challenges that have made deploying in production a near-impossible task. The new compute paradigm, which forces existing infrastructures to be replatformed in most cases, is creating a shift in IT thinking. While a bare-metal to virtualization transition proved a substantial density-added value and fairly easy migration, containers are different. Today, new projects make up the majority of deployments while the migration of existing infrastructure continues to lag way behind.

DockerHub, the largest container repository out there today, has seen close to 1B downloads so far. Spanning operating systems, databases, web services and many other technologies, the sheer download volume alone can intimidate anyone trying to deploy in mission-critical environments (think Linux circa 2000). With the understanding that new features are being added at an unprecedented pace, just keeping up with the latest ones is hard enough, let alone the most stable features.

Having spoken to hundreds of users over the past year, it is clear to us now that transparency and predictability are key to bridging this gap for future production deployments of containers. A billion downloads do not necessarily equate to a stable platform and could instead point to an enormous amount of potential risk. For peace of mind, users today that need a stable platform tend to pivot towards creating their own repositories as a way to mitigate the risk. These repositories will most likely become stale over time while the baseline source continues to evolve and mature. This proves, once again, that the agility of app development and deployment using containers clearly overcomes the need to keep up with the latest and greatest technology in the public repositories.

This is where Anchore comes in. Our goal is to connect these lines by creating a model of transparency and predictability, that allows users, whether in development, operations or security, to all have the tools necessary to effectively capitalize on the container compute model.

Anchore is a tool that allows everyone to not only pick a collection of container-based apps that clearly show the origin and entire history but also apps that have been vetted for security, vulnerability, and functionality completeness. A set of containers that have been “Anchore certified” through collaboration with both internal and community users and tagged as production-ready. Allowing users to not only have stable repository but one that includes the most up-to-date container functionally, security checks, and bug fixes.