Using Grype to Identify GitHub Action Vulnerabilities

About a month ago, GitHub announced the presence of a moderate security vulnerability in the GitHub Actions runner that can allow environment variables and path injection in workflows that log untrusted data to STDOUT. You can read the disclosure here for more details. Given at Anchore, we build and maintain a GitHub Action of our own; this particular announcement was one we were made aware of. While I’m sure many folks have taken the time to update their GitHub Actions accordingly, I thought this would be a good opportunity to take a closer look at setting up a CI workflow as if I were developing my own GitHub Action, and step through the options in Anchore for identifying this particular vulnerability.

To start with, I created an example repository in GitHub, demonstrating a very basic hello-world GitHub Action and workflow configuration. The configuration below scans the current directory of the project I am working on with the Anchore Container Scan Action. Under the hood, the tool scanning this directory is called Grype, an open-source project we built here at Anchore.

name: Scan current directory CI
on: [push]
jobs:
  anchore_job:
    runs-on: ubuntu-latest
    name: Anchore scan directory
    steps:
    - name: Checkout
      uses: actions/checkout@v2
    - name: Scan current project
      id: scan
      uses: anchore/scan-action@v2
      with:
        path: "./"
        fail-build: true
        acs-report-enable: true
    - name: upload Anchore scan SARIF report
      uses: github/codeql-action/upload-sarif@v1
      with:
        sarif_file: ${{ steps.scan.outputs.sarif }}

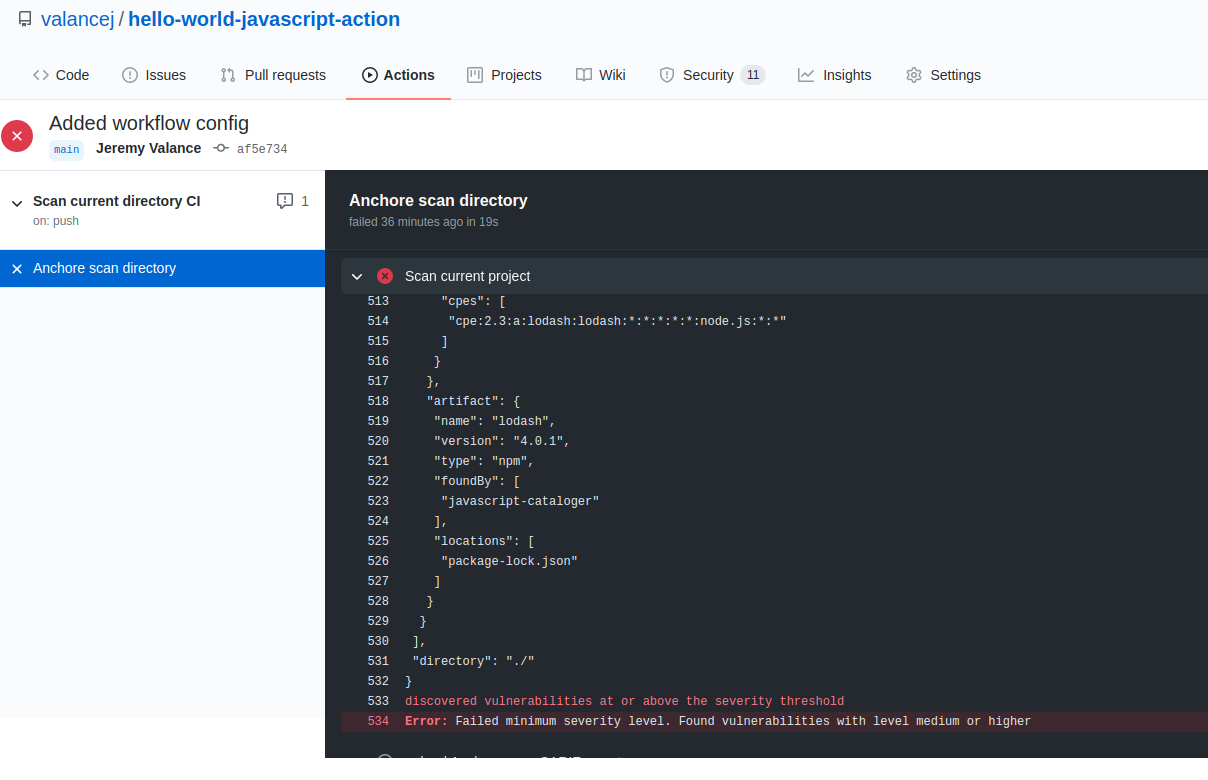
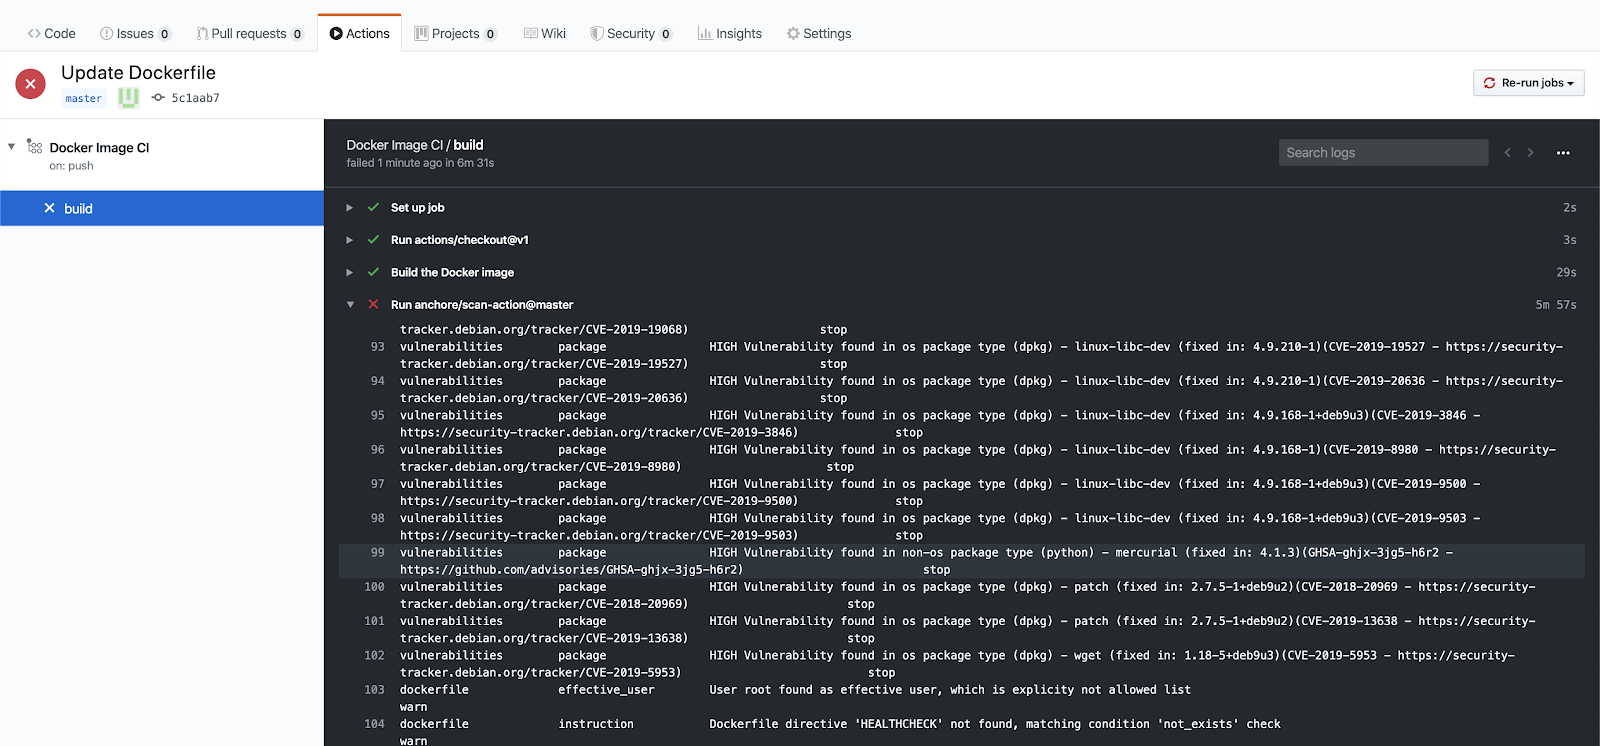
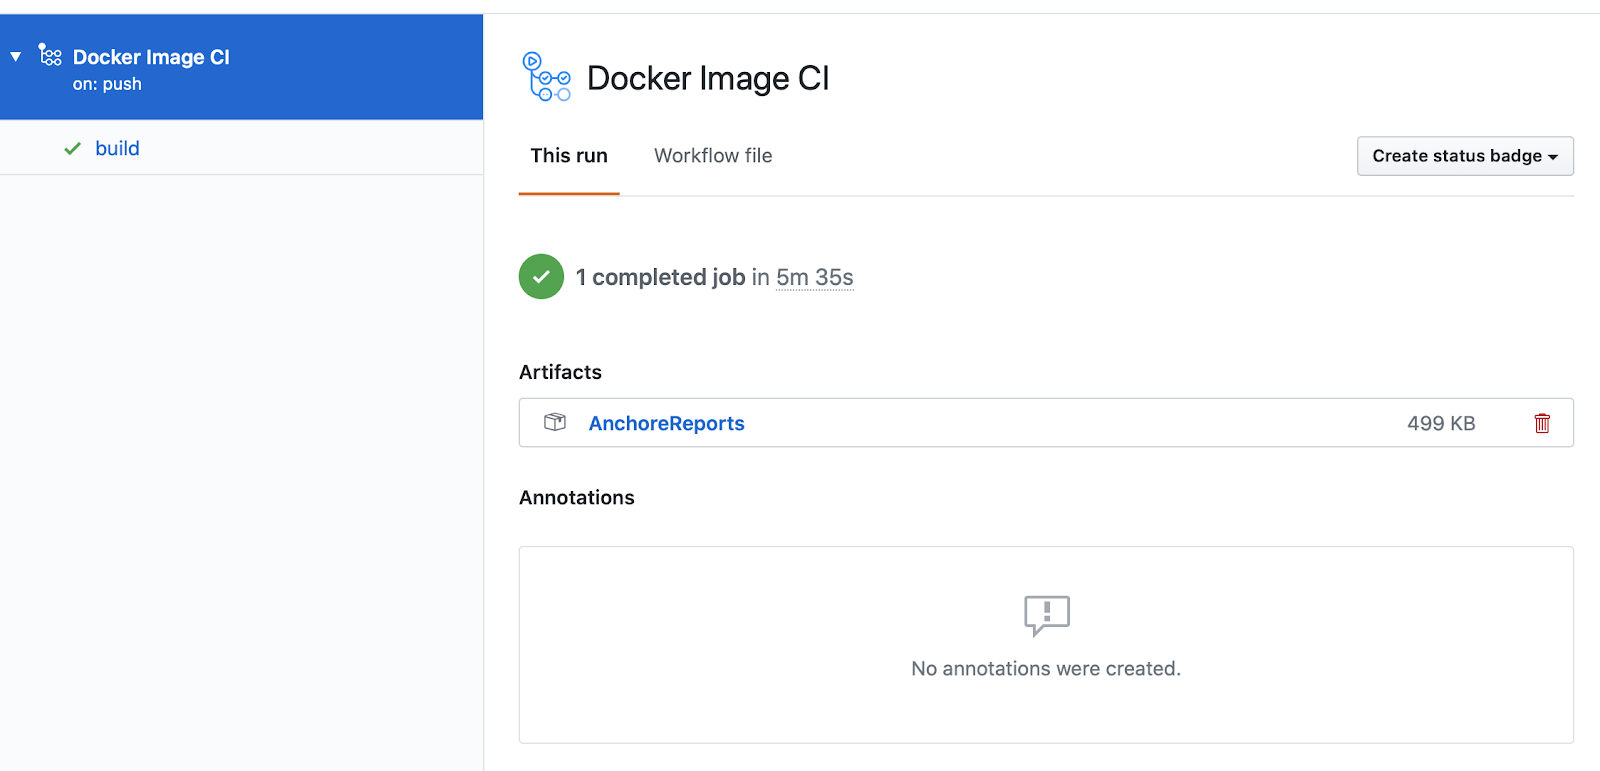
On push, I can navigate to the Actions tab and find the latest build. 

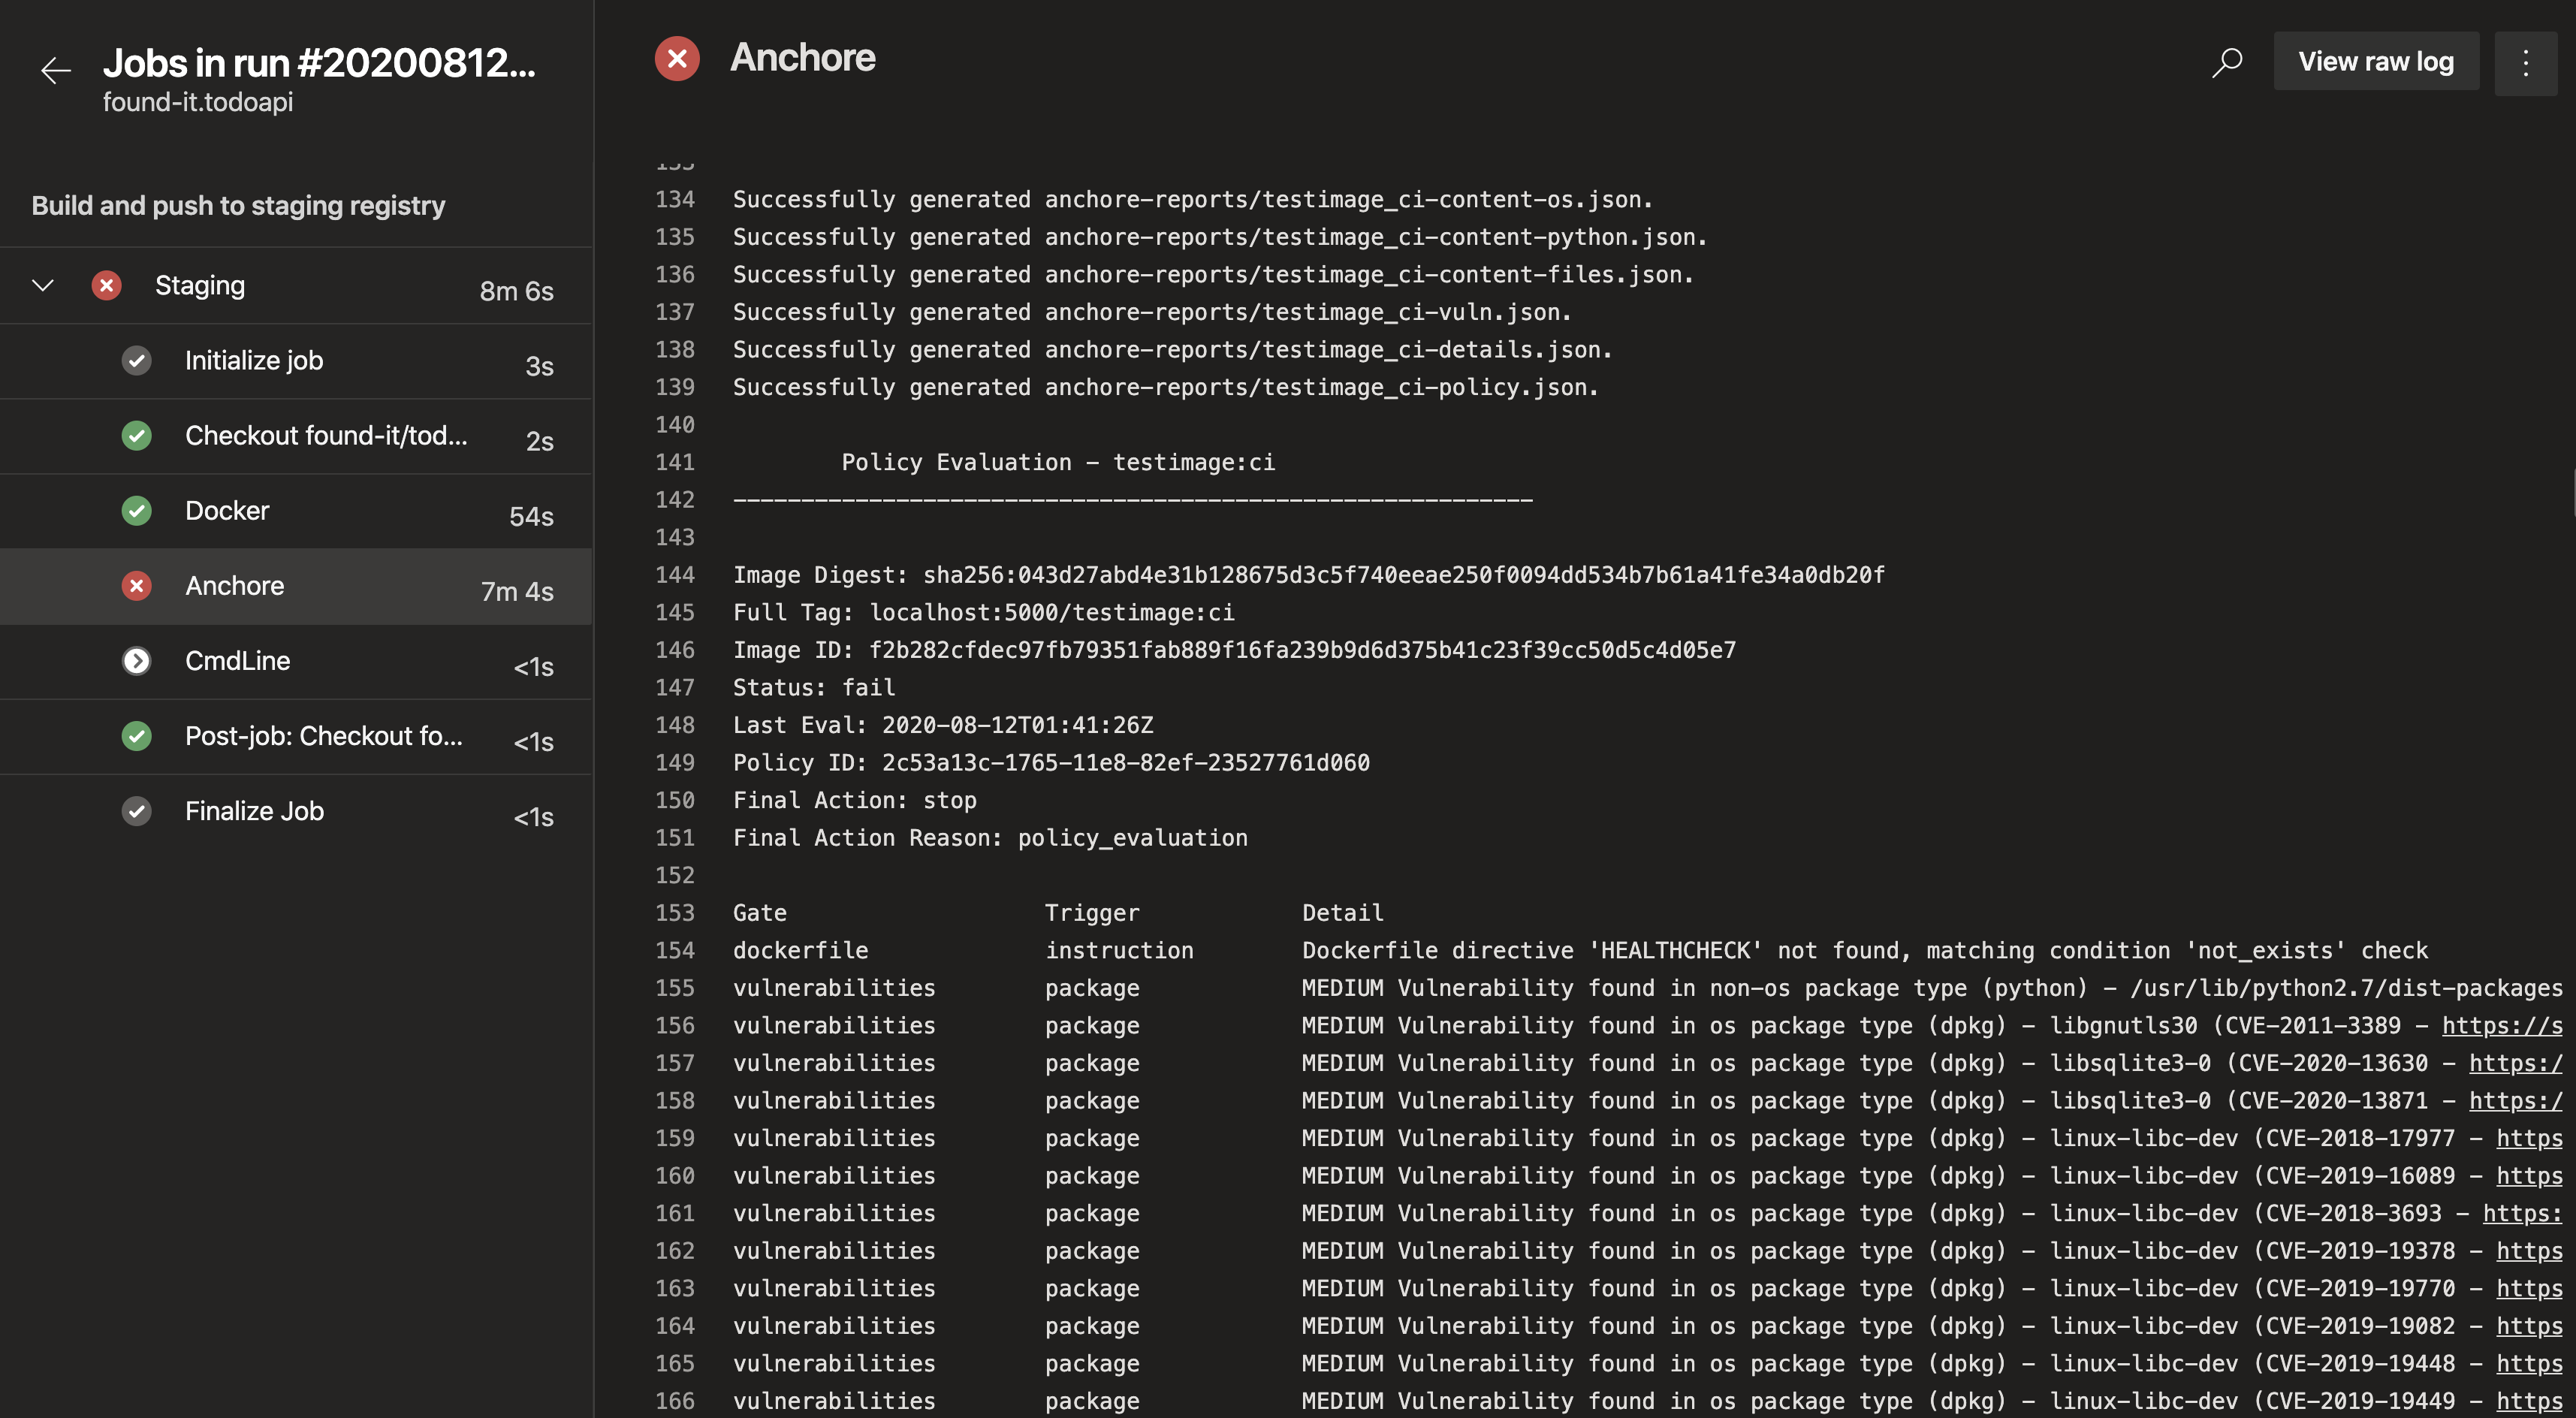
Build Output

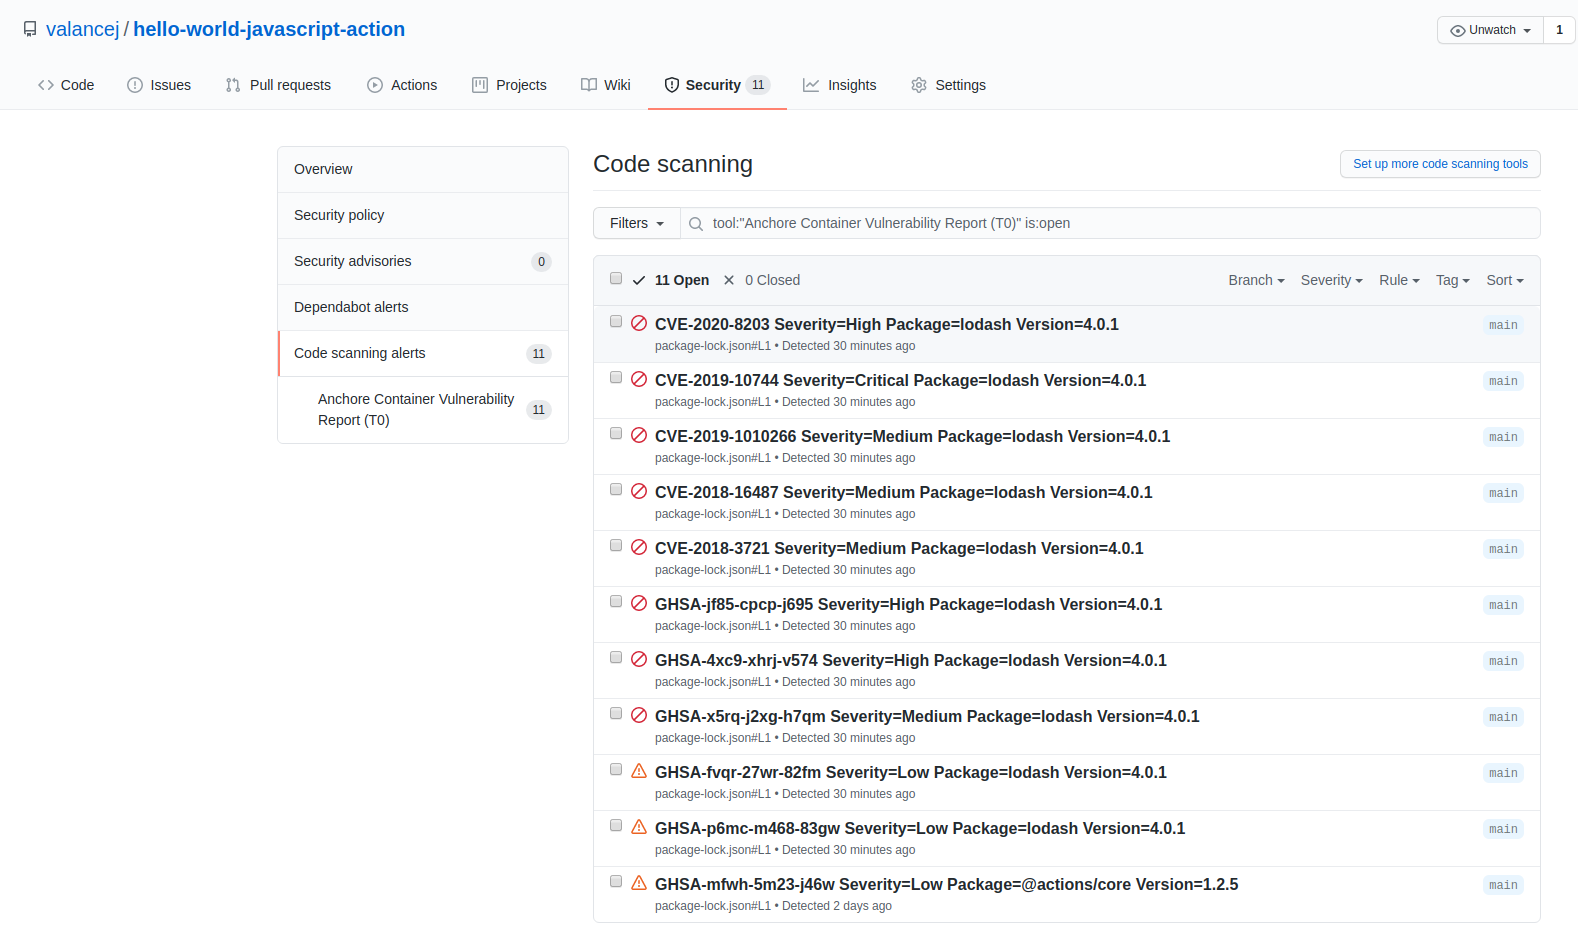
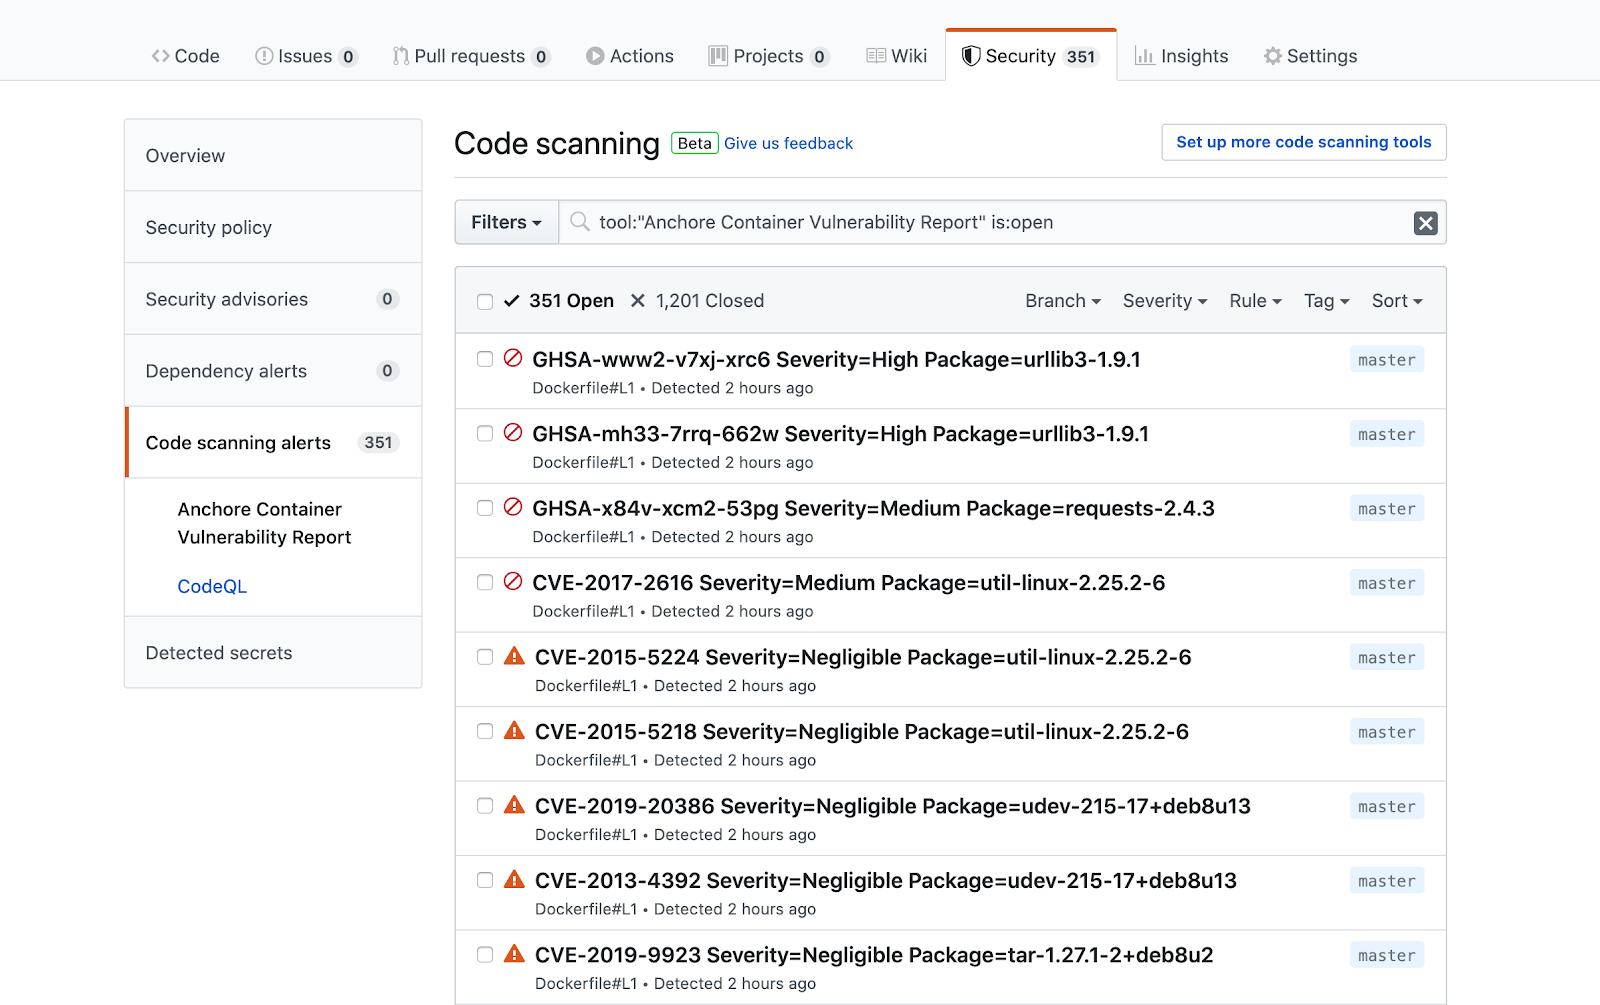
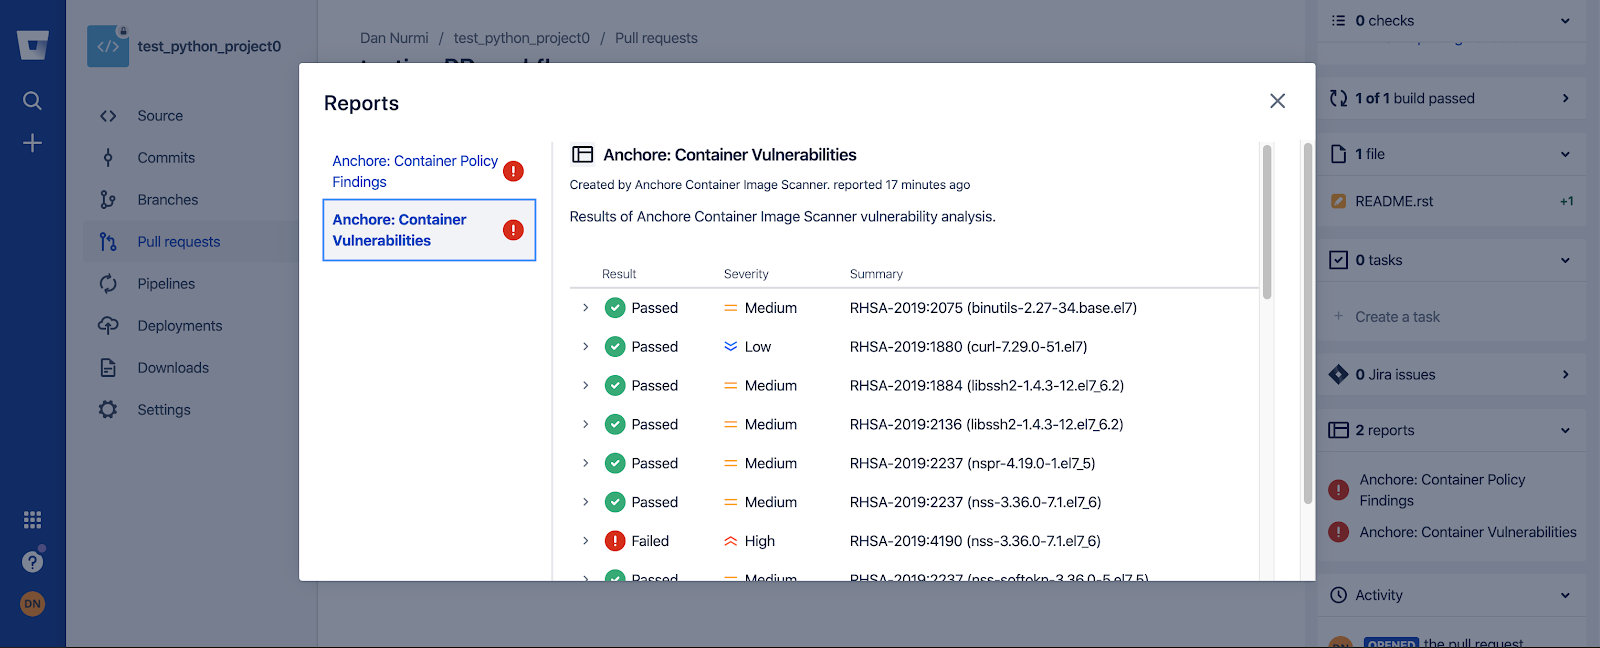
The build output above shows a build failure due to vulnerabilities identified in the project of severity level medium or higher. To find out more information about these specific issues, I can jump over to the Security tab.

All CVEs open

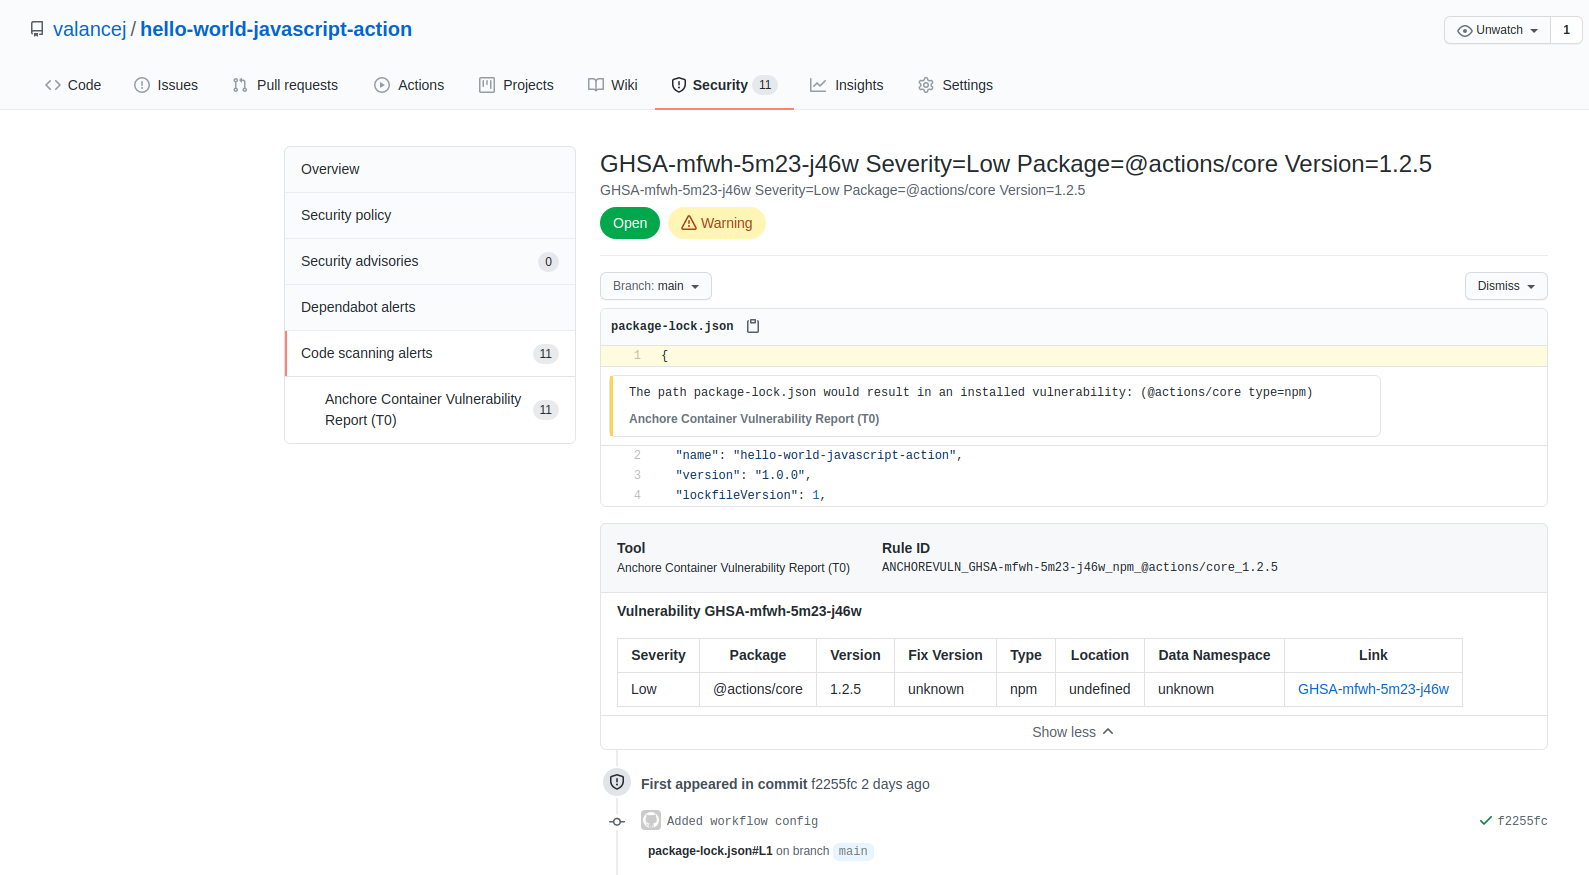
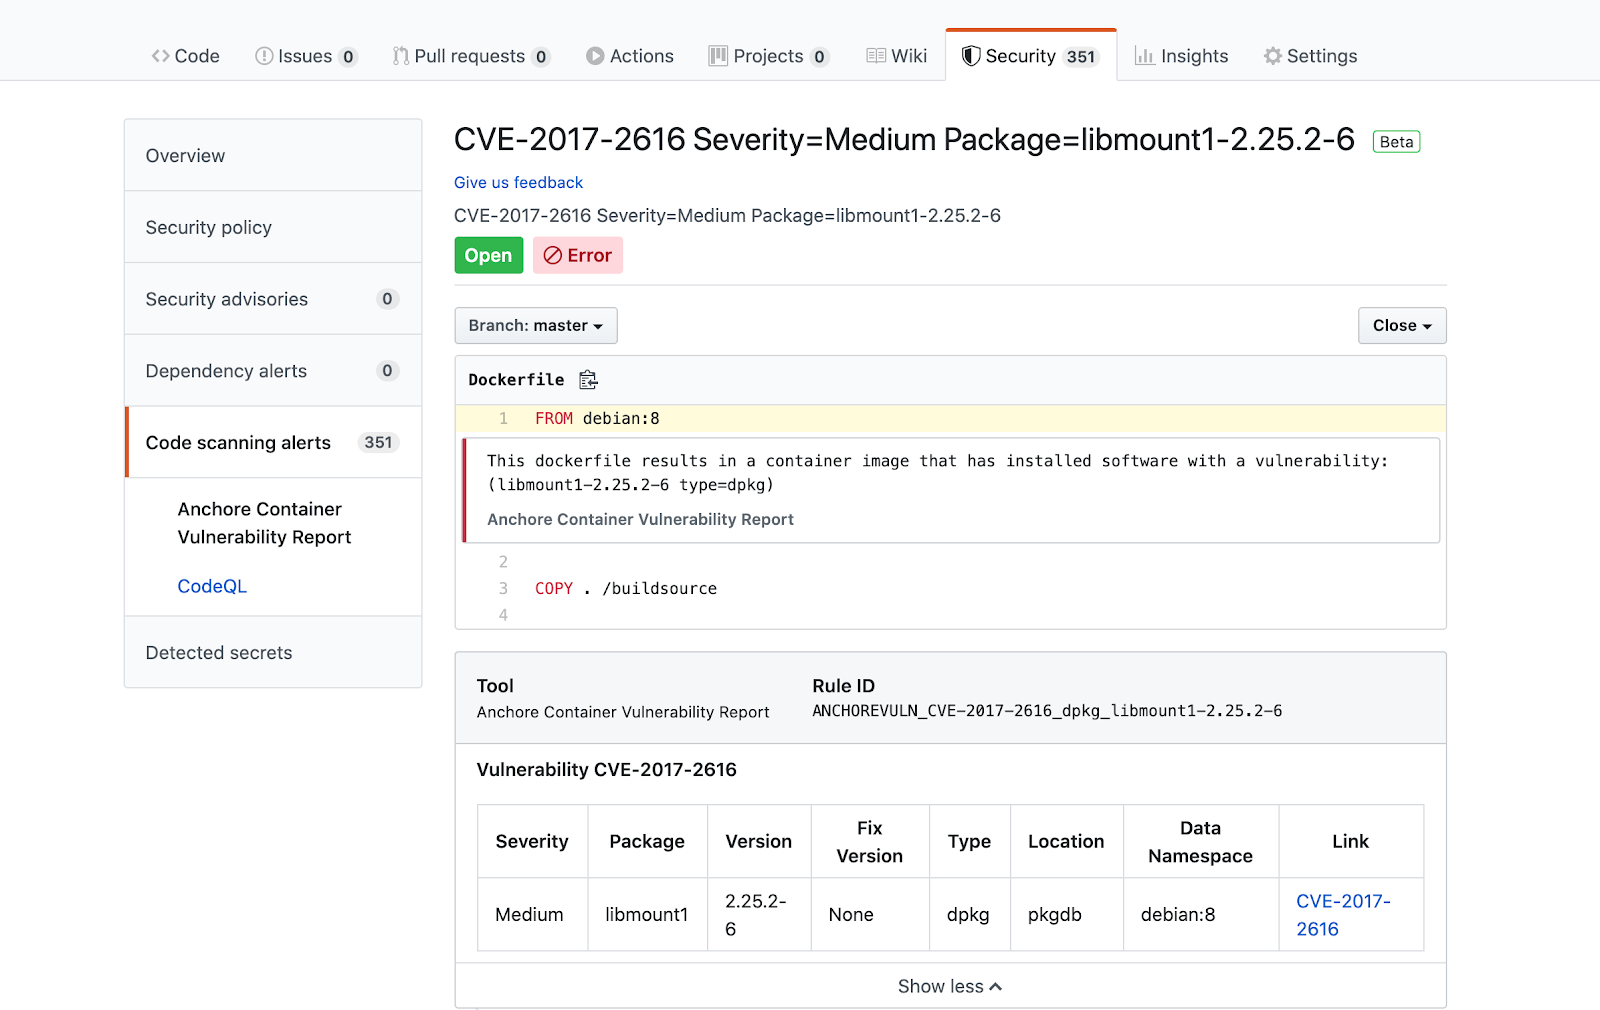
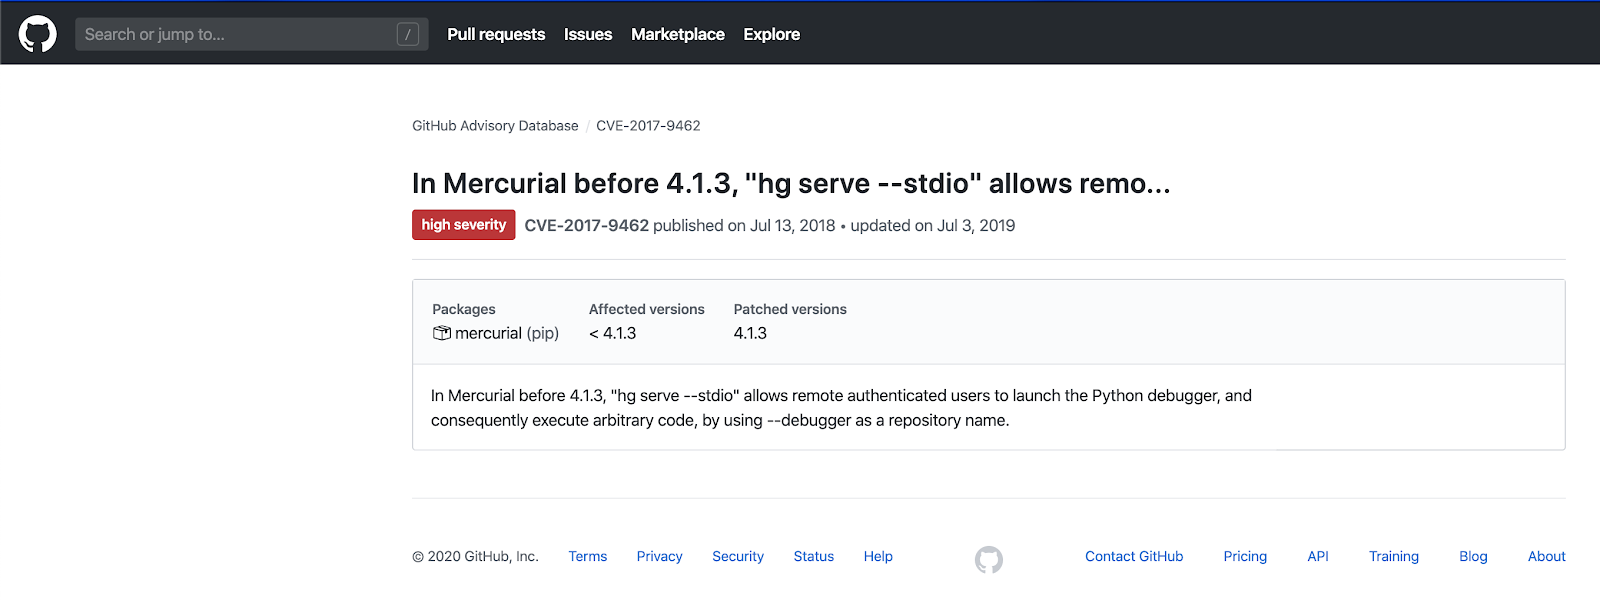
Once here, we can click on the vulnerability linked to the disclosure discussed above. 

Open CVE

We can see the GHSA, and make the necessary updates to the @actions/core dependency we are using. While this is just a basic example, it paints a clear picture that adding security scans to CI workflows doesn’t have to be complicated. With the proper tools, it becomes quite simple to obtain actionable information about the software you’re building. 

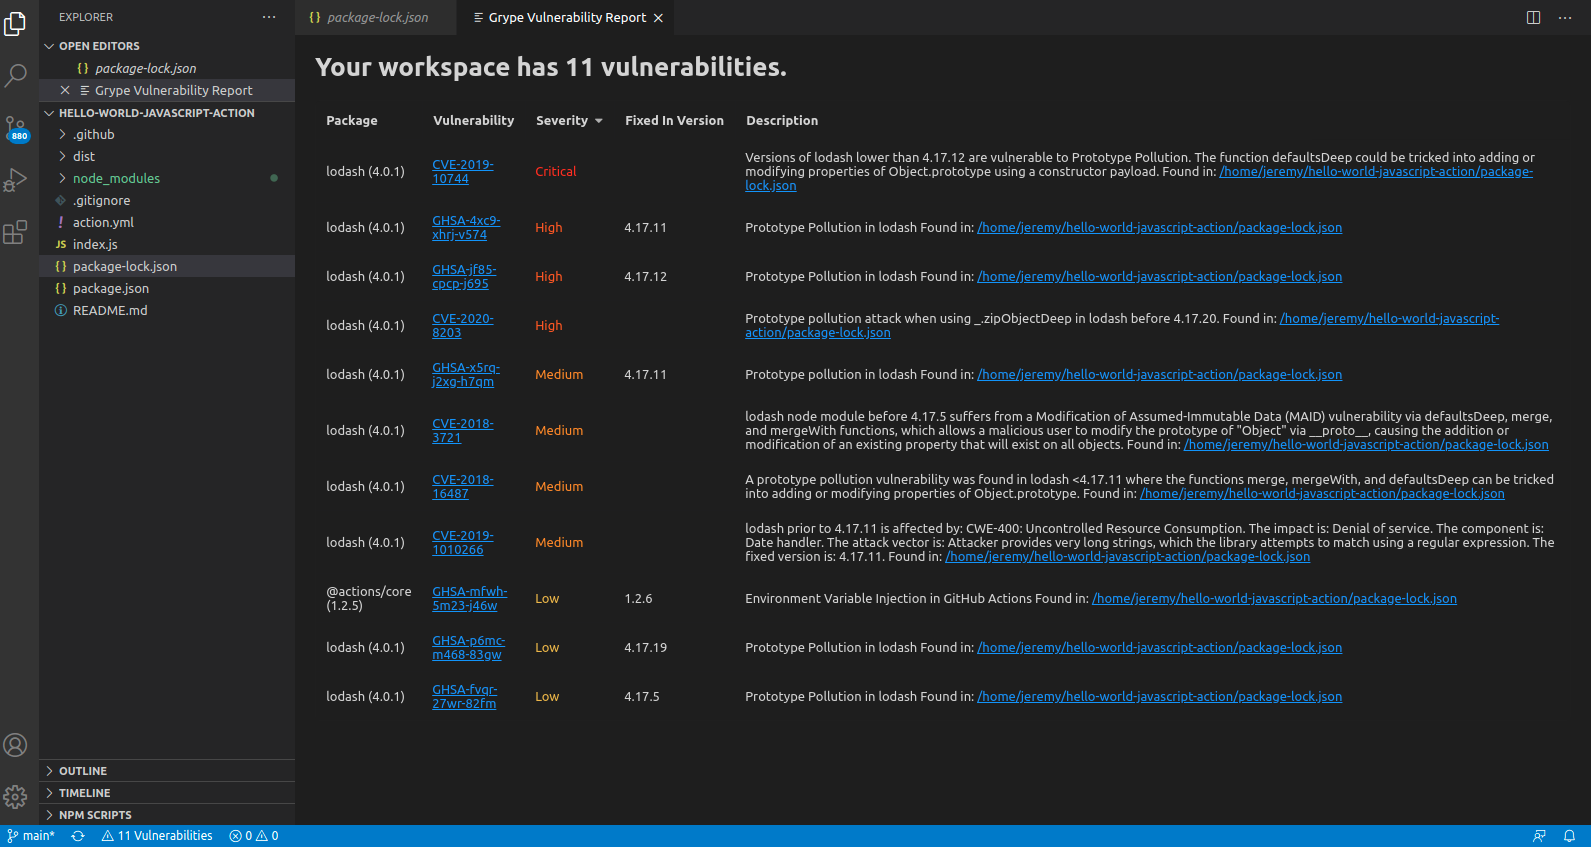
If we wanted to take this a step further “left” in the software development lifecycle (SDLC), I could install Grype for Visual Studio Code, an extension for discovering project vulnerabilities while working locally in VS Code. 

Grype vscode

Here we can see for the same hello-world GitHub Action, I can get visibility into vulnerabilities as I’m working locally on my workstation and can resolve these issues before I end up pushing to my source code repository. I’ve also just added two places for security checks in the development lifecycle in just a few minutes, which means I am spreading out my checks, providing more places to catch myself should I create issues. 

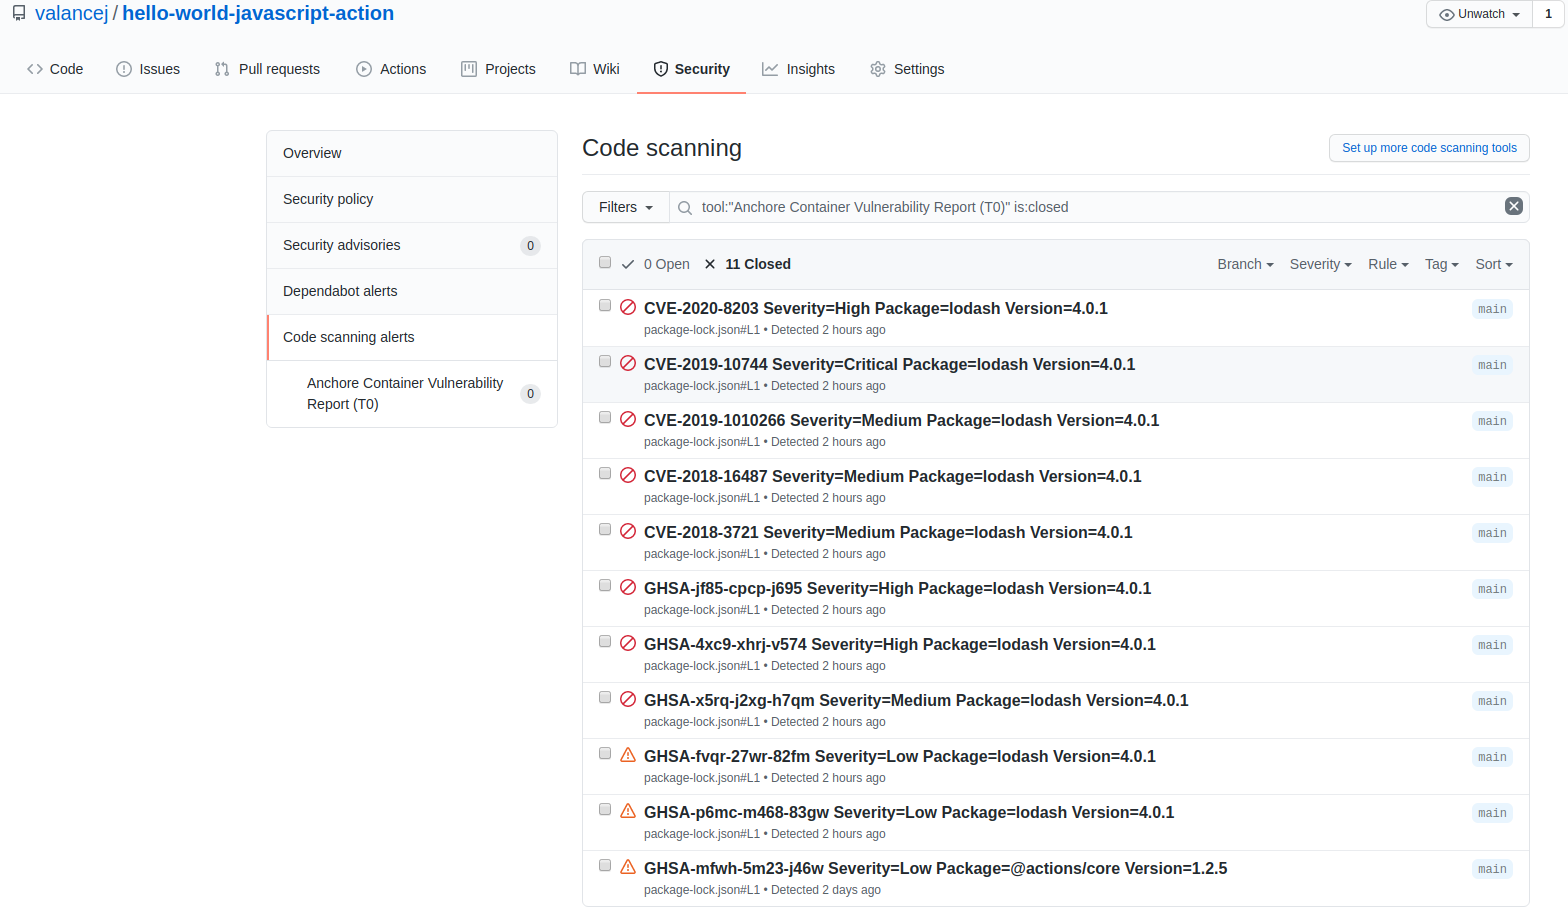
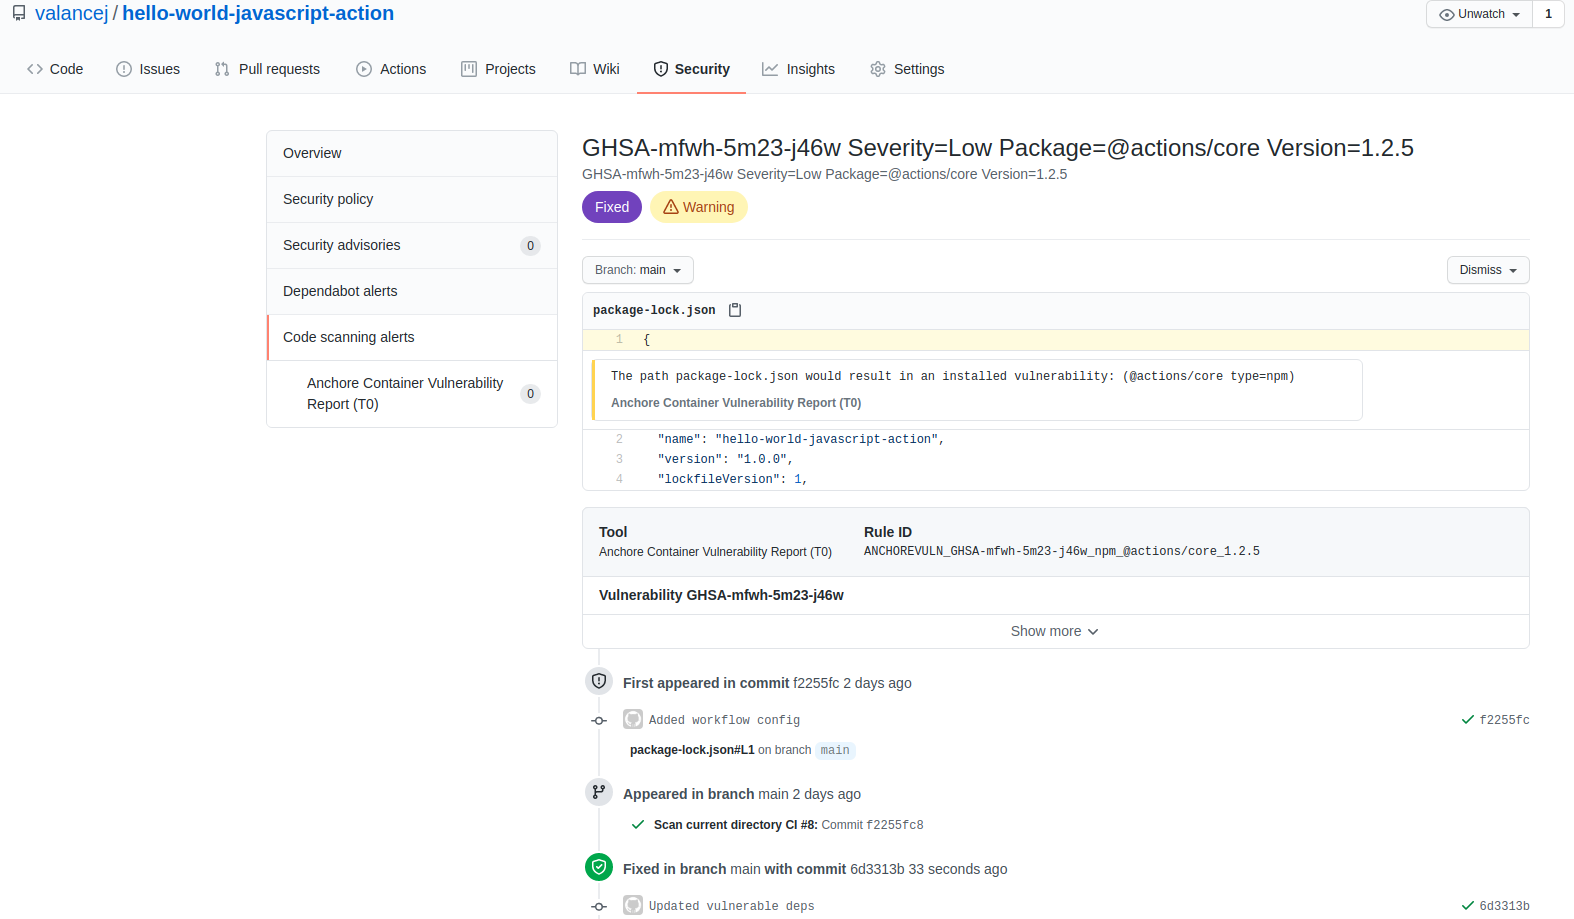
Just for good measure, once I update my dependencies and push to GitHub, my CI job is now successfully passing the Anchore scan, and the security issues that were opened have now been closed and resolved. 

All CVEs closed

CVE closed

While this was just a simple demonstration of what is possible, at Anchore, we generally just think of these types of checks as good hygiene, and the more spots in the development workflow we can provide developers with security information about the code they’re writing, the better positioned they’ll be to promote shared security principles across their organization and build high-quality, secure software.

Free Download: Inside the Anchore Technology Suite: Open Source to Enterprise

Open source is foundational to much of what we do here at Anchore. It’s at the core of Anchore Enterprise, our complete container security workflow solution for enterprise DevSecOps. Anchore Toolbox is our collection of lightweight, single-purpose open source tools for the analysis and scanning of software projects.

Each tool has its place in the DevSecOps journey, depending on your organization’s requirements and eventual goals.

Our free guide explains the following:

  • The role of containers in DevSecOps transformation
  • Features of Anchore Enterprise and Anchore Toolbox
  • Ideal use cases for Anchore Enterprise
  • Ideal use cases for Anchore Toolbox
  • Choosing the right Anchore tool for your requirements

To learn more about how Anchore Toolbox and Anchore Enterprise can fit into your DevSecOps journey, please download our free guide.

Configuring Anchore Enterprise on AWS Elastic Kubernetes Services (EKS)

In previous posts, we’ve demonstrated how to create a Kubernetes cluster on AWS Elastic Kubernetes Service (EKS) and how to deploy Anchore Enterprise in your EKS cluster. The focus of this post is to demonstrate how to configure a more production-like deployment of Anchore with integrations such as SSL support, RDS database backend and S3 archival.

Prerequisites:

Configuring the Ingress/Application Load Balancer

Anchore’s Helm Chart provides a deployment template for configuring an ingress resource for your Kubernetes deployment. EKS supports the use of an AWS Elastic Load Balancing Application Load Balancer (ALB) ingress controller, an NGINX ingress controller or a combination of both.

For the purposes of this demonstration, we will focus on deploying the ALB ingress controller using the Helm chart.

To enable ingress deployment in your EKS cluster, simply add the following ingress configuration to your anchore_values.yaml:

Note: If you haven’t already, make sure to create the necessary RBAC roles, role bindings and service deployment required by the AWS ALB Ingress controller. See ALB Ingress Controller for more details.

ingress:
  enabled: true
  labels: {}
  apiPath: /v1/*
  uiPath: /*


  annotations:
    kubernetes.io/ingress.class: alb
    alb.ingress.kubernetes.io/scheme: internet-facing

Specify Custom Security Groups/Subnets

By default, the ingress controller will deploy a public-facing application load balancer and create a new security group allowing access to your deployment from anywhere over the internet. To prevent this, we can update the ingress annotations to include additional information such as a custom security group resource. This will enable you to use an existing security group within the cluster VPC with your defined set of rules to access the attached resources.

To specify a security group, simply add the following to your ingress annotations and update the value with your custom security group id:

alb.ingress.kubernetes.io/security-groups: "sg-012345abcdef"

We can also specify the subnets we want the load balancer to be associated with upon deployment. This may be useful if we want to attach our load balancer to the cluster’s public subnets and have it route traffic to nodes attached to the cluster’s private subnets.

To manually specify which subnets the load balancer should be associated with upon deployment, update your annotations with the following value:

alb.ingress.kubernetes.io/subnets: "subnet-1234567890abcde, subnet-0987654321edcba"

To test the configuration, apply the Helm chart:

helm install <deployment_name> anchore/anchore-engine -f anchore_values.yaml

Next, describe your ingress controller configuration by running kubectl describe ingress

You should see the DNS name of your load balancer next to the address field and under the ingress rules, a list of annotations including the specified security groups and subnets.

Note: If the load balancer did not deploy successfully, review the following AWS documentation to ensure the ingress controller is properly configured.

Configure SSL/TLS for the Ingress

You can also configure an HTTPS listener for your ingress to secure connections to your deployment.

First, create an SSL certificate using AWS Certificate Manager and specify a domain name to associate with your certificate. Note the ARN of your new certificate and save it for the next step.

Next, update the ingress annotations in your anchore_values.yaml with the following parameter and provide the certificate ARN as the value.

alb.ingress.kubernetes.io/certificate-arn: "arn:aws:acm::"

Additionally, we can configure the Enterprise UI to listen on HTTPS or a different port by including the following annotations to the ingress with the desired port configuration. See the following example:

alb.ingress.kubernetes.io/listen-ports: '[{"HTTPS": 443}, {"HTTP": 80}]'
alb.ingress.kubernetes.io/actions.ssl-redirect: '{"Type": "redirect", "RedirectConfig": { "Protocol": "HTTPS", "Port": "443", "StatusCode": "HTTP_301"}}'

Next, install the deployment if this is a new deployment:

helm install anchore/anchore-engine -f anchore_values.yaml

Or upgrade your existing deployment

helm upgrade anchore/anchore-engine -f anchore_values.yaml

To confirm the updates were applied, run kubectl describe ingress and verify your certificate ARN, as well as the updated port configurations, appear in your annotations.

Analyze Archive Storage Using AWS S3

AWS’s S3 Object Storage allows users to store and retrieve data from anywhere in the world. It can be particularly useful as an archive system. For more information on S3, please see the documentation from Amazon.

Both Anchore Engine and Anchore Enterprise can be configured to use S3 as an archiving solution. Some form of archiving is highly recommended for a production-ready environment. In order to set this up on your EKS, you must first ensure that your use case is in line with Anchore’s archiving rules. Anchore stores image analysis results in two locations. The first is the working set which is where an image is stored initially after its analysis is completed. In the working state, images are available for queries and policy evaluation. The second location is the archive set. Analysis data stored in this location is not actively ready for policy evaluation or queries but is less resource-intensive and information here can always be loaded into the working set for evaluation and queries. More information about Anchore and archiving can be found here.

To enable S3 archival, copy the following to the catalog section of your anchore_values.yaml:

anchoreCatalog:
  replicaCount: 1

  archive:
    compression:
      enabled: true
      min_size_kbytes: 100
    storage_driver:
      name: s3
      config:
        bucket: ""

        # A prefix for keys in the bucket if desired (optional)
        prefix: ""
        # Create the bucket if it doesn't already exist
        create_bucket: false
        # AWS region to connect to if 'url' not specified, if both are set, then 'url' has precedent
        region: us-west-2

By default, Anchore will attempt to access an existing bucket specified under the config > bucket value. If you do not have an S3 bucket created, then you can set create_bucket to false and allow the Helm chart to create the bucket for you. If you already created one, put its name in the bucket parameter. Since S3 isn’t region-specific, you need to specify the region that your EKS cluster resides in with the region parameter.

Note: Whether you specify an existing bucket resource or set create_bucket to true, the cluster nodes require permissions to perform the necessary API calls to the S3 service. There are two ways to configure authentication:

Specify AWS Access and Secret Keys

To specify the access and secret keys tied to a role with permissions to your bucket resource, update the storage driver configuration in your anchore_values.yaml with the following parameters and appropriate values:

# For Auth can provide access/secret keys or use 'iamauto' which will use an instance profile or any credentials found in normal aws search paths/metadata service
        access_key: XXXX
        secret_key: YYYY

Use Permissions Attached to the Node Instance Profile

The second method for configuring access to the bucket is to leverage the instance profile of your cluster nodes. This eliminates the need to create an IAM role to access the bucket and manage the access and secret keys for the role separately. To configure the catalog service to leverage the IAM role attached to the underlying instance, update the storage driver configuration in your anchore_values.yaml with the following and ensure iamauto is set true:

# For Auth can provide access/secret keys or use 'iamauto' which will use an instance profile or any credentials found in normal aws search paths/metadata service
        iamauto: true

You must also ensure that the role associated with your cluster nodes has GetObject, PutObject and DeleteObject permissions to your S3 bucket (see a sample policy below).

{
  "Version": "2012-10-17",
  "Statement": [
    {
      "Effect": "Allow",
      "Action": ["s3:ListBucket"],      "Resource": ["arn:aws:s3:::test"]
    },
    {
      "Effect": "Allow",
      "Action": [
        "s3:PutObject",
        "s3:GetObject",
        "s3:DeleteObject"
      ],
      "Resource": ["arn:aws:s3:::test/*"]
    }
  ]
}

Once all of these steps are completed, deploy the Helm chart by running:

helm install stable/anchore-engine -f anchore_values.yaml

Or the following, if upgrading an existing deployment:

helm upgrade stable/anchore-engine -f anchore_values.yaml

Note: If your cluster nodes reside in private subnets, they must have outbound connectivity in order to access your S3 bucket.

For cluster deployments where nodes are hosted in private subnets, a NAT gateway can be used to route traffic from your cluster nodes outbound through the public subnets. More information about creating and configuring NAT gateways can be found here.

Another option is to configure a VPC gateway allowing your nodes to access the S3 service without having to route traffic over the internet. More information regarding VPC endpoints and VPC gateways can be found here.

Using Amazon RDS as an External Database

By default, Anchore will deploy a database service within the cluster for persistent storage using a standard PostgreSQL Helm chart. For production deployments, it is recommended to use an external database service that provides more resiliency and supports features such as automated backups. For EKS deployments, we can offload Anchore’s database tier to PostgreSQL on Amazon RDS.

Note: Your RDS instance must be accessible to the nodes in your cluster in order for Anchore to access the database. To enable connectivity, the RDS instance should be deployed in the same VPC/subnets as your cluster and at least one of the security groups attached to your cluster nodes must allow connections to the database instance. For more information, read about configuring access to a database instance in a VPC.

To configure the use of an external database, update your anchore_values.yaml with the following section and ensure enabled is set to “false”.

postgresql:
  enabled: false

Under the postgres section, add the following parameters and update them with the appropriate values from your RDS instance.

 postgresUser: 
  postgresPassword: 
  postgresDatabase: 
  externalEndpoint:

With the section configured, your database values should now look something like this:

postgresql:
  enabled: false
  postgresUser: anchoreengine
  postgresPassword: anchore-postgres,123
  postgresDatabase: postgres
  externalEndpoint: abcdef12345.jihgfedcba.us-east-1.rds.amazonaws.com

To bring up your deployment run:

helm install  stable/anchore-engine -f anchore_values.yaml

Finally, run kubectl get pods to confirm the services are healthy and the local postgresql pod isn’t deployed in your cluster.

Note: The above steps can also be applied to deploy the feeds postgresql database on Amazon RDS by updating the anchore-feeds-db section instead of the postgresql section of the chart.

Encrypting Database Connections Using SSL Certificates with Amazon RDS

Encrypting RDS connections is a best practice to ensure the security and integrity of your Anchore deployment that uses external database connections.

Enabling SSL on RDS

AWS provides the necessary certificates to enable SSL with your rds deployment. Download rds-ca-2019-root.pem from here. In order to require SSL connections on an RDS PostgreSQL instance, the rds.force_ssl parameter needs to be set to 1 (on). By setting this to 1, the PostgreSQL instance will set the SSL parameter to 1 (on) as well as modify the database’s pg_hba.conf file to support SSL. See more information about RDS PostgreSQL ssl configuration.

Configuring Anchore to take advantage of SSL is done through the Helm chart. Under the anchoreGlobal section in the chart, enter the certificate filename next to certStoreSecretName that we downloaded from AWS in the previous section. (see example below)

anchoreGlobal:
   certStoreSecretName: rds-ca-2019-root.pem

Under the dbConfig section, set SSL to true. Set sslRootCertName to the same value as certStoreSecretName. Make sure to update the postgresql and anchore-feeds-db sections to disable the local container deployment of the services and specify the RDS database values (see the previous section on configuring RDS to work with Anchore for further details). (If running Enterprise, the dbConfig section under anchoreEnterpriseFeeds should also be updated to include the cert name under sslRootCertName)

dbConfig:
    timeout: 120
    ssl: true
    sslMode: verify-full
    sslRootCertName: rds-ca-2019-root.pem
    connectionPoolSize: 30
    connectionPoolMaxOverflow: 100

Once these settings have been configured, run a Helm upgrade to apply the changes to your cluster.

Conclusion

The Anchore Helm chart provided on GitHub allows users to quickly get a deployment running on their cluster, but it is not necessarily a production-ready environment. The sections above showed how to configure the ingress/application load balancer, configuring HTTPS, archiving image analysis data to an AWS S3 bucket, and setting up an external RDS instance and requiring SSL connections to it. All of these steps will ensure that your Anchore deployment is production-ready and prepared for anything you throw at it.


Enforcing the DoD Container Image and Deployment Guide with Anchore Federal

The latest version of the DoD Container Image and Deployment Guide details technical and security requirements for container image creation and deployment within a DoD production environment. Sections 2 and 3 of the guide include security practices that teams must follow to limit the footprint of security flaws during the container image build process. These sections also discuss best security practices and correlate them to the corresponding security control family with Risk Management Framework (RMF) commonly used by cybersecurity teams across DoD.

Anchore Federal is a container scanning solution used to validate the DoD compliance and security standards, such as continuous authorization to operate (cATO), across images, as explained in the DoD Container Hardening Process Guide. Anchore’s policy first approach places policy where it belongs– at the forefront of the development lifecycle to assess compliance and security issues in a shift left approach. Scanning policies within Anchore are fully customizable based on specific mission needs, providing more in-depth insight into compliance irregularities that may exist within a container image. This level of granularity is achieved through specific security gates and triggers that generate automated alerts. This allows teams to validate that the best practices discussed in Section 2 of the Container Image Deployment Guide enable best practices to be enforced as your developers build.  

Anchore Federal uses a specific DoD Scanning Policy that enforces a wide array of gates and triggers that provide insight into the DoD Container Image and Deployment Guide’s security practices. For example, you can configure the Dockerfile gate and its corresponding triggers to monitor for security issues such as privileged access. You can also configure the Dockerfile gate to expose unauthorized ports and validate images built from approved base images and check for the unauthorized disclosure of secrets/sensitive files, amongst others.

Anchor Federal’s DoD scanning policy is already enabled to validate the detailed list of best practices in Section 2 of the Container Image and Deployment Guide. 

Looking to learn more about how to achieve container hardening at DoD levels of security? One of the most popular technology shortcuts is to utilize a DoD software factory. Anchore has been helping organizations and agencies put the Sec in DevSecOps by securing traditional software factories, transforming them into DoD software factories.

Next Steps

Anchore Federal is a battle-tested solution that has been deployed to secure DoD’s most critical workloads. Anchore Federal exists to provide cleared professional services and software to DoD mission partners and the US Intelligence Community in building their DevSecOps environments. Learn more about how Anchore Federal supports DoD missions.

Anchore Federal Now Part of the DoD Container Hardening Process

The latest version of the Department of Defense (DoD) Container Hardening Process Guide includes Anchore Federal as an approved container scanning tool. This hardening process is critical because it allows for a measurement of risk that an Authorizing Official (AO) assesses while rendering their decision to authorize the container. DoD programs can use this guide as a source of truth to know they are following DISA container security best practices.

Currently, the DoD is in the early stages of container adoption and security. As containers become more integral for secure software applications, the focus shifts to making sure, DoD systems are being built using DoD compliant container images and mitigating risks associated with using container images. For example, the United States Air Force Platform One initiative includes Iron Bank, a repository of DoD compliant container images available for reuse across authorized DoD program offices and weapon systems.

Here are some more details about how Anchore factors into the DoD Container Hardening Process:

Container Scanning Guidelines

The DISA container hardening SRG relies heavily on best practices already utilized at Platform One. Anchore Federal services work alongside the US Air Force at Platform One to build, harden, and scan container images from vendors in Repo1 as the Platform One team adds secure images to Iron Bank. Automation of container scanning of each build within a DevSecOps pipeline is the primary benefit of the advised approach discussed in Section 2.3 of the SRG. Anchore encourages our customers to read the Scanning Process section of the DoD Container Hardening Process Guide to learn more about the container scanning process.

Serving as a mandatory check as part of a container scanning process is an ideal use case for Anchore Federal in the DoD and public sector agencies. Our application programming interface (API) makes it very easy to integrate with DevSecOps environments and validate your builds for security and DoD compliance by automating Anchore scanning inside your pipeline.

Anchore scanning against the DoD compliance standards involves assessing the image by checking for Common Vulnerabilities and Exposures (CVEs), embedded malware, and other security requirements found in Appendix B: DoD hardened Containers Cybersecurity Requirements. 

An Anchore scan report containing the output is fed back to the developer and forwarded to the project’s security stakeholders to enable a Continuous Authority to Operate (c-ATO) workflow, which satisfies the requirements for the Findings Mitigation Reporting step of the process recommended by the Container Hardening Guide. The report output also serves as a source of truth for approvers accepting the risks associated with each image.

Scanning Reports & Image Approval 

After personnel review the Anchore compliance reports and complete the mitigation reporting, they report these findings to the DevSecOps approver, who determines if the results warrant approving the container based on the level of risk presented within each image.  Upon approval, the images move to the approved registry in Iron Bank accessible to developers across DoD programs.

Next Step

Anchore Federal is a battle-tested solution that has been deployed to secure DoD’s most critical workloads. Anchore Federal exists to provide cleared professional services and software to DoD mission partners and the US Intelligence Community in building their DevSecOps environments. Learn more about how Anchore Federal supports DoD missions.

AI and the Future of DevSecOps

Many companies have been investing heavily in Artificial Intelligence (AI) over the past few years. It has enabled cars to drive themselves, doctors to pick up on various diseases earlier, and even create works of art. Such a powerful technology can impact nearly every aspect of human life. We want to explore what that looks like in the realm of application security and DevSecOps.

Addressing DevSecOps Challenges With AI

The importance of maintaining compliance within any organization is crucial. Health care providers have to remain within the Health Insurance Portability and Accountability Act (HIPAA) requirements. Financial companies have similar requirements. Other companies have other requirements regarding protecting user data. Many times these regulations change. For example, HIPAA has had hundreds of minor updates and six major updates since its creation in 1996. Many times these requirements come in faster than humans can keep up with. AI can make sure that these requirements aren’t missed and implemented properly in any delivered code.

Additionally, AI is taking the feasibility of application security from many companies from a “sometimes” thing to an “always” thing. It speeds up that testing process from a laborious manual process to something that can be run in a pipeline.

AI functions like a human brain. With neural networks and backpropagation, It mimics how the brain changes to adapt to new situations. In this way, it can be leveraged to adjust to changes in code and infrastructure automatically.


The Future of “DevSecAIOps”

Another critical aspect of DevSecOps that is sometimes difficult to maintain is the speed of code delivery. Securing pipelines will always add more time due to added complexity and the need for human interaction within that pipeline. An example of this is a developer needed to change code to remove specific vulnerabilities found during a security scan. This is an aspect of DevSecOps that can benefit from the introduction of Artificial Intelligence. AI can change its own code through neural networks and backpropagation, so, logically, it could be used to make these changes to vulnerable code to get that code through the pipeline rapidly. 

Additionally, AI can bring the expertise of the few cybersecurity experts to many companies and organizations. Though artificial intelligence has the ability to accomplish tasks that humans usually do, it is a data and labor-intensive process to train the models to function to the standard that humans do. But once they are functioning to that level, they can be utilized by many people and, in the case of DevSecOps, can be used to assist companies who cannot have DevSecOps engineers working on their pipelines.

Conclusion

The usefulness of artificial intelligence far outweighs the buzz of it in society. It has allowed many companies to iterate their technologies at speeds that simply weren’t possible before. With these rapid advancements, however, the importance of maintaining that same cadence in the realms of application security and DevSecOps cannot be overstated. By taking advantage of AI like other technologies are, DevSecOps can make sure that these rapidly developed technologies are powered by secure and stable code when they reach the user.

Understanding your Software Supply Chain Risk

Many organizations have seen increased value from in house software development by adopting open source technology and containers to quickly build and package software for the cloud. Usually branded as Digital Transformation, this shift comes with trade-offs not often highlighted by vendors and boutique consulting firms selling the solutions. The reality is moving fast, can break things and without proper constraints, you can expose your organization to significant security, legal and reputational risks.

These are not entirely new revelations. Security experts have long known that supply chains are an incredibly valuable attack surface to hackers. Software supply chain attacks have been used to exfiltrate credit card data, (alleged) nation-state surveillance, and to cash out ATMs. The widespread adoption of open source projects and the use of containers and registries have given hackers new opportunities for harm.

Supply Chain Exposure Goes Beyond Security

These risks are not limited to criminal hacking and fragility in your supply chain comes in many forms. One type of risk comes from single contributors that could object morally to the use of their software, like what happened when one developer decided he didn’t like Trump’s support of ICE and pulled his package from NPM. Or unbeknownst to your legal team, you could be distributing software without proper license, as is the case with any container that uses Alpine Linux as the base image.

Fortunately, understanding these risks is not unknowable. A number of open source tools exist for scanning for CVEs, and recent projects are helping to standardize Software Bill of Materials to help make it easy to check your containers for license and security risks. Knowing is of course only half the battle – securing your supply chain is the end goal. This is where the unique capabilities of Anchore Enterprise can be applied. Creating, managing, and enforcing policy allows you to enforce the constraints that are most applicable to your organization, and allow teams to still move quickly by building on top of open source and container tooling.

Smart Contracts for your Supply Chain

Most sizable organizations have already established best practices around their software supply chain. Network security, tool mandates, and release practices all help to decrease your organization’s risk – but they all are fallible. Where humans are involved, they are sure to choose convenience over security, especially when urgency is involved.

This is the idea behind the Open Policy Agent (OPA) Kubernetes project which can prevent certain containers images from being scheduled, and even integrate with service mesh to route network traffic away from suspicious containers.

At Anchore, we believe that catching security issues at runtime is costly and focus on controlling your path to production through an independent policy engine. By defining policy, and leveraging our toolbox in your pipelines you can enforce the appropriate policy for your organization, team, and environment.

This powerful capability gives you the ability to allow development teams to use tools that are convenient to them during the creative process but enforce a more strict packaging process. For example, you might want to ensure that all production containers are pulled from a privately managed registry. This gives you greater control and less exposure, but how can you enforce this? Below is an example policy rule you can apply using Anchore Enterprise to prevent container images from being pulled from Docker Hub.

"denylisted_images": [

   {
     "id": "9b6e8f3b-3f59-44cb-83c7-378b9ba750f7",
     "image": {
       "type": "tag",
       "value": "*"
     },

     "name": "Deny use of Dockerhub Images",
     "registry": "dockerhub.io",
     "repository": "*"
   }
 ],

By adding this to a policy you can warn teams they are pulling a publicly accessible image, and allow your central IT team to be aware of the violation. This simple contract severs a building block to developing “compliance-as-code” within your Organization. This is just one example of course, you could also search for secrets, personally identifiable information (PII data), or any variety of combinations.

Supply Chain Driven Design

For CIOs and CSOs, focusing on the role of compliance when designing your software supply chain is crucial for not only managing risk, but also to improve the efficiency and productivity of your organization. Technology leaders that do this quickly will maintain distinct agility when a crisis hits, and stand out from their peers in the industry by innovating faster and more consistently. Anchore Enterprise gives you the building blocks to design your supply chain based on the trade-offs that make the most sense for your organization.

More Links & References

How one programmer broke the internet

NPM Typo Squatting attack

How a supply chain attack lead to millions of stolen credit cards

Kubecon Supply Chain Talk

DevSecOps and the Next Generation of Digital Transformation

COVID-19 is accelerating the digital transformation of commercial and public sector enterprises around the world. However, digital transformation brings along new digital assets (such as applications, websites, and databases), increasing an enterprise’s attack surface. To prevent costly breaches, protect reputation, and maintain customer relationships, enterprises undergoing digital transformation have begun implementing a built-in and bottom-up security approach: DevSecOps.

Ways Enterprises Can Start Implementing DevSecOps

DevSecOps requires sharing the responsibility of security across development and operations teams. It involves empowering development, DevOps, and IT personnel with security information and tools to identify and eliminate threats as early as possible. Here are a few ways enterprises that are undergoing digital transformation can start implementing DevSecOps:

    • Analyze Front End Code. Cybercriminals love to target front end code due to its high number of reported vulnerabilities and security issues. Use CI/CD pipelines to detect security flaws early and share that information with developers so they can fix the issue. It’s also a good idea to make sure that attackers haven’t injected any malicious code – containers can be a great way to ensure immutability.
    • Sanitize Sensitive Data. Today, several open source tools can detect personally identifiable information (PII), secrets, access keys, etc. Running a simple check for sensitive data can be exponentially beneficial – a leaked credential in a GitHub repository could mean game over for your data and infrastructure.
    • Utilize IDE Extensions. Developers use integrated development environments and text editors to create and modify code. Why not take advantage of open source extensions that can scan local directories and containers for vulnerabilities? You can’t detect security issues much earlier in the SDLC than that!
    • Integrate Security into CI/CD. There are many open source Continuous Integration/Continuous Delivery tools available such as Jenkins, GitLab CI, Argo, etc. Enterprises should integrate one or more security solutions into their current and future CI/CD pipelines. A good solution would include alerts and events that allow developers to resolve the security issue prior to pushing anything into production.
    • Go Cloud Native. As mentioned earlier, containers can be a great way to ensure immutability. Paired with a powerful orchestration tool, such as Kubernetes, containers can completely transform the way we run distributed applications. There are many great benefits to “going cloud-native,” and several ways enterprises can protect their data and infrastructure by securing their cloud-native applications.

Successful Digital Transformation with DevSecOps

From government agencies to fast food chains, DevSecOps has enabled enterprises to quickly and securely transform their services and assets, even during a pandemic. For example, the US Department of Defense Enterprise DevSecOps Services Team has changed the average amount of time it takes for software to become approved for military use to days instead of years. For the first time ever, that same team managed to update the software on a spy plane that was in-flight!

On the commercial side of things, we’ve seen the pandemic force many businesses and enterprises to adopt new ways of doing things, especially in the food industry. For example, with restaurant seating shut down, Chick-fil-A has to rely heavily on its drive-thru, curbside, and delivery services. Where do those services begin? Software applications! Chick-fil-A obviously uses GitOps, Kubernetes, and AWS and controls large amounts of sensitive data for all of its customers, making it critical that Chick-fil-A implements DevSecOps instead of just DevOps. Imagine if your favorite fast food chain was hacked and your data was stolen – that would be extremely detrimental to business. With the suspiciously personalized ads that I receive on the Chick-fil-A app, there’s also reason to believe that Chick-fil-A has implemented DevSecMLOps, but that’s a topic for another discussion.

A Beginner’s Guide to Anchore Enterprise

[Updated post as of October 22, 2020]

While many Anchore Enterprise users are familiar with our open source Anchore Engine tool and have a good understanding of the way Anchore works, getting started with the additional features provided by the full product may at first seem overwhelming.

In this blog, we will walk through some of the major capabilities of Anchore Enterprise in order to help you get the most value from our product. From basic user interface (UI) usage to enabling third-party notifications, the following sections describe some common things to first explore when adopting Anchore Enterprise.

The Enterprise User Interface

Perhaps the most notable feature of Anchore Enterprise is the addition of a UI to help you navigate various features of Anchore, such as adding images and repositories, configuring policy bundle and whitelists, and scheduling or viewing reports.

The UI helps simplify the usability of Anchore by allowing you to perform normal Anchore actions without requiring a strong understanding of command-line tooling. This means that instead of editing a policy bundle as a JSON file, you can instead use a simple-to-use GUI to directly add or edit policy bundles, rule definitions, and other policy-based features.

Check out our documentation for more information on getting started with the Anchore Enterprise UI.

Advanced Vulnerability Feeds

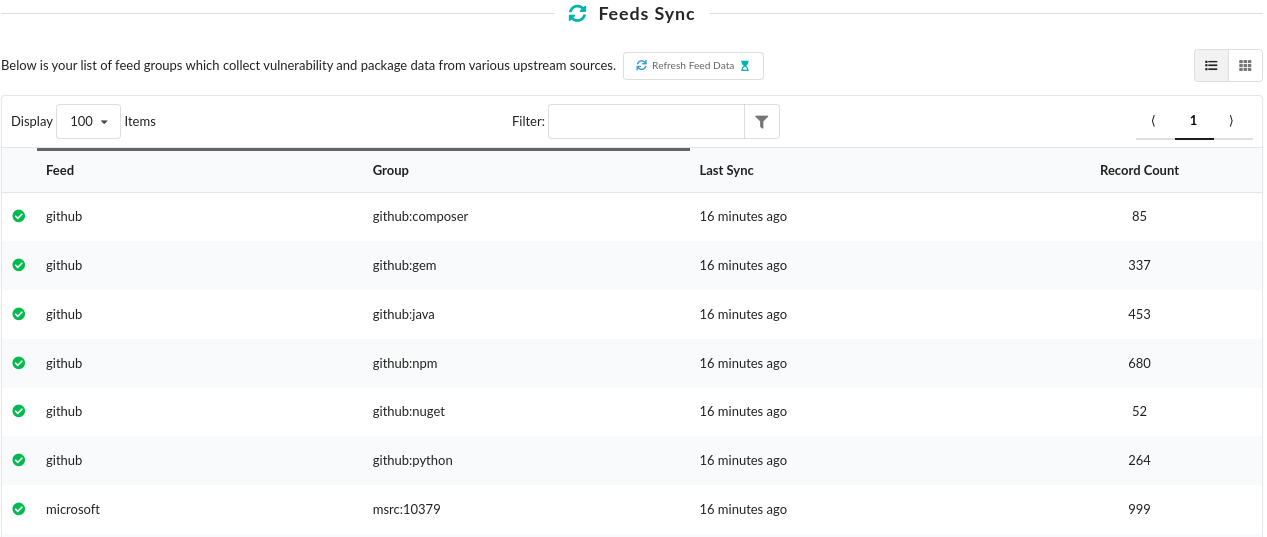
With the move to Anchore Enterprise, you have the ability to include third-party entitlements that grant access to enhanced vulnerability feed data from Risk Based Security’s VulnDB. You can also analyze Windows-based containers using vulnerability data provided by Microsoft Security Research Center (MSRC).

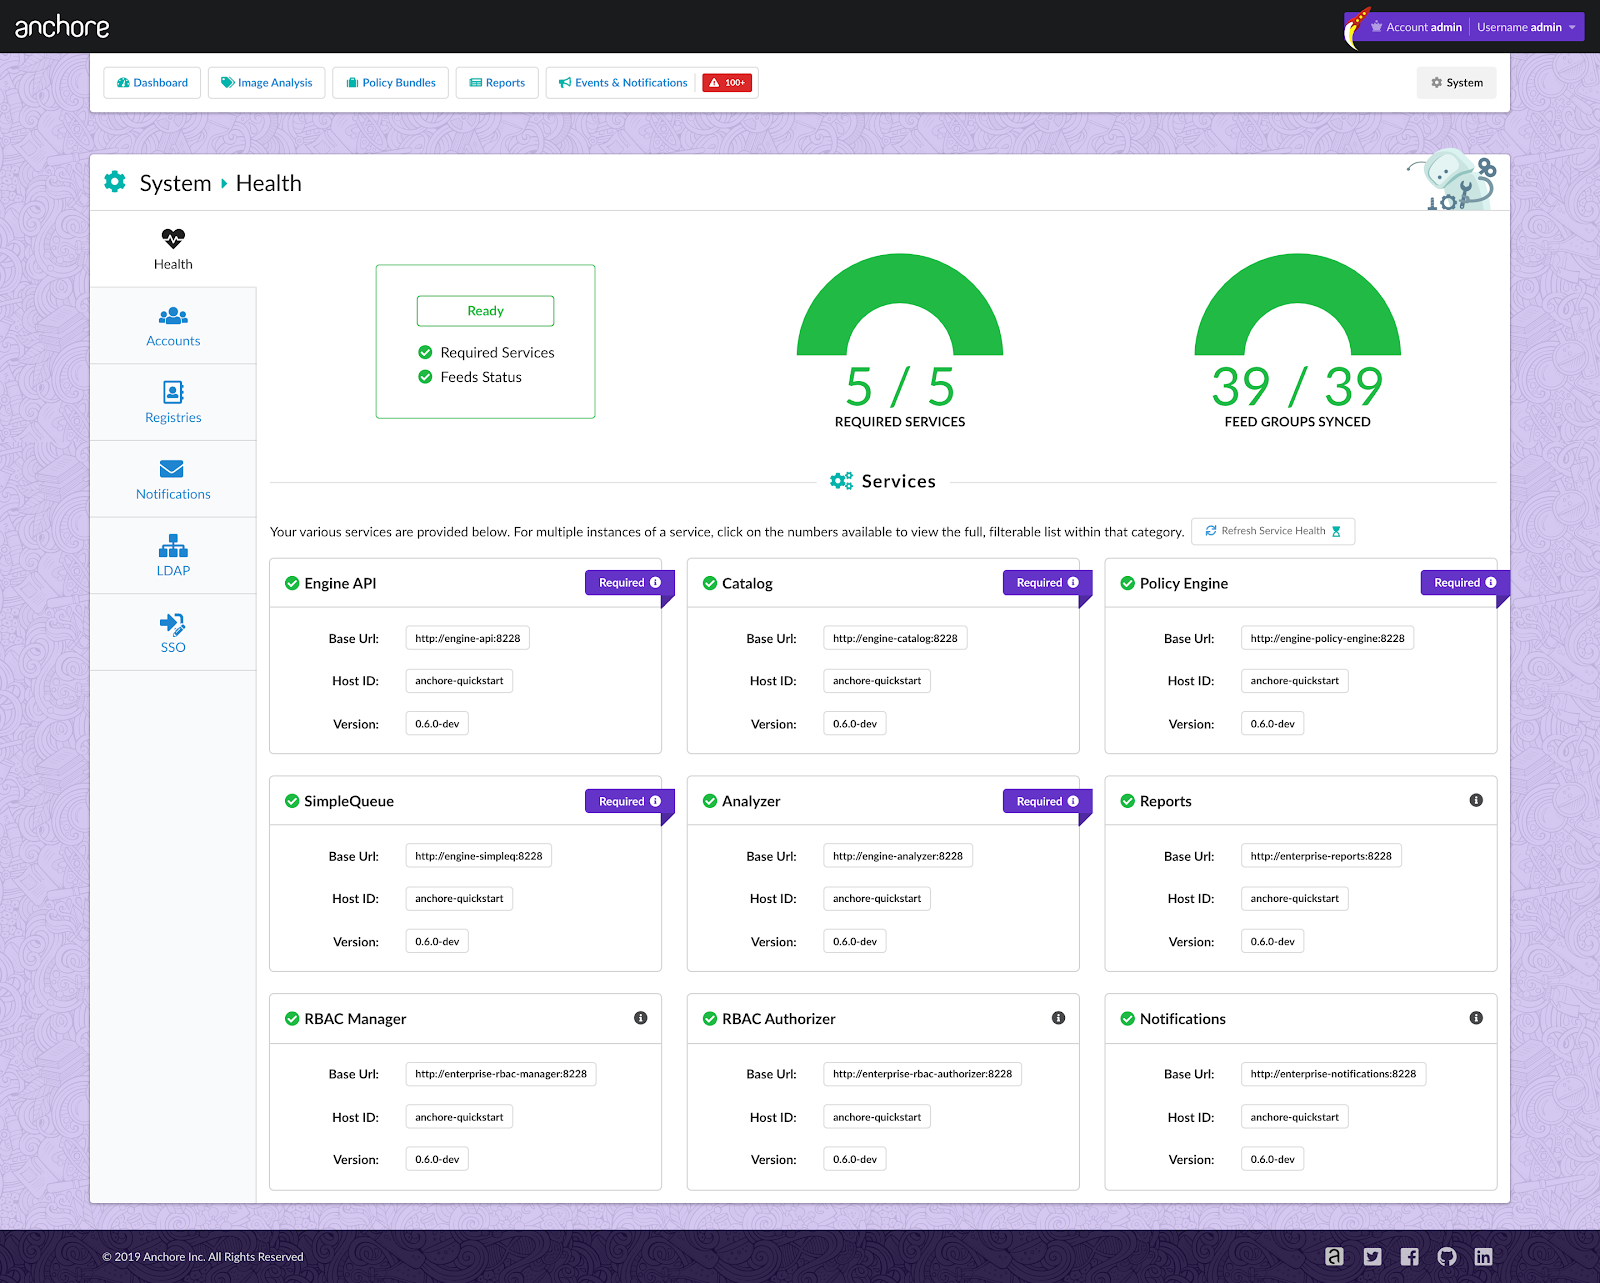
Additionally, feed sync statuses can be viewed directly in the UI’s System Dashboard, giving you insight into the status of the data feeds along with the health of the underlying Anchore services. You can read more about enabling and configuring Anchore to use a localized feed service.

Note: Enabling the on-premise (localized) feeds service is required to enable VulnDB and Windows feeds, as these feed providers are not included in the data provided by our feed service.

Enterprise Authentication

In addition to Role-Based Access Controls (RBAC) to enhance user and account management, Anchore Enterprise includes the ability to configure an external authentication provider using LDAP, or OAuth / SAML.

Single Sign-On can be configured via OAuth / SAML support, allowing you to configure Anchore Enterprise to use an external Identity Provider such as Keycloak, Okta, or Google-SSO (among others) in order to fit into your greater organizational identity management workflow.

You can use the system dashboard provided by the UI to configure these features, making integration straightforward and easy to view.

Take a look at our RBAC, LDAP, or our SSO documentation for more information on authentication/authorization options in Anchore Enterprise.

Third-Party Notifications

By using our Notifications service, you can configure your Anchore Enterprise deployment to send alerts to external endpoints (Email, GitHub, Slack, and more) about system events such as policy evaluation results, vulnerability updates, and system errors.

Notification endpoints can be configured and managed through the UI, along with the specific events that fit your organizational needs. The currently supported endpoints are:

  • Email—Send notifications to a specific SMTP mail service
  • GitHub—Version control for software development using Git
  • JIRA—Issue tracking and agile product management software by Atlassian
  • Slack—Team collaboration software tools and online services by Slack Technologies
  • Teams—Team collaboration software tools and online services by Microsoft
  • Webhook—Send notifications to a specific API endpoint

For more information on managing notifications in Anchore Enterprise, take a look at our documentation on notifications.

Conclusion

In this blog, we provided a high-level overview of several features to explore when first starting out with Anchore Enterprise. There are multiple other features that we didn’t touch on, so check out our product comparison page for a list of other features included in Anchore Enterprise vs. our open-source Engine offering.

Take a look at our FAQs for more information.

Our Top 5 Strategies for Modern Container Security

[Updated post as of October 15, 2020]

At Anchore, we’re fortunate to be part of the journey of many technology teams as they become cloud-native. We would like to share what we know.

Over the past several years, we’ve observed many teams perform microservice application modernization using containers as the basic building blocks. Using Kubernetes, they dynamically orchestrate these software units and optimize their resource utilization. Aside from the adoption of new technologies, we’ve seen cultural transformations as well.

For example, the breaking of organizational silos to provide an environment for “shifting left” with the shared goal of incorporating as much validation as possible before a software release. One specific area of transformation which is fascinating to us here is how cloud-native is modernizing both development and security practices, along with CI/CD and operations workflows.

Below, we discuss how foundational elements of modern container image security, combined with improved development practices, enhance software delivery overall. For the purposes of this blog, we’ll focus mainly on the image build and the surrounding process within the CI stages of the software development lifecycle.

Here is some high-level guidance all technology teams using containers can implement to increase their container image security posture.

  1. Use minimal base images: Use minimal base images only containing necessary software packages from trusted sources. This will reduce the attack surface of your images, meaning there is less to exploit, and it will make you more confident in your deployment artifacts. To address this, Red Hat introduced Universal Base Images designed for applications that contain their own dependencies. UBIs also undergo regular vulnerability checking and are continuously maintained. Other examples of minimal base images are Distroless images, maintained by Google, and Alpine Linux images.
  2. Go daemonless: Moving away from the Docker CLI and daemon client/server model and into a “daemonless” fork/exec model provides advantages. Traditionally, with the Docker container platform, image build, registry, and container operations happen through what is known as the daemon. Not only does this create a single point of failure, but Docker operations are conducted by a user with full root authority. More recently, tools such as Podman, Buildah, and Skopeo (we use Skopeo inside of Anchore Engine) were created to address the challenges of building images, working with registries, and running containers. For a bit more information the security benefits of using Podman vs Docker read this article by Dan Walsh.
  3. Require image signing: Require container images to be signed to verify their authenticity. By doing so you can verify that your images were pushed by the correct party. Image authenticity can be verified with tools such as Notary, and both Podman and Skopeo (discussed above) also provide image signing capabilities. Taking this a step further, you can require that CI tools, repositories, and all other steps in the CI pipeline cryptographically sign every image they process with a software supply chain security framework such as in-toto.
  4. Inspect deployment artifacts: Inspect container images for vulnerabilities, misconfigurations, credentials, secrets, and bespoke policy rule violations prior to being promoted to a production registry and certainly before deployment. Container analysis tools such as Anchore can perform deep inspection of container images, and provide codified policy enforcement checks which can be customized to fit a variety of compliance standards. Perhaps the largest benefit of adding security testing with gated policy checks earlier in the container lifecycle is that you will spend less time and money fixing issues post-deployment.
  5. Create and enforce policies: For each of the above, tools selected should have the ability to generate codified rules to enable a policy-driven build and release practice. Once chosen they can be integrated and enforced as checkpoints/quality control gates during the software development process in CI/CD pipelines.

How Improved Development Practices Help

The above can be quite challenging to implement without modernizing development in parallel. One development practice we’ve seen change the way organizations are able to adopt supply chain security in a cloud-native world is GitOps. The declarative constructs of containers and Kubernetes configurations, coupled with infrastructure-as-code tools such as Terraform provide the elements for teams to fully embrace the GitOps methodology. Git now becomes the single source of truth for infrastructure and application configuration, along with policy-as-code documents. This practice allows for improved knowledge sharing, code reviews, and self-service, while at the same time providing a full audit trail to meet compliance requirements.

Final Thought

The key benefit of adopting modern development practices is the ability to deliver secure software faster and more reliably. By shifting as many checks as possible into an automated testing suite as part of CI/CD, issues are caught early, before they ever make their way into a production environment.

Here at Anchore, we’re always interested in finding out more about your cloud-native journey, and how we may be able to help you weave security into your modern workflow.

Adopt Zero Trust to Safeguard Containers

In a time where remote access has shifted from the exception to the new normal, users require access to enterprise applications and services from outside the traditional boundaries of an enterprise network. The rising adoption of microservices and containerized applications have further complicated things. Containers and their underlying infrastructure don’t play well within the boundaries of traditional network security practices, which typically emphasize security at the perimeter. As organizations look for ways to address these challenges, strategies such as the Zero Trust model have gained traction in securing containerized workloads.

What is the Zero Trust Model?

Forrester Research introduced the Zero Trust model in 2010, emphasizing a new approach to security: “never trust, always verify.” The belief was that traditional security methodologies focused on securing the internal perimeter were no longer sufficient and that any entity accessing enterprise applications and services needed to be authenticated, authorized, and continuously validated, whether inside or outside of the network perimeter, before being granted or keeping access to applications and their data. 

Since then, cloud adoption and the rise in a distributed enterprise model has seen organizations looking to adopt these principles in a time where security threats and breaches have become commonplace. Google, a regular early adopter in new technological trends, released a series of whitepapers and other publications in 2014 detailing its implementation of the Zero Trust model in a project known as BeyondCorp

Zero Trust and Containerized Workloads

So how can organizations apply Zero Trust principles on their containerized workloads?

Use Approved Images

A containerized environment gives you the ability to bring up new applications and services quickly using free and openly distributed software rather than building them yourself. There are advantages to using open source software but this also presents the inherent risk of introducing vulnerabilities and other issues into your environment. Restricting the use of images to those that have been vetted and approved can greatly reduce their attack surface and ensure only trusted applications and services are being deployed into production.

Implement Network Policies

Container networking introduces complexities such as nodes, pods, containers, and service endpoints assigned IP addresses typically on different network ranges requiring interconnectivity to function properly. As a result, each of these endpoints is generally configured to communicate freely by default. Implementing network policies and micro-segmentation enforces explicit controls around traffic and data flowing between these entities to ensure that only permitted communications are established. 

Secure Endpoints

In traditional enterprise networks, workloads are often assigned static IP addresses as an identifier and controls are placed around which entities can access certain IP addresses. Containerized applications are typically short-lived, resulting in a dynamic environment with large IP ranges, making it harder to track and audit network connections. To secure these endpoints and the communications between them, organizations should focus on continuously validating and authorizing identities. An emphasis should also be placed on encrypting any communications between endpoints.

Implement Identity-Based Policies

One of the most important aspects of Zero Trust is ensuring that no entity, inside or outside the perimeter, is authorized to access privileged data and systems without first validating and confirming their identity. As previously mentioned, IP-based validation is no longer sufficient in a containerized environment. Instead, enterprises should enforce policies based on the identities of the actual workloads running in their environments. Role-based access control can facilitate the implementation of fine-grained access policies based on an entity’s characteristics while employing a least-privilege approach further narrows the scope of access by ensuring that any entity requiring privileged access is granted only the minimum level of permissions required to perform a set of actions. 

Final Thoughts

Container adoption has become a point of emphasis for many organizations in their digital transformation strategies. While there are many benefits to containers and microservices, organizations must be careful not to combine new technologies with archaic enterprise security methodologies. As organizations devise new strategies for securing containerized workloads in a modernized infrastructure, the Zero Trust model can serve as a framework for success. 

The Story Behind Anchore Toolbox

As tool builders, we interact daily with teams of developers, operators, and security professionals working to achieve efficient and highly automated software development processes.  Our goal with this initiative is to provide a technology-focused space for ourselves and the community to build and share a variety of open-source tools to provide data gathering, security, and other capabilities in a form specifically designed for inclusion in developer and developer infrastructure workflows.

This post will share the reasoning, objectives, future vision, and methods for joining and contributing to this new project from Anchore.

Why Anchore Toolbox?

Over the last few years, we’ve witnessed a significant effort in the industry to adopt highly automated, modern software delivery lifecycle (SDLC) management processes.  As container security and compliance technology providers, we often find ourselves deeply involved in security/compliance discussions with practitioners and the general design of new, automation-oriented developer infrastructure systems.  Development teams are looking to add or start with automated security and compliance data collection and controls directly into their SDLC processes. We believe there is an opportunity to translate many of the lessons learned along the way into small, granular tools specifically (and importantly!) designed to be used within a modern developer/CI/CD environment.  Toward this objective, we’ve adopted a UNIX-like philosophy for projects in the Toolbox.  Each specific tool is a stand-alone element with a particular purpose your team can combine with other tools to construct more comprehensive flows. This model lends itself to useful manual invocation. We also find it works well when integrating these types of operations into existing CI/CD platforms such as GitHub, GitLab, Atlassian BitBucket, Azure Pipelines, and CloudBees as they continue to add native security and compliance interfaces.

What’s Available Today?

We include two tools in Anchore Toolbox to start – Syft,  a software bill of materials generator, and Grype, a container image/code repository vulnerability scanner.  Syft and Grype are fast and efficient software analysis tools that come from our experience building technologies that provide deep container image analysis and security data.

To illustrate how we envision DevSecOps teams using these tools in practice, we’ve included a VS Code extension for Grype and a new version of the Anchore Scan GitHub action, based on Grype, that supplies container image security findings to GitHub’s recently launched code scanning feature set. 

Both Syft and Grype are light-weight command-line tools by design. We wrote them in Go, making them very straightforward additions to any developer/developer infrastructure workflow. There’s no need to install any language-specific environments or struggle with configurations to pass information in and out of a container instance.  To support interoperability with many SBOM, security, and compliance data stores, you can choose to generate results in human-readable, JSON, and CycloneDX format.

Future of Anchore Toolbox

We’re launching the Anchore Toolbox with what we believe are important and fundamental building block elements that by themselves fill in essential aspects of the modern SDLC story, but we’re just getting started.  We would love nothing more than to hear from anyone in the community who shares our enthusiasm for bringing the goals of security, compliance, and insight automation ever closer.  We look forward to continuing the discussion and working with you to improve our existing projects and to bring new tools into the Toolbox!

For more information – check out the following resources to start using Anchore Toolbox today.

Introducing Anchore Toolbox: A New Collection of Open Source DevSecOps Tools

Anchore Toolbox is a collection of lightweight, single-purpose, easy to use, open source DevSecOps tools that Anchore has developed for developers and DevOps teams who want to build their continuous integration/continuous development (CI/CD) pipeline.

We’re building Toolbox to support the open source DevSecOps community by providing easy-to-use just in time tools available at the command line interface (CLI). Our goal is for Toolbox to serve a fundamentally different need than Anchore Enterprise by offering DevSecOps teams single-purpose tools optimized for speed and ease of use.

The first tools to debut as part of Anchore Toolbox are Syft and Grype:

Syft

We built Syft from the ground up to be an open source analyzer that serves developers who want to “shift left” and scan their projects still in development. You can use Syft to scan a container image, but also a directory inside your development project.

Syft tells you what’s inside your super complicated project or container and builds you a detailed software bill of materials (SBOM). You can output an SBOM from Syft as a text file, table, or JavaScript Object Notation (JSON) file and includes native output support for the CycloneDX format. 

Installing Syft

We provide everything you need, including full documentation for installing Syft over on GitHub.

Grype

Grype is an open source project to scan your project or container for known vulnerabilities. Grype uses the latest information from the same Anchore feed services as Anchore Engine. You can use Grype to identify vulnerabilities in most Linux operating system packages and language artifacts, including NPM, Python, Ruby, and Java.

Grype provides output similar to Syft, including table, text, and JSON. You can use Grype on container images or just directories. 

Installing Grype

We provide everything you need, including full documentation for installing Grype over on GitHub.

Anchore’s Open Source Portfolio and DevSecOps

Open source is a building block of today’s DevSecOps toolchain and integral to the growth of the DevSecOps community’s growth at large. Anchore Toolbox is part of our strategy to contribute to both the open source and DevSecOps communities and do our part to advance container security practices.

The Anchore Open Source Portfolio also includes two other elements:

  • Out-of-the-box integrations that connect Anchore open source technologies with common CI/CD platforms and developer tools with current integrations including GitHub Actions, Azure Pipelines, BitBucket Pipes, and Visual Studio Code
  • Anchore Engine, a persistent service that stores SBOMs and scan results for historical analysis and API-based interaction

Learn more about Anchore Toolbox

The best way to learn about Syft and Grype is to use them! Also, stay tuned this week for a blog on Thursday, October 8, 2020, from Dan Nurmi, Anchore CTO, who tells the story behind Anchore Toolbox and offers a look forward at what we plan to do with open source as a company.

Join the Anchore Community on Slack to learn more about Toolbox developments and interact with our online community, file issues, and give feedback about your experience with these new tools.

Deploying Anchore Enterprise 2.4 on AWS Elastic Kubernetes Services (EKS) with Helm

[Updated post as of October 1, 2020]

In this post, I will walk through the steps for deploying Anchore Enterprise v2.4 on Amazon EKS with Helm. Anchore currently maintains a Helm Chart which we will use to install the necessary Anchore services.

Prerequisites

  • A running Amazon EKS cluster with worker nodes launched. See EKS Documentation for more information.
  • Helm (v3) client installed and configured.

Before we proceed, let’s confirm our cluster is up and running and we can access the kube-api server of our cluster:

Note: Since we will be deploying all services including the database as pods in the cluster, I have deployed a three-node cluster with (2) m5.xlarge and (1) t3.large instances for a basic deployment. I’ve also given the root volume of each node 65GB (195GB total) since we will be using the cluster for persistent storage of the database service.

$ kubectl get nodes NAME                                    

 STATUS ROLES AGE VERSION

ip-10-0-1-66.us-east-2.compute.internal  Ready <none> 1d  v1.16.12-eks ip-10-0-3-15.us-east-2.compute.internal  Ready <none> 1d  v1.16.12-eks ip-10-0-3-157.us-east-2.compute.internal Ready <none> 1d  v1.16.12-eks

Configuring the Ingress Controller

The ALB Ingress Controller triggers the creation of an Application Load Balancer (ALB) and the necessary supporting AWS resources whenever an Ingress resource is created on the cluster with the kubernetes.io/ingress.class: alb annotation.

To support external access to the Enterprise UI and Anchore API, we will need the cluster to create an ALB for our deployment.

To enable the ALB Ingress Controller pod to create the load balancer and required resources, we need to update the IAM role of the worker nodes and tag the cluster subnets the ingress controller should associate the load balancer with.

  • Download the sample IAM Policy from AWS and attach it to your worker node role either via console or aws-cli.
  • Add the following tags to your cluster’s public subnets:
Key Value
kubernetes.io/cluster/<<cluster-name>> shared
Key Value
kubernetes.io/role/elb 1

Next, we need to create a Kubernetes service account in the kube-system namespace, a cluster role, and a cluster role binding for the ALB Ingress Controller to use:

$ kubectl apply -f https://raw.githubusercontent.com/kubernetes-sigs/aws-alb-ingress-controller/v1.1.8/docs/examples/rbac-role.yaml

With the service account and cluster role resources deployed, download the AWS ALB Ingress Controller deployment manifest to your working directory:

$ wget https://raw.githubusercontent.com/kubernetes-sigs/aws-alb-ingress-controller/v1.1.8/docs/examples/alb-ingress-controller.yaml

Under the container specifications of the manifest, uncomment  --cluster-name=  and enter the name of your cluster:

# REQUIRED
 # Name of your cluster. Used when naming resources created
 # by the ALB Ingress Controller, providing distinction between
 # clusters.
 - --cluster-name=<eks_cluster_name>

Save and close the deployment manifest, then deploy it to the cluster:

$ kubectl apply -f alb-ingress-controller.yaml

Installing the Anchore Engine Helm Chart

To install the chart repository, run the following command:

$ helm repo add anchore https://charts.anchore.io

"anchore" has been added to your repositories

Confirm the chart was installed successfully:

$ helm repo list
NAME    URL
anchore https://charts.anchore.io

Deploying Anchore Enterprise

For the purposes of this post, we will focus on getting a basic deployment of Anchore Enterprise running. For a complete set of configuration options you may include in your installation, refer to the values.yaml file in our charts repository.

Note: Refer to our blog post Configuring Anchore Enterprise on EKS for a walkthrough of common production configuration options including securing the Application Load Balancer/Ingress Controller deployment, using S3 archival and configuring a hosted database service such as Amazon RDS.

Configure Namespace and Credentials

First, let’s create a new namespace for the deployment:

$ kubectl create namespace anchore

namespace/anchore created

Enterprise services require an active Anchore Enterprise subscription (which is supplied via license file), as well as Docker credentials with permission to the private docker repositories that contain the enterprise images.

Create a Kubernetes secret in the anchore namespace with your license file:

Note: You will need to reference the exact path to your license file on your localhost. In the example below, I have copied my license to my working directory.

$ kubectl -n anchore create secret generic anchore-enterprise-license --from-file=license.yaml=./license.yaml

secret/anchore-enterprise-license created

Next, create a secret containing the Docker Hub credentials with access to the private anchore enterprise repositories:

$ kubectl -n anchore create secret docker-registry anchore-enterprise-pullcreds --docker-server=docker.io --docker-username=<DOCKERHUB_USER> --docker-password=<DOCKERHUB_PASSWORD> --docker-email=<EMAIL_ADDRESS>

secret/anchore-enterprise-pullcreds created

Ingress

Create a new file named anchore_values.yaml in your working directory and create an ingress section with the following contents:

ingress: 

  enabled: true 

  # Use the following paths for GCE/ALB ingress controller

  apiPath: /v1/* 

  uiPath: /*

  annotations: kubernetes.io/ingress.class: alb alb.ingress.kubernetes.io/scheme: internet-facing

Engine API

Below the ingress section add the following block to configure the Enterprise API:

Note: To expose the API service, we set the service type to NodePort instead of the default ClusterIP

anchoreApi:
  replicaCount: 1

  # kubernetes service configuration for anchore external API
  service:
    type: NodePort
    port: 8228
    annotations: {}

Enable Enterprise Deployment

Next, add the following to your anchore_values.yaml file below the anchoreApi section:

anchoreEnterpriseGlobal:
    enabled: true

Enterprise UI

Like the API service, we’ll need to expose the UI service to ensure it is accessible outside the cluster. Copy the following section at the end of your anchore_values.yaml file:

anchoreEnterpriseUi:
  enabled: true
  image: docker.io/anchore/enterprise-ui:latest
  imagePullPolicy: IfNotPresent

  # kubernetes service configuration for anchore UI
  service:
    type: NodePort
    port: 443
    annotations: {}
    labels: {}
    sessionAffinity: ClientIP

Deploying the Helm Chart

To install the chart, run the following command from the working directory:

$ helm install --namespace anchore <your_release_name> -f anchore_values.yaml anchore/anchore-engine

It will take the system several minutes to bootstrap. You can checks on the status of the pods by running kubectl get pods:

$ kubectl -n anchore get pods 

NAME READY STATUS RESTARTS AGE 

anchore-cli-5f4d697985-rdm9f 1/1 Running 0 14m anchore-enterprise-anchore-engine-analyzer-55f6dd766f-qxp9m 1/1 Running 0 9m 

anchore-enterprise-anchore-engine-api-bcd54c574-bx8sq 4/4 Running 0 9m anchore-enterprise-anchore-engine-catalog-ddd45985b-l5nfn 1/1 Running 0 9m 

anchore-enterprise-anchore-engine-enterprise-feeds-786b6cd9mw9l 1/1 Running 0 9m anchore-enterprise-anchore-engine-enterprise-ui-758f85c859t2kqt 1/1 Running 0 9m 

anchore-enterprise-anchore-engine-policy-846647f56b-5qk7f 1/1 Running 0 9m 

anchore-enterprise-anchore-engine-simplequeue-85fbd57559-c6lqq 1/1 Running 0 9m 

anchore-enterprise-anchore-feeds-db-668969c784-6f556 1/1 Running 0 9m anchore-enterprise-anchore-ui-redis-master-0 1/1 Running 0 9m anchore-enterprise-postgresql-86d56f7bf8-nx6mw 1/1 Running 0 9m

Run the following command to get details on the deployed ingress:

$ kubectl -n anchore get ingress

NAME    HOSTS   ADDRESS  PORTS   AGE

support-anchore-engine   *       1a2b3c4-anchoreenterprise-f9e8-123456789.us-east-2.elb.amazonaws.com   80      4h

You should see the address for the created and can use it to navigate to the Enterprise UI:

Anchore Enterprise login screen.

Conclusion

You now have an installation of Anchore Enterprise up and running on Amazon EKS. The complete contents for the walkthrough are available by navigating to the GitHub repo here. For more info on Anchore Engine or Enterprise, you can join our community Slack channel, or request a technical demo.

Compliance’s Role in Container Image Security and Vulnerability Scanning

Compliance is the practice of observing a set of standards for recommended security controls laid out by a particular agency or industry that an application must adhere to or face stiff penalties. Today, most enterprises have regulations to protect information and assets from the Center for Internet Security (CIS) to the Health Insurance Portability and Accountability Act (HIPAA). As with most things in compliance, it’s how an agency or company configures applications and services that counts. While vulnerability scanning and image analysis are crucial parts of container security, ensuring that images are compliant with organizational and industry regulations extends beyond merely looking for vulnerabilities.

NIST SP 800-190

An example of such an agency is the National Institute of Standards and Technology (NIST). NIST is a non-regulatory government agency that develops technology, metrics, and standards to drive innovation and economic competitiveness at U.S. based organizations in the science and technology industry. Companies that are providing products and services to the federal government are often required to meet the NIST security mandates. NIST provides guidance with Special Publication (SP) 800-190, which addresses the security concerns associated with application container technologies.

CIS Docker Benchmark

The Center for Internet Security (CIS), with its CIS 1.13.0 Docker compliance guide, provides a  more general recommended compliance guideline. A CIS 1.13.0 policy bundle that addresses compliance regulations outlined by CIS is available in Anchore’s Policy Hub, making it simple to enforce these checks with Anchore out of the box. Many common CIS compliance checks have been implemented with the CIS policy bundle or have examples for end-users to customize. Still, all Anchore policy bundles can be extended or even have new bundles created that are tailored directly to application and industry recommendations.

Enforcing Compliance with Anchore

As outlined in this previous blog post written by our very own Jeremy Valance, enforcing compliance with Anchore is a straightforward and flexible way to adhere to varying industry regulations. Given the variance of compliance needs across different enterprises, having a flexible and robust policy engine becomes necessary for organizations needing to stick to one or many sets of standards. With Anchore, development and security teams can harden their container security posture by adding an image scanning step to their CI, reporting back on CVEs, and fine-tuning policies to meet compliance requirements. Putting compliance checks in place ensures that only container images that meet the standards outlined by a particular agency or industry will be allowed to make their way into production-ready environments. 

You can find more information on working with Anchore policies here.

The Importance of Building Trust in Cloud Security, A Shared Responsibility With DevOps Teams

Overall the world is moving towards the cloud. Companies all across the globe are recognizing the merit of overcoming infrastructure challenges by using cloud services. While moving to cloud infrastructure solves many complex problems faced by companies, it introduces new challenges. One of the main challenges is the security of business-critical information that companies are now storing inside cloud infrastructure.

Storing data inside cloud infrastructure is easy and convenient, but it comes with a whole new set of technical challenges for DevOps engineers. Cloud services provide a highly configurable environment that can be adapted to any application. However, it is a new environment, and engineers must learn how to configure the system properly. The infrastructure must be configured appropriately; user accounts must be tracked and have the appropriate permissions, applications must be secure, the infrastructure running those applications must also be secured.

Misconfigured cloud systems are a significant risk for data breaches where a company can lose important data. These data losses can cause incredible damage to a company, not only causing a loss in revenue and trust, but also a loss of reputation. These costly mistakes, more often than not, stem from a misconfigured system. Misconfigurations can include user accounts that have higher privileges than they should, web servers that are exposed to the public when they shouldn’t be. Multi-factor authentication is not made a requirement when it should be.

Overall the cloud has a lot to offer, the upsides are highly performant and scalable infrastructure, along with toolsets that give DevOps Engineers control over their system from top to bottom. However, this improved way of deploying and controlling production software is accompanied by a new set of security challenges. These security challenges come from the requirement to learn a whole new cutting edge system. In order to secure business-critical systems, tooling must be developed so that DevOps engineers can use the toolsets to ensure only secure software is running in production handling business-critical information. The landscape for production software is changing so quickly, and there is such a minuscule margin of error that there must be a focus on not only automated deployment but automated security as well. The infrastructure must be audited to ensure security. Applications must be audited for security before deployment, during deployment, and while running.

It is the responsibility of DevOps Engineers to ensure that the software running business-critical systems is secure. With such an extensive and highly configurable system offered by cloud providers, many small misconfigurations can fall through the cracks. The best way to overcome the challenges of ensuring software security is to develop automation using security tooling to ensure your system conforms to the requirements. Once automation has been put in place, it will ensure that any system goes through the same rigorous process and security checks before it makes it into production. This helps reduce the number of misconfigurations due to human error, and it will help increase the overall trustworthiness of production software.

Cloud infrastructure has so much to offer to improve the overall performance and data handling for companies today. However, it also comes with a whole new set of challenges that DevOps Engineers must face.

As companies put more and more of their information into the cloud, it falls on DevOps Engineers to ensure that data is safely managed. The cloud, by its nature, is highly configurable, and thus, the security of the workloads running on it are subject to the configuration of the system. This configuration ultimately falls on the shoulders of DevOps Engineers, who must learn how to configure the system properly. To configure complex cloud systems, tooling and automation must be used to provide engineers a way to deploy software so that it is secure and trustworthy. Deploying software in this manner helps alleviate the complexity introduced by cloud systems and allows the engineers some peace of mind when their production software handles business-critical information.

Container Security & Automation, How To Implement And Keep Up With CI/CD

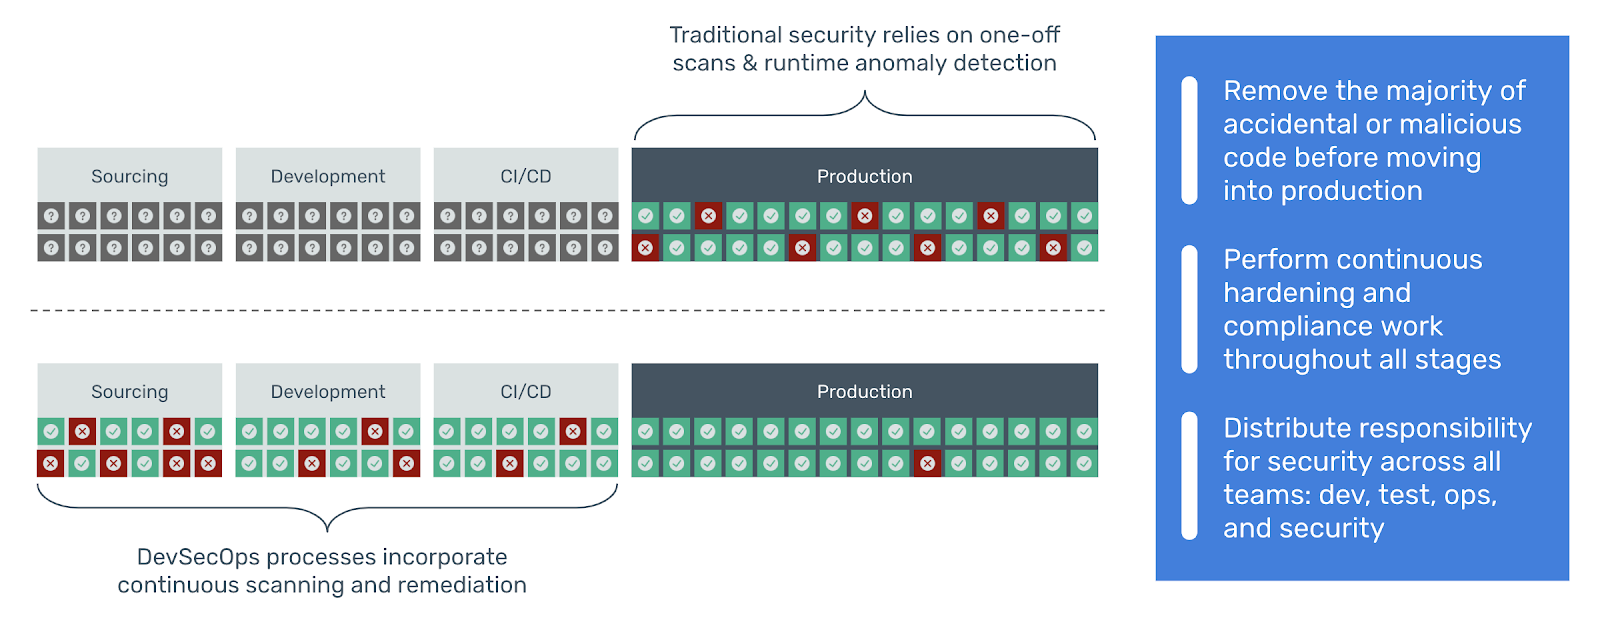
A major issue in modern software development is the fact that most organizations are quick to adopt containers and automation, but remain behind the curve in adopting DevSecOps processes that ensure container security. By sharing the responsibility of security across all software teams, organizations can begin to identify vulnerabilities earlier in their SDLC (software development lifecycle) and engrain security and compliance into their current and future CI/CD (Continuous Integration/Continuous Delivery) workflows.

Empowering Developers Before CI/CD

One of the first steps an organization should take towards sharing the responsibility of security across all teams is to empower their developers with visibility and knowledge into security threats. As the ones who initially create and improve code, developers need to be aware of the weaknesses in the packages and libraries they are using. Since developers are typically working on local machines, Anchore has created open source CLI tools that enable developers to generate SBOMs (software bill of materials) and identify vulnerabilities not only in container images but also in code and filesystems. Currently in pre-release, Syft and Grype are ideal for projects in development and will soon include automated vulnerability scanning with IDE (integrated development environment) plugins. This allows for development and security teams to communicate and remediate security threats prior to wasting time or money on operational resources.

Automating Security During CI

Once the development and security teams have acknowledged and accepted the threat level in a software project or feature, they may decide to run the code through a CI pipeline. These pipelines are usually owned by DevOps (development operations) Engineers and may include stages like building a container image, running tests, and pushing the image to a registry. 

In order to share the responsibility of security across teams, an organization should ensure there is a vulnerability scanning and compliance stage in every pipeline. With easy integration with CI tools such as GitLab CI, Jenkins, and AWS CodeBuild, Anchore Enterprise 2.4.0 makes it simple for operations teams to incorporate things like malware scanning, base image comparisons, and enhanced vulnerability feeds to discover vulnerable points in the attack surface that the development team would have missed. When Anchore finds vulnerable points in the attack surface, future pipeline stages can be configured to fail and the operations team can be alerted so that development and security teams can work to resolve the security issue.

Ensuring Compliance During CD

When a feature is ready and it comes time to deploy into production through an orchestration tool such as Kubernetes, it is important that organizations remain vigilant in their “final evaluation” of a container image before runtime. The security team may have requirements like blocking containers from using specific packages, ports, or user permissions. The organization may have a mandated level of compliance to achieve such as DISA, NIST, or PCI DSS compliance. Anchore makes it simple for the security team to enforce security and compliance checks with policy as code.

Additionally, the Anchore Admission Controller can ensure non-compliant containers are blocked from being deployed. Regardless of whether someone is attempting to deploy containers with a CD tool like Argo or by creating a pod, deployment, or stateful set, the Anchore Admission Controller will evaluate each container against the security team’s policy before deciding to deploy or not deploy.

Conclusion

As attackers are constantly looking to take advantage of vulnerable points, organizations should be looking for their own vulnerable points. By sharing the responsibility of security across all software teams, modern organizations can begin identifying threats earlier and automating container security processes in their CI/CD workflows.

Container Registry Audits, 3 Reasons to Implement for Container Security & Compliance

The ease of access a container registry provides users is a clear advantage over legacy code storage methods. However, just like almost any other type of technology, it has the potential to house and propagate malicious code. Docker Hub was a prime example of this, as is detailed in this post about malicious cryptocurrency mining code being buried in popular images. Any container registry is susceptible to this. Therefore, scanning images for vulnerabilities and malicious code is critical for organizational security and the security of the development community as a whole.

Reason 1 – Internal Company Security

To deliver a quality software product, companies need to ensure that the tools they use internally are secure and can be relied on. Auditing self-managed company registries is an important part of that process, especially if the code contained in those registries is written by external sources. It is easy for an engineer to accidentally introduce malicious code to the registry without knowing. By ensuring that tools are secure, the end product that is delivered to customers, as well as important, proprietary company information, can be kept secure. 

Reason 2 – Product Security

Securing a product is an important consideration that all software companies must keep in mind when contemplating the methods they use to deliver code to their customers. Auditing registries that hold code available to customers is a way companies can ensure that any code delivered lives up to their security standards and that no vulnerabilities whether intentional or unintentional slip through the cracks. Additionally, certain industries have stringent guidelines that any software product must adhere to. An example is the healthcare industry. The importance of securing HIPAA protected data cannot be overstated, so checks to ensure that data leaks are not possible are important to maintaining compliance under government and company guidelines and requirements. This helps maintain trust with regulatory authorities and with customers.

Reason 3 – Open Source Security

Open source security is the third and perhaps most important reason to implement registry audits. Large open source registries have code flooding into them from anyone, anywhere, with any intention. It is all too easy for a person to create an image and push it to Docker Hub. A nefarious image disguised as a common open source project such as MySQL has the potential to wreak havoc on those who unwittingly deploy that image. By maintaining the integrity of the code that is available to the open source community, public registry maintainers can ensure that those who use the containers to build other products or learn are protected from attacks or attempts to steal their data.

The importance of container registry audits cannot be overstated. Containerization is an important development in the software delivery process. It has allowed for the quick and flexible deployment of countless applications, but it has taken the transparency to the user all but away making it difficult for a developer or user to know exactly what the code they are using is doing. With this loss of transparency, users, developers and anyone else who access these containers, needs to know that they are safe from malicious code and data security violations. By auditing the registries that secure that code, users can rest assured that the containers they use are safe and that the data they feed those containers is equally safe.

Sharing Compliance & Security, How DevOps Benefits From Shifting Left to DevSecOps

At Anchore, we work across the spectrum of many organizations’ transformation journeys to DevSecOps. One of the most notable and exciting transformations we’ve been involved with over the past couple of years is the U.S. Department of Defense (DoD) Enterprise DevSecOps Initiative. This initiative is perhaps best described by U.S. Air Force Chief Software Officer Nicolas Chaillan, in this video from Kubecon 2019. While we are fans of buzzwords and IT trends, we also are mindful of the different DevOps and DevSecOps stages of maturity each IT organization is at. In this post, we will share three key benefits of moving to DevSecOps at any maturity stage.

Before we dive into specifics, let’s start with a definition from Wikipedia for DevOps:

DevOps is a set of practices that combines software development (Dev) and IT operations (Ops). It aims to shorten the systems development lifecycle and provide continuous delivery with high software quality. 

From this, we can describe DevSecOps.

DevSecOps is an augmentation of DevOps. It means thinking about application and infrastructure security from the start. It also means automating security gates to keep the DevOps workflow from slowing down. It builds on the cultural changes and philosophies of DevOps to integrate the work of security teams sooner rather than later. DevSecOps also underscore the importance of helping developers write their software with security in mind, a process that typically involves sharing visibility, and insights on known threats or malicious activity. In addition, it requires security teams to build security into the software lifecycle end to end, with a set plan for automation. 

Benefit 1: Saving Cost and Time

Perhaps the most obvious benefit of incorporating automated security gates into existing software development workflows is saving cost and time. Shifting security left allows for vulnerabilities, misconfigurations, and other security risks to be caught closer to the developers, which means issues are caught early and triaged quickly. It is far cheaper and simpler to resolve a known security problem directly in the build pipeline or at the IDE step than post-deployment. 

Benefit 2: Better Collaboration and Communication Among Teams

Perhaps an obvious one, but by bringing security into the conversation as early as possible, and promoting collaboration with development and operations teams, developers now see security as an enabler, not an impediment. This adds to a culture of openness, accountability, and transparency across applications, infrastructure, security and compliance requirements, and runtime environments. 

Benefit 3: Faster Response to Changing Customer Needs

Somewhat related to the first benefit, however important to highlight the importance of rapid response to changes in the marketplace. For any organization developing and shipping software products or services to end-users, there are often compliance requirements for handling sensitive customer data, or security standards and audits SaaS or PaaS providers must meet. These requirements often struggle to keep up with the pace of technology innovation, however, the more automation and collaboration IT organizations can put around compliance requirements, the better they can adapt when new changes are published.

Conclusion

The above three benefits certainly aren’t meant to be exhaustive, however, based on our experience being embedded in one of the largest transformations to DevSecOps, these are the three we’ve seen as most impactful across the DoD organization.

Part 2, A Container Security Terminology Guide For Better Communication

In part 1 of our container security terminology guide, we introduced everyone to our shift left lexicon to help you gain a clear understanding of the key phrases and common phrases used in DevSecOps. Today, we’re sharing part 2 of our guide where we’ll broaden our focus to include additional key security language is routinely used across DevSecOps teams and organizations.  

We know not everyone in an organization is a security expert; this lexicon is intended to help organizations clearly understand DevSecOps terminology.

Container Security Terminology Guide

Audit

An audit is a periodic exercise to review and judge the state of a software project. Audits can be performed against internal policies or external standards and may be conducted by internal security teams or by outside specialists.

Center for International Security (CIS)

The CIS is a nonprofit organization with a mission is to “identify, develop, validate, promote, and sustain best practice solutions for cyber defense.” CIS publishes a collection of benchmarks and controls that form the basis for many industry-standard security policies.

Common Vulnerabilities and Exposures (CVE)

The CVE is a system for standardizing documentation and reference to security issues. Many devs might gather feedback from a security tool that finds CVE’s attached to packages or libraries related to their application(s). Not every CVE needs to be remediated. In fact, there will always be some false positives that slip through the cracks. Track the false positives, remediate applicable high/critical vulnerabilities, and try to burn down vulnerabilities that are older. 

Common Vulnerability Scoring System (CVSS)

The CVSS is an industry-standard method for evaluating vulnerabilities and assigning severity scores to them. These scores are often included in vulnerability feeds and can be used by security teams to control thresholds for approving software. For example, organizations could create a benchmark where they only approve containers that contain no vulnerabilities that violate a CVSS impact and exploitability score of a 7.5. CVSS scoring is also a good compass to guide which CVE’s are more critical than others and can be used by teams to prioritize what needs fixing first within their builds.

License

Open-source software projects use a variety of different software licenses with different conditions for use and distribution of derivative software. Some licenses may be incompatible with each other or may have conditions that are incompatible with corporate policies.  

NIST (National Institute of Standards and Technology)  

NIST publishes widely-regarded security standards such as NIST 800-180 and maintains the National Vulnerability Database.

NVD (National Vulnerability Database)

NVD is a database of known vulnerabilities, mitigations, and vendor comments, maintained by NIST and freely distributed via a collection of feeds.

Policy

Policy is a set of rules that are used to perform an evaluation of a container image. Rules can, in theory, examine any aspect of the examined images. Commonly rules look at known CVEs contained in the image, ports exposed by the image, packages installed in the image, or even metadata such as the on-disk size of the image.

Scanning

Scanning is the process of examining container images, inventorying the contents, and applying policy/rules. The output of the scanning process is a judgment on whether the image complies with the selected policies or not, and that judgment can be used to provide feedback to developers, make decisions about the promotion of an image from a lower environment to a higher one, or even to prevent deployment of an image into a cluster.

Shift Left

A central practice in DevSecOps, shift left is essentially the complete integration of security and development. The result is a more robust testing, more efficient use of manpower and computing resources, faster delivery and fewer unplanned delays. It’s important to use a competent security tool that provides developers with fidelity and granularity of security issues related to their builds so that they can fix and ultimately deploy much faster.  

Vulnerability Feeds

Vulnerability feeds deliver information about vulnerabilities via machine-readable format (often JSON, RSS, or other industry-standard formats) suitable for automatic consumption by security tools. Feeds serve as the backbone when identifying vulnerabilities. This allows scanning tools like Anchore to decompose images, analyze the packages that compose an image, and perform matching against packages to the CVE’s published against said packages. Being able to loop this into a Gitlab or Jenkins job is critical for teams focusing on building quickly. Integrate vulnerability scanning with your SCM so scanning is done regularly against code in your source repository.

Combined with the topics discussed in part 1 of our container security lexicon, you now have a clear understanding of core security terminology and you’re ready to begin your DevSecOps journey.

A Container Security Terminology Guide For Better Communication

Many enterprises often find themselves sifting through guidance, compliance regulations, and requirements as organizations set out on their DevSecOps journey. Sifting through all of the key terminology and understanding how each key item intricately interacts with other key components can be overwhelming for developers who may be in the beginning stages of their journey. To help, Anchore has created a shift left lexicon to help you gain a clear understanding of the key phrases and terminology used in DevSecOps.

Container Security Terminology Guide

Containers

Let’s start with a container. A container is a collection of processes along with constraints on what resources the container can access and isolate from other activities on the system. Multiple containers can then be run on top of the same host so that they can all share the host OS kernel with one another. The best way to understand containers is to look at container images and see how container images are consumed by a registry and deployed on Kubernetes.

Container Images

Container images are templates for the creation of containers and contain all of the source code, dependencies, licenses, metadata, libraries and supporting files needed for an application to run. Images are (usually) defined by a Dockerfile, which allows for them to be reproducibly built from defined base images, source code, and build instructions.

Registry

A registry is a storage system for images. Different images are stored in individual repositories in the registry, and in the repository, different versions of the image can be denoted with tags. Some registries are public and anyone can anonymously pull images, while others are private and require authentication. Many public registries also offer the ability to mark individual repositories as private:

docker.io/alpine:latest

Registry: docker.io 

Repository: alpine

Tag: latest

Registries are useful in DevOps workflows because in general the container images will be built in one environment but will run in production in a different environment. The registry is a centralized hub: automation can direct worker nodes in the build farm to push completed images into the registry, and worker nodes in the production environment can pull the latest vetted version of an image when it’s time to execute.

Kubernetes

Kubernetes is an industry-standard container orchestration platform. This simply means that it keeps track of containers across a cluster of worker nodes, which can be as small as a single system on a developer’s desk or scale up to hundreds or thousands of nodes, across multiple datacenters and cloud providers.  There are other container orchestrators but all major vendors have standardized on Kubernetes and many practitioners use “orchestration” and “Kubernetes” interchangeably.

Continuous Integration (CI)

Continuous Integration (CI) refers to the automated building of software on a continual basis as changes are checked in by developers. This generally means that developers are making a steady stream of small changes rather than the more traditional method of committing changes in huge but infrequent batches. As the changes come in, the CI tooling will automatically integrate the changes into the codebase, coordinating the efforts of multiple developers on the team.

Continuous Delivery (CD)

Continuous Delivery (CD) is a complimentary automation technique, which takes the software artifacts produced by the CI tooling and delivers them to the next location. In some cases, this may mean submitting recently checked-in code to automated testing processes, or it could move finished and tested code from a QA environment to a production environment.

A fully automated set of tooling to integrate changes, apply testing (including security checks), and move code to production is often referred to as a CI/CD Pipeline.

These are only a few key terms that are very important in gaining a foundational understanding of core concepts embedded within DevSecOps methodology. Stay tuned for part two of our shift left lexicon where we’ll dive deeper into container security terminology.

Introducing Anchore Enterprise 2.4

Today, we are pleased to announce the GA of Anchore Enterprise 2.4. In keeping with previous releases in the 2.x series, version 2.4 has been heavily driven by customer requests both in terms of features and operational improvements. Without further ado, let’s go into the main enhancements.

Base Image Comparison

It is common for teams to standardize around a base OS image upon which application teams then layer their specific content. With our new base image comparison feature, application teams can see which security issues or vulnerabilities have been introduced by their code or dependencies and are therefore their responsibility versus the owner of the base image. More importantly, it also allows the base image owner to see what issues they can resolve across multiple applications by addressing issues in the base image. Given that a few judicious upgrades of libraries in a base image can resolve a huge swathe of vulnerabilities, this feature ensures that it is easy to find steps that have the most impact with the fewest number of steps. 

Malware Detection

Despite the rise of more modern malware like cryptomining trojans, traditional viruses still continue to affect software via the software supply chain. Anchore will now scan for viruses in binaries against a database of known signatures as part of our deep image inspection. A rule can be created in our policy engine that generates a “warn” or “stop” if a virus is detected. This allows you to do your virus scans as part of CI/CD as well for scanning existing content in a registry. 

Hint File

When Anchore analyzes an image, it looks at package indexes, names of files and other metadata to generate matches with vulnerability information. Sometimes this information is not discoverable, either because it is missing or not discoverable. A good example is with Go, the popular programming language, where libraries are compiled in. Using a hint file, which is detected within the image itself, developers can explicitly enumerate dependencies they have used which Anchore will use to generate vulnerabilities. This feature is best used where the creation of the hint file is formalized as part of the development process. In addition, we have added Go as a type (in both the API and UI) in the Anchore system so vulnerabilities can be explicitly related to the language. 

Fair Queuing

As long term admins of Anchore will be aware, every now and then a user will add a repository that contains 1000s of tags, each containing hundreds of images. Previously, our queuing system worked on a first-in-first-out (FIFO) basis which meant that when a large repo was added, it could block other users with more urgent requests. With the new fair queueing algorithm in 2.4, the system will ensure that each account or tenant in the system gets equal processing time, with one image being processed for each account at a time in a round-robin fashion. 

Bulk Image Deletion API

It is common for the size of the Anchore database to grow over time as users add more and more repos. Many of the images that get scanned, do not need to be retained by the system as they are test or scratch images. Previously, it required an API call per image to delete them from the database with users writing scripts to iteratively call the API to delete multiple images. With the new bulk API, a user can submit a list of repos/images that should be deleted in bulk, asynchronous to the API call. 

And Finally

Many additional features and improvements have gone into the graphical user interface, most notably, users will now see a “What’s New” popup after their administrators have upgraded the system. This will introduce them to the new features listed above and other areas of change. 

Many thanks to the customers who provided feedback and testing on our new features. We’re keen to hear feedback from prospective or existing customers on our Discourse forum about this release and to receive feedback for the next one.

And finally, a huge thanks to the engineering team for keeping the momentum on our product releases even during the pandemic. 

Watch the Anchore Enterprise 2.4 Video

Please bookmark our product release page to see videos on all Anchore Enterprise releases, past, current and future as we announce them. 

Container Security in Helm Charts for DevOps Teams

What is Helm?

In very basic terms, Helm is a package manager for Kubernetes that makes it easy to take applications and services that are highly repeatable and scalable and deploy them to a Kubernetes cluster. Helm deploys applications using charts, which are essentially the final packaged artifact; a complete collection of files describing the set of Kubernetes resources required to deploy the application successfully. By far the most popular way to manage Kubernetes applications and releases, Helm is a graduated member of the Cloud Native Computing Foundation (CNCF), and the Helm charts repository on GitHub has more than 14,000 stars. 

Out of the box, there are major benefits to using Helm. To name a few, deployments become simpler and streamlined. Software vendors can provide a set of base defaults for an application, then developers can override or extend these settings during installation to suit the requirements for their deployments. These default configurations are often hardcoded in the deployment templates and made configurable by a values.yaml file which developers can choose to pass the chart during installation. This ease of use helps with the steep learning curve of Kubernetes. Developers don’t necessarily need to obtain a deep understanding of each Kubernetes object in order to deploy an application quickly. Finally, having a chart built and maintained by software vendors allows it to be used over and over again by a large audience, reducing duplication and complexity of customer and user releases across multiple environments. 

While the benefits described above are great, it is important to understand the risks associated with using these new artifacts. Below are two major components to consider when beginning to work with Helm charts.  

Container Images & Helm Deployments

Since Helm charts deploy Kubernetes applications, they include references to container images in the YAML manifests which then run as containers on the cluster. For many charts, there are often several images (optional or required) for the application to start. Due to this, visibility into the images that will be used with your Helm deployment via image inspection should be a mandatory step in your deployment process. For example, the MariaDB Helm chart includes a reference to the image: docker.io/bitnami/mariadb:10.3.22-debian-10-r27 in the values.yaml file.

Ordinarily, it is a good idea to check to see if this container image has any known vulnerabilities or misconfigurations that could be exploited by an attacker. This is also a good example of configuration flexibility with Helm. If I wanted to use a different image with this Helm chart, I could swap out the registry, repository, tag combination in the values.yaml, and deploy with another image. Important to be careful here though, as the deployment configuration for the applications are often software specific, so there are no guarantees that a newer version of MariaDB will work with the deployment. 

Managing the sets of images that exist across various deployments in a Kubernetes environment often involves continuous monitoring of the image workload to manage the sprawl effectively. While there is no silver bullet, integrating image inspection, enforcement, and triage into your development and delivery workflow will greatly improve your security posture and reduce the time to resolution should containerized applications become vulnerable.

Configuration Awareness For Secure Deployments

As discussed above, Helm charts contain Kubernetes YAML manifest files, which describe the properties and characteristics of the Kubernetes objects that will then be deployed on the cluster. There are many defaults within these files which can be overridden upon deployment of the Helm chart via the values.yaml file or inline. It is very easy to deploy an application without CPU or memory limits set, without security contexts, or a container running with SYS_ADMIN capabilities, or in privileged mode. 

Quite often, there are optional configurations documented in Helm charts which can greatly enhance the security of the deployment. It is not uncharacteristic for the basic Helm deployment to focus on “getting the software up and running” and not necessarily a default secure deployment. Without getting too involved in the intricacies of Kubernetes and runtime security, it is important to understand exactly what Helm is doing behind the scenes with regards to the application you are deploying, and what tweaks you can provide the configuration for the Kubernetes objects to secure your deployment. 

In a similar vein, there are oftentimes application-specific configurations that are not always obvious or available for modification via the values.yaml file. I highly recommend taking a look at the deployment templates, configmaps, etc. just to ensure you are deploying the application the right way for your security needs.

Last, but certainly not least, once you’ve deployed your applications in a Kubernetes environment, appropriate measures need to be taken to enforce and monitor for malicious activity, network anomalies, container escapes, etc. These are separate sets of challenges than managing deployment and configuration artifacts in a build workflow and often require tools designed specifically for forensics and monitoring of a runtime environment.  

Conclusion

The benefits of using Helm are easy to see, and many developers can get started quickly by deploying containerized applications to Kubernetes with just a simple “helm install.” However, with any tool that includes a significant amount of abstraction to reduce deployment complexity, taking a methodical approach to understanding the nuts and bolts of what is going on behind the scenes is a recommended security practice to undertake. With the basic tips above, hopefully, you can be well on your way to understanding a bit more able Helm, so you can deploy Kubernetes applications securely.

3 Best Practices for Detecting Attack Vectors on Kubernetes Containers

In recent years, the adoption of microservices and containerized architectures has continually been on the rise, with everyone from small startups to major corporations joining the push into the container world. According to VMWare, 59 percent of large organizations surveyed use Kubernetes to deploy their applications into production. As organizations move towards deploying containers in production, keeping security at the forefront of development becomes more critical because while containers ideally are immutable, they are just another application exposed to security vulnerabilities. The potential impact of a compromise of the underlying container orchestrator can be massive, making securing your applications one of the most important aspects of deployment. 

Securing Infrastructure

Securing the underlying infrastructure that Kubernetes runs on is just as important as securing the servers that run traditional applications. There are many security guides available, but keeping the following three points in mind is a great place to start.

  • Secure and configure the underlying host. Checking your configuration against CIS Benchmarks is recommended as CIS Benchmarks provide clear sets of standards for configuring everything from operating systems to cloud infrastructure.
  • Minimize administrative access to Kubernetes nodes. Restricting access to the nodes in your cluster is the basis of preventing insider threats and reducing the ability to elevate commands for malicious users. Most debugging and other tasks can typically be handled without directly accessing the node.
  • Control network access to sensitive ports. Ensuring that your network limits access to commonly known ports, such as port 22 for SSH access or ports 10250 and 10255 used by Kubelet, restricts access to your network and limits the attack surface for malicious users. Using Security Groups (AWS), Firewall Rules (GCP), and Azure Firewall (Azure) are simple, straightforward ways to control access to your network resources.
  • Rotate infrastructure access credentials frequently. Setting shorter lifetimes on secrets, keys, or access credentials makes it more difficult for an attacker to make use of that credential. Following recommended credential rotation schedules greatly reduces the ability of an attacker to gain access.

Securing Kubernetes

Ensuring the configuration of Kubernetes and any secrets is another critical component to securing your organization’s operational infrastructure. Here are some helpful tips to focus on when deploying to Kubernetes.

  • Encrypt secrets at rest. Kubernetes uses an etcd database to store any information accessible via the Kubernetes API such as secrets and ConfigMaps; essentially the actual and desired state of the entire system. Encrypting this area helps protect the entire system.
  • Enable audit logging. Kubernetes clusters have the option to enable audit logging, keeping a chronological record of calls made to the API. They can be useful for investigating suspicious API requests, for collecting statistics, or for creating monitoring alerts for unwanted API calls.
  • Control the privileges containers are allowed. Limiting access to a container is crucial to prevent privilege escalation. Kubernetes includes pod security policies that can be used to enforce privileges. Container applications should be written to run as a non-root user, and administrators should use a restrictive pod security policy to prevent applications from escaping their container.
  • Control access to the Kubelet. A Kubelet’s HTTPS endpoint exposes APIs which give access to data of varying sensitivity, and allow you to perform operations with varying levels of power on the node and within containers. By default, Kubelet allows unauthorized access to the API, so securing it is recommended for production environments.
  • Enable TLS for all API traffic. Kubernetes expects all API communication within the cluster to be encrypted by TLS, and while the Kubernetes APIs and most installation methods encrypt this by default, API communication in deployed applications may not be encrypted. Administrators should pay close attention to any applications that communicate over unencrypted API calls as they are exposed to potential attacks.
  • Control which nodes pods can access. Kubernetes does not restrict pod scheduling on nodes by default, but it is a best practice to leverage Kubernetes’ in-depth pod placement policies, including labels, nodeSelector, and affinity/anti-affinity rules.

Securing Containerized Applications

Aside from how it is deployed, an application that runs in a container is subject to the same vulnerabilities as running it outside a container. At Anchore, we focus on helping identify which vulnerabilities apply to your containerized applications, and the following are some of many key takeaways that we’ve learned.

  • Scan early, scan often. Shifting security left in the DevSecOps pipeline helps organizations identify potential vulnerabilities early in the process. Shift Left with a Real World Guide to DevSecOps walks you through the benefits of moving security earlier in the DevSecOps workflow.
  • Incorporate vulnerability analysis into CI/CD. Several of our blog posts cover integrating Anchore with CI/CD build pipelines. We also have documentation on integrating with some of the more widely used CI/CD build tools.
  • Multi-staged builds to keep software compilation out of runtime. Take a look at our blog post on Cryptocurrency Mining Attacks for some information on how Anchore can help prevent vulnerabilities and how multi-stage builds come into play.

With the shift towards containerized production deployments, it is important to understand how security plays a role in each level of the infrastructure; from the underlying hosts to the container orchestration platform, and finally to the container itself. By keeping these guidelines in mind, the focus on security shifts from being an afterthought to being included in every step of the DevSecOps workflow.

Need a better solution for managing container vulnerabilities? Anchore’s Kubernetes vulnerability scanning can help.

Cybersecurity & Container Security, Forecasting Organization Adoption to Minimize Threats

The use of containers is growing rapidly and for good reason. Compared to traditional, monolithic applications, containers offer many great benefits: faster delivery, elasticity, portability—the list goes on. In a recent press release, Gartner predicted by 2022, more than 75 percent of global organizations will be running containerized applications in production and by 2024, container management revenue will reach $944 million.

Despite this exciting growth, containers are still vulnerable to cyberattacks. According to a Tripwire survey, 60 percent of enterprises running containers suffered a container security incident in 2018. Additionally, a recent StackRox survey involving IT and security professionals found that 94 percent of respondents encountered a security incident in the past year related to containers or Kubernetes. Without proper security measures in place, your container management environment could suffer from container security incidents too. 

To minimize your attack surface, you should know the exact contents and vulnerabilities of your containerized applications before running them in production. By first identifying threats and vulnerabilities, you can begin to enforce policies and achieve the desired level of security and compliance. 

Application & Insider Threat Checks

For example, a developer has been tasked with creating a custom-built container that utilizes a popular database server. The security team has required that this database server be configured using a specific version with TLS and authentication enabled. What can be done to ensure these requirements are fulfilled?

Anchore provides users with the ability to create policy-as-code. A user can create a simple JSON policy that checks for application-level configuration such as a specific package version or a required configuration option. A policy can then be enforced by user-defined actions that could fail a pipeline stage or prevent the container from being deployed. Implementing both accidental and malicious insider threat checks is one of the first things your organization can do to mitigate container security risks.

Ports, Permissions & Private Data Checks

In addition to checking for files, packages, and software artifacts, a container security solution should also check for ports, permissions, and private data. Similar to how AWS Macie checks for personal identifiable information (PII) in an S3 bucket, container security software should provide users with automatic checks for exposed ports, insecure permissions, secrets, passwords, licenses, keys, and other metadata. Whether the information was mistakenly added or left behind during testing, checks of this nature are essential in achieving levels of compliance and preventing bad actors from acquiring privileged access or sensitive data.

Vulnerability Checks

There are many container scanning tools on the market that check for common vulnerabilities and exposures (CVE). However, scanning the same container image with two separate tools will always yield different results. With the variety of public security advisories available today, it is important your organization chooses a container scanning solution that utilizes a comprehensive set of feed sources and is able to identify every software package installed in the container. 

As a developer myself, I know that we will install any packages necessary to get a job done. Nonetheless, your security team may want to block a risky package from being used or discover that there is an upstream patch available for a package. Knowing which CVE corresponds to which package and ensuring that the minimum required packages are installed in a container is critical while your security team researches, evaluates and minimizes risk. 

In this blog, we acknowledged that the increased use of containers among global organizations requires an increased focus on cybersecurity. We’ve also seen a few reasons why Fortune 100 companies and government agencies around the world trust Anchore for their cloud-native environments. By implementing the right tools and policies, your organization can prevent threats and vulnerabilities as well as achieve desired levels of security and compliance, saving time and money prior to runtime.

DevSecOps & Department of Defense, Separating Agile Hype From Legitimate Practice

Agile software development has become a tried and true practice for delivering high quality and effective software in the modern age. Due to its effectiveness, agile development is not only being used by tech companies; it has also been picked up by the Department of Defense (DoD). With the advancement of technology to the forefront of the battlefield, the DoD has embraced the need to get effective software tools into the hands of the warfighters quickly and efficiently.

With all the excitement surrounding agile, there are bound to be groups who claim to be agile while not actually following the agile methodology. In order to counteract this, the DoD has invested time and effort in identifying the indicators of who is faking agile practices. This effort ensures that software developed in the DoD is cutting edge and truly useful to the warfighter. The Defense Innovation Board has created a document that highlights some of their findings for those wanting more detail.

Even though emphasis has been placed on moving quickly while developing software, the Department of Defense cannot compromise the security of their products. This is where DevSecOps comes in. The U.S. government has adopted a DevSecOps approach to its software development, putting an emphasis on speed and automation while also not compromising security. Groups like Platform 1 have been pioneering what it means to implement agile and DevSecOps in the government space, providing hardened environments to software developers that allow them to quickly develop software that serves a mission without compromising security.

The benefits of modernizing development practices are usually described in concrete terms; increased productivity (faster delivery, decreased maintenance), increased resilience (fewer and shorter outages with a lower cost of issue resolution). Going to the next step and integrating security teams by using a DevSecOps approach provides even further benefits. Security issues that would require an entire cycle to resolve in a traditional workflow can be resolved earlier (and hence, faster) and the resulting software in production becomes more robust.

The crucial concept here is that integrating security into the development and deployment of your apps at every stage, rather than treating security as an outside process that is imposed upon your production environment at the end of the pipeline, will pay massive dividends. Good security practices evolve over time, and DevSecOps approaches are quickly becoming understood as the new standard for not only modern enterprise applications but the Department of Defense as well. With the ever-changing software landscape that faces us today, it is crucial that software is delivered quickly, effectively and securely.

Anchore Integration With Azure DevOps Has Officially Arrived

Anchore is excited to announce the official release of our integration with Azure DevOps. Azure DevOps is a powerful tool from Microsoft that allows developers to build and release production software. This integration with Anchore allows developers to seamlessly integrate security into their Azure DevOps pipelines with very little effort.

Anchore’s robust scanning brings not only vulnerability detection but policy enforcement for any application. All you need to do is add some simple YAML to your existing pipeline to create secure production software. Once the extension is installed into your organization, follow the steps below to get it added to any pipeline.

Step 1. Review the Existing Build and Release Pipeline

trigger:
  - master
  - dev

variables:
  image_name: "localbuild/testimage"
  tag: "ci"

stages:
- stage: Build
  displayName: Build application container
  jobs:
  - job: Build
    displayName: Docker Build
    steps:

     - task: Docker@2
      inputs:
        command: build
        repository: "$(image_name)"
        tags: "$(tag)"

- stage: Release
  displayName: Release the application
  ...

Right now this pipeline is simply using the Docker task to build a local container and then it will publish the container in the release stage (omitted for simplicity).

Step 2. Add the Anchore Scanner Plugin

The Anchore scanner will scan a locally built container so it can provide a decision point early in the pipeline. All that needs to happen is add the Anchore scanner plugin to the pipeline right after the build stage so it can scan the local image.

trigger:
  - master
  - dev

variables:
  image_name: "localbuild/testimage"
  tag: "ci"

stages:
- stage: Build
  displayName: Build and scan with Anchore
  jobs:
  - job: Build
    displayName: Build and Scan
    steps:

    - task: Docker@2
      inputs:
        command: build
        repository: "$(image_name)"
        tags: "$(tag)"

    - task: Anchore@0
      inputs:
        image: "$(image_name):$(tag)"
        customPolicyPath: ".anchore/policy.json"
        dockerfile: Dockerfile

    - script: |
        echo $(policyStatus)
        echo $(billOfMaterials)
        cat $(billOfMaterials)
        echo $(vulnerabilities)
        cat $(vulnerabilities)
      displayName: Print scan artifacts

In this example, a custom policy is provided alongside the code and it is referenced inside the scan so it can enforce the security required for production software.

Step 3. Run the Pipeline

Run the pipeline like normal and watch Anchore do its work scanning the local image. Once Anchore has scanned the image, the results of the policy evaluation will be displayed in the terminal along with a table of the discovered vulnerabilities. You can also reference the outputs of Anchore as pipeline variables so you can keep the scan results or policy evaluation in a database for further inspection.

Anchore pipeline task for Microsoft Azure DevOps has arrived.

Step 4. Customize the Extension

The extension can be customized fully to fit the needs of the pipeline, just reference the documentation on the extension page for more in-depth detail about the input parameters. It also does not require access to Anchore Engine or Enterprise. The plugin comes with all the capabilities of Anchore wrapped inside of it including ways to provide custom policies and change the behavior of the pipeline based on results.

Azure DevOps is a powerful tool used by many development teams to build and publish production-grade software. With the integration of Anchore into the Azure DevOps environment, producing secure software becomes even more reliable. Anchore enforces consistent security policy for every run of the pipeline and will ensure that software that is not secure never makes it to production.

Cloud Native Security For DevOps, Applying The 4 C’s As Security Best Practice

The past decade has seen a massive surge in terms of “cloud” technologies. What used to require on-premises hardware that took up large amounts of space, power and talent to operate efficiently, now can be operated by a small number of DevOps engineers and scaled up or down to meet demand and performance requirements. These new approaches to software deployment have fostered the cloud native principle which centers around the deployment of applications via containers. This new, sweeping technology has brought with it numerous benefits and many more considerations. And perhaps the most important consideration is security. 

What are the Four C’s of Cloud Native Security?

The concept of cloud native security is best expressed as four building blocks sometimes referred to as the four C’s: cloud, clusters, containers and code.

Cloud

The cloud is the base of the security layers. Developers cannot simply configure application security at the code level so steps must be taken at the cloud level. Each provider (Azure, GCP, AWS, DigitalOcean, etc.) all make recommendations for running secure workloads in their environments. 

Cluster

The next layer is the cluster layer. Kubernetes is the standard orchestration software. A cluster is considered secure when both the configurable components within the cluster and the software running in the cluster are secured. 

Container Security

And following the cluster layer is the container security layer, which is the most critical part of application deployment security which we will discuss in-depth later. 

Code

The final C is code. Building security into an application’s code is a part of the principle of shifting left or making application security a priority earlier in the application development lifecycle, which in the case of code, is as early as possible.

A Kubernetes diagram showing layered approach cloud native security
Image source: Kubernetes.io

Container Security & Vulnerabilities

With the speed of adopting containers as the preferred deployment method, security is a large concern. A Tripwire study found that 60 percent of organizations experienced a container security incident and in this study, 94 percent of participating companies said that they had container security concerns. Each container is a virtual machine running imperfect software that may contain multiple vulnerabilities that the development team may be unaware of. When you consider that a large organization may be running hundreds or even thousands of containers in production, you begin to have a measure of the large amount of compounded risk that can exist inside a highly containerized infrastructure.

The good news for development teams is that lots of work is happening in the area of container security in terms of establishing new best-practices and new technologies. Red Hat, Microsoft and many other vendors who publish common containers also publish CVE (common vulnerabilities and exposures) information ranked by severity. These findings show engineers the severity of the vulnerabilities that are present in packages in their containers so they can be mitigated before making their way to production. 

This standardization of vulnerability findings has helped DevOps engineers to automate the entire security process. Before, humans needed to comb through code to find security threats and issues, but now scanning for these issues can become a stage in any code delivery pipeline allowing companies to deliver secure code faster than ever. 

With the rapid adoption of containerization as the preferred software deployment choice, ensuring that those containers remain secure is one of the most important things that DevOps engineers can do to provide value to a company and one of the most important things companies can invest in to bring peace of mind to their users and anyone else who holds a stake in that software.

Shift Left With A Real World Guide To DevSecOps

A Free Resource: Shifting Security Left, A Real World Guide To DevSecOps

Taking your team from DevOps to a DevSecOps approach brings different functions together to achieve better business outcomes, as well as reduce workload fatigue. Alignment across developer, security and operations disciplines depends more on implementing a culture of collaboration that embraces the talent and skillsets of all team members and less on introducing new technologies.

In this new 24-page white paper, organizations will get real-world guidance and information to improve their current team structure by shifting security left to support a DevSecOps model. You’ll learn how to:

  • Build an effective and collaborative shift left strategy, while achieving significant advantages across developer, security and operation teams.
  • Recognize team strengths and core skillsets to enable focus, encourage domain expertise and minimize overall interruptions.
  • Strengthen security strategy adoption to improve productivity, increase effective collaboration and overcome common challenges.

An exploration of the history of shift left and how changing the development process from a layer placed on top of code to one that integrated in code is shared along with the recognized benefits afforded to organizations that adopt a DevSecOps approach. From planning and the software development cycle to automation and continuous integration, a pragmatic and comprehensive overview is provided to make more informed decisions before embarking on a DevSecOps journey.

As a working practice inspired by and promulgated by developers, DevSecOps is quickly becoming the next DevOps. There is a confluence of tooling, appetite and mindshare that is pushing security into the fray and DevSecOps is quickly becoming more prominent as a rapidly growing practice across organizations small and large.

Shifting security left has the capability to make developers allies

of security, giving them the information they need as early as

possible within the development feedback loop, and allowing

them to identify issues early and rectify them before the code

leaves development.

This guide aims to empower organizations and their developers by delving into policy as code and establishing workflows that are able to deliver secure software faster and more efficiently.

To learn more about shifting security left and to access this DevSecOps blueprint, please visit Shifting Security Left, A Real Guide To DevSecOps and download for free.

The Open Source Economy & Modernizing Security To Reduce Vulnerability Risk

In February 2020, the Linux Foundation released a report titled “Vulnerabilities in the Core,” a detailed analysis of the usage and security implications of open source software across the computing landscape. In today’s blog post, we will discuss some of the findings contained in the report, and explore how it pertains to the field of DevSecOps.

By now, the advantages of open source software are well understood throughout the industry. Software development teams can achieve faster delivery times and reduce costs by building on top of existing open source software components that are available for anyone to use. In the age of faster development cycles and continuous integration, it is often essential to incorporate open source technologies into the development stream in order to achieve and maintain the engineering velocity required for success.

However, the report demonstrates that open source software is not immune to the security considerations that affect non-open source software. In fact, the decentralized nature of the open source development model poses some unique security challenges, such as widespread use of outdated versions and exposure to known security vulnerabilities that go undetected and unpatched.

So, how best to leverage the benefits from open source building blocks while protecting your organization from some of the risks and vulnerabilities? And how to do that in a way that does not slow down your development velocity? Let’s explore.

A Simple Build For Container Environments

First, embrace the use of a container as the runtime environment for your application. Take a minimalist approach to the construction of the container, so that only the open source packages which your application requires are included. This will limit the number of potential vulnerabilities that the container may be exposed to. You will want to ensure that these open source packages are kept up to date over time.

Container Image Scanning Automation

Secondly, incorporate an automated container scanning tool that is integrated into your software development process. This is where Anchore Enterprise can help. 

Anchore Enterprise plugs into your CI/CD pipeline so that each container is scanned according to a set of policies that you control, and this scanning is done in a way that is not only automated, it is done before the application’s container is deployed into a production environment. Incorporating the hardening process into the development cycle is the defining element of what we mean by DevSecOps.

Anchore Enterprise conducts a deep inspection of the container and scans package versions against several vulnerability databases such as VulnDB and NVD. This mechanism ensures that your application’s container will not be exposed to any known security vulnerabilities at the time when it goes into production.

Security Measures For Outdated Open Source

But what about outdated versions of open source packages? Anchore Enterprise allows additional controls to be set so that the policies can be fine-tuned to your organization’s requirements. For example, certain packages or package versions can be explicitly prohibited from inclusion into the production environment via use of the policy blacklist. In this manner, you could ensure that outdated versions of open source packages could trigger a stop-build event, not because there are any known vulnerabilities but simply because those package versions are outdated and unmaintained.

Perhaps most importantly, these security-enhancing mechanisms are performed in a highly automated manner, so that each of the open source components in your development stack are scanned and validated according to the policy automatically every time your application is built. 

As a result, your software development teams can take advantage of the compelling advantages that these technologies have to offer, while also providing an automated, low-friction way of guarding against the risks inherent with the decentralized open source development model.

Jenkins at Scale With Anchore Vulnerability Scanning & Compliance

In this blog, we’ll see how we can configure Jenkins on our Kubernetes clusters to scale on-demand, allowing for hundreds or thousands of pipeline jobs per day. Additionally, we’ll see how easy it is to incorporate Anchore vulnerability scanning and compliance into these pipelines to make sure we aren’t deploying or pushing insecure containers into our environments. In this example, we are using Amazon’s EKS, but the same steps can be performed on any Kubernetes cluster.

Requirements:

Step 1: Configure

First, we need to create a Jenkins deployment, load balancer service, cluster IP service and cluster role binding. To make things simple, we can apply this jenkins-deploy.yaml file which uses the latest Jenkins image from DockerHub.

kubectl apply -f jenkins-deploy.yaml

Run a kubectl get for the jenkins-lb service that was created for us and navigate to the EXTERNAL-IP from your browser. You will now be at the Jenkins UI (keep in mind it can take some time for a load balancer to be provisioned and become active).

kubectl get svc jenkins-lb
NAME       TYPE         CLUSTER-IP    EXTERNAL-IP
jenkins-lb LoadBalancer 10.100.141.50 aaaceb153e97241fab81d9d4109440c-1811878998 .us-east-2.elb.amazon.com

Now that we are at the Jenkins UI, go to Manage Jenkins > Configure Global Security, check the “Enable proxy compatibility” box under CSRF Protection and click “Save.” Checking this box allows us to fix an extremely annoying crumb error.

Once that’s complete, we can go to Manage Jenkins > Manage Nodes and Clouds and click the gear icon on the far right of the master node row. Set the “# of executors” to zero and click “Save.” The master instance should only be in charge of scheduling build jobs, distributing the jobs to agents for execution, monitoring the agents and getting the build results. So, since we don’t want our master instance to execute builds, we are setting the executors to zero.

Integrating Anchore Vulnerability Scanning and Compliance and Jenkins to Manage Node Clusters

From Manage Jenkins > Manage Plugins, install the Anchore Container Image Scanner plugin, Kubernetes plugin and Pipeline plugin. Once those have installed, go to Manage Jenkins > Configure System and scroll down to the Anchore Container Image Scanner settings. Find the “Engine URL” using kubectl describe for the Anchore Engine API pod and enter your Engine Username and Engine Password (default Username: admin; default Password: foobar; default port: 8228), then click “Save.” Don’t forget the http:// and /v1.

Integrating Anchore Vulnerability Scanning and Compliance and Using kubectl

Integrating Anchore Vulnerability Scanning and Compliance and Configure Jenkins Plugin

Now go to Credentials > System > Global credentials (unrestricted) > Add Credentials, add a “Kubernetes Service Account” credential, and click “OK”. This will allow the Jenkins Kubernetes plugin to manage pods in the default namespace of the cluster using the cluster role binding that we created earlier:

Integrating Anchore Vulnerability Scanning and Compliance and Adding Kubernetes Service Account Credentials in Jenkins

Next, we need to configure the Kubernetes plugin. Go to Manage Jenkins > Manage Nodes and Clouds > Configure Clouds and add a Kubernetes Cloud. If you’re using EKS, retrieve the API server endpoint from the AWS EKS cluster dashboard and paste it into the “Kubernetes URL” field (other platforms may have different names or locations for the API server endpoint). Add the Kubernetes Service Account credential we just created, test your connection, and enter the Jenkins URL using kubectl describe for the Jenkins Master pod that was created for us earlier. Don’t forget the http:// and :8080.

Integrating Anchore Vulnerability Scanning and Compliance and Using kubectl

Integrating Anchore vulnerability scanning and compliance with Jenkins

Below that, we must create a Pod Template for our Jenkins Agents. Enter a Name and Label, set the Usage to “Use this node as much as possible,” create a Container Template using the Docker image jenkins/inbount-agent, then click “Save.”

Integrating Anchore Vulnerability Scanning and Compliance with Jenkins Pod Template

We now have our Jenkins Master running, Anchore plugin configured and Kubernetes plugin configured. All that’s left to do is create our pipeline jobs and test!

Step 2: Test

Create a pipeline job and scroll down to its Pipeline configuration settings. Paste the contents from this Jenkinsfile into the Pipeline script, uncheck the “Use Groovy Sandbox” box, and click “Save.” A traditional Jenkinsfile may involve building an image, running QA tests, scanning with Anchore and then pushing to a registry, but for this example, we’re just showing the “Analyze with Anchore plugin” stage.

Integrating Anchore Vulnerability Scanning and Compliance with Jenkins Pipeline Configuration

Create some more copies of this pipeline job using any images you want. A typical workflow may involve triggering these pipelines from a git push or merge request, but we’ll just trigger them manually for the sake of testing by using the clock icon on the far right of each item’s row. We’ll see our jobs in the build queue and our Jenkins Agents spinning up in the build executor status.

Integrating Anchore Vulnerability Scanning and Compliance and Jenkins Pipeline Copies in Queue

If we watch our pods, we’ll see the Jenkins Agents pending, creating, running our pipeline and then terminating.

Integrating Anchore Vulnerability Scanning and Compliance and Jenkins Agents Running and Terminating

If we take a look at our test2 pipeline and select the newly-created “Anchore Report,” we can see that httpd:latest was analyzed and the result was fail due to eight high vulnerability CVEs (common vulnerabilities and exposures).

Integrating Anchore Vulnerability Scanning and Compliance with Anchore Policy Evaluation Report

Conclusion

We now have the ability within our cluster to dynamically scale Jenkins Agents to run our pipeline jobs. We’ve also seen how to integrate Anchore into these pipeline jobs to analyze containers and prevent non-compliant ones from entering our production environment.

Cryptocurrency Mining Attacks & Anchore Scanning, A Line of Defense

Cryptocurrency Mining Attacks Shifting Left

Recently, there has been a flurry of cryptocurrency mining attacks hitting various entities around the globe ranging from celebrity Twitter accounts to customers running workloads across Kubernetes clusters.

For today, we’ll ignore the celebrity accounts and focus on how Anchore can be used to protect your organization from cryptomining attacks. Back in April, Microsoft did an excellent job providing details into one of these attacks that leveraged a specific cryptomining image that currently has more than 10 million pulls on Docker Hub!

The central premise is straightforward, “Allow only trusted images: Enforce deployment of only trusted containers, from trusted registries.” But what happens when using trusted images isn’t enough? First, let’s set up a list of trusted images using Anchore, explore why whitelisting/blacklisting images is a good start to protecting your organization and then discuss how Anchore can amplify your security by creating STOP actions in your CI/CD pipeline using in-depth inspection of the container image itself.

Whitelisting/Blacklisting Cryptocurrency Mining Images

To cover all of the bases, let’s start by building out a thorough blacklist of some commonly used mining images you can find on Docker Hub. Using Anchore Enterprise, navigate to Policy Bundles > Whitelist/Blacklist Images. From here you can add the specific image you would like to blacklist. In the end, you might have something that looks like this:

Blacklist Commonly Used Crpto Mining Images

Additionally, let’s add your approved images to the whitelist. Building off a set of approved and hardened images is a very healthy development practice for teams to adopt. This way Anchore can flag any unapproved images that may be passed through your pipeline. Ultimately, whitelisting is far more powerful, but there is no harm in doubling down here. I went ahead and set up an Ubuntu image on my whitelist below:

Anchore Whitelisting and Blacklisting Images

This is effective because it will prevent one attack scenario, which is an attacker pulling down any of the hundreds of mining images from Docker Hub and running them inside your environment. However, an attacker can easily maneuver around an organization’s whitelist/blacklist. For example, an attacker could always build a custom miner using your approved base image and a series of Docker instruction commands. That is a terrible scenario for an organization to experience, but it could happen if an insider threat or attacker decides to make a few quick crypto-bucks all while using your own approved container images and K8’s infrastructure.

Monitor the Instructions in the Dockerfile

Let’s take a look at the build steps of the kannix/monero-miner image that was referenced in the Microsoft report and demonstrate how Anchore can detect a threat even if the attacker was building using an approved image or is using a non-blacklisted image.

Anchore Monitoring Instruction in the Dockerfile

This image is created in a multi-stage build, using FROM ubuntu:latest as the version. Thus, even if we had our whitelist above, the attacker could still build this image successfully using our whitelisted image FROM ubuntu:20.04. To prevent this, Anchore can monitor subsequent lines to detect a Monero mining image is being built.

Anchore Enterprise policy does just that. The second RUN command features an apt-get update and apt-get install which is prohibited in Anchore policy bundle using the Dockerfile Gate, and Instruction trigger.

Anchore Policy Bundle Prohibits apt-get install

This generates an automatic STOP action in Anchore and prevents this from moving further in your pipeline. Failing this check will prevent your image from progressing further in the selected policy bundle. For the sake of this post, let’s see what other harmful instructions generate a STOP action and alert using Anchore.

Over the next few lines, the image performs a ‘RUN git clone’ to pull down the build scripts and necessary files for xmrig. This would generate a STOP action in Anchore because it violates Anchore’s Transfer Protocol Checks that are applied to every image. As seen below, Anchore monitors the RUN, FROM, COPY and ADD instructions for external requests using HTTP, HTTPS, FTP and SFTP protocols.

Anchore's Tranfer Protocol Checks

Next, Anchore’s cryptomining checks have generated yet another STOP action because Monero already exists as a blacklisted user using the effective user check on the Dockerfile instruction as seen below.

Anchore's Crypto Mining Stop Action Blacklist

Immediately after setting the effective user, they set the working directory to /home/monero. Similar to setting the user as Monero, setting the working directory /home/monero is pretty common in Monero images. Anchore’s cryptomining checks can look for that by monitoring the Dockerfile Instruction WORKDIR as seen here:

Editing Policy Rules WORKDIR Crypto Mining Check

In the last few crypto mining checks, we can monitor for xmrig itself. I did an attribute match and name match on the file using Anchore which generated two additional stop actions.

Anchore Enterprise Crpto Mining Stop Action

Lastly, Anchore generated a check around the ENTRYPOINT [“./xmrig”].

Anchore Enterprise Entrypoint Check

After all of these checks are in place your compliance tab of Anchore Enterprise should look a bit like this:

Anchore Enterprise Compliance Tab

Conclusion

Cryptocurrency mining attacks will continue to evolve. In this post, we’ve demonstrated the flexibility of Anchore policy enforcement to provide contextualized security enforcement to the user. It’s important that organizations take steps to increase their security posture further to the left to prevent these images from being deployed into a production Kubernetes cluster.
DevSecOps is centered on the premise that security actions must run at the same speed and scale as development and operations. Tools like Anchore Enterprise provide organizations with a new line of defense by providing deep image inspection and policy-based enforcement mechanisms that monitor for security threats before they enter the development pipeline.

Troubleshooting Basic Issues with Anchore

As with any application, after deploying Anchore you may run into some common issues. In this post, we’ll walk through troubleshooting Anchore’s more common issues we’ve seen to provide you with a better understanding of their cause and how to solve them.

Verifying Services and System Health

When troubleshooting in Anchore, your first step should start with viewing the event log, then the health of Anchore services and lastly looking into the logs.

The event log subsystem provides users with a mechanism to inspect asynchronous events occurring across various Anchore services. Anchore events include periodically triggered activities such as vulnerability data feed sync in the policy_engine service, image analysis failures originating from the analyzer service and other informational or system fault events. The catalog service may also generate events for any repositories or image tags that are being watched, when Anchore Engine encounters connectivity, authentication, authorization or other errors in the process of checking for updates.

The event log is aimed at troubleshooting the most common failure scenarios (especially those that happen during asynchronous operations), and to pinpoint the reasons for failures that can be used subsequently to help with corrective actions. To view the event log using the Anchore-CLI:

`anchore-cli event list`

You can get more details about an event with:

`anchore-cli event get `

Each Anchore service has a health check and reports its status after it’s been successfully registered. To view Anchore system status using the Anchore-CLI:

`anchore-cli system status`

The output will give you a status for each Anchore service to verify that they’re up and running.

One of the most helpful tools in troubleshooting issues in Anchore is to view the logs for the respective service. Anchore services produce detailed logs that contain information about user interactions, internal processes, warnings and errors. The verbosity of the logs is controlled using the log_level setting in config.yaml (for manual installations) or the corresponding ANCHORE_LOG_LEVEL environment variable (for Docker ompose or Helm installations) for each service. The log levels are DEBUG, INFO, WARN, ERROR and FATAL, where the default is INFO. Most of the time, the default level is sufficient as the logs will contain warn, error and fatal messages as well. However, for deep troubleshooting, increasing the log level is recommended to DEBUG in order to ensure the availability of the maximum amount of information.

Anchore logs can be accessed by inspecting the Docker logs for any Anchore service container using the regular Docker logging mechanisms, which typically default to displaying to the stdout/stderr of the containers themselves, or by the standard Kubernetes logging mechanisms for pods. The logs themselves are also persisted as log files inside the Anchore service containers. You will find the service log files by executing a shell into any Anchore service container and navigating to /var/log/anchore.

For more information on where to begin with troubleshooting, take a look at our Trouble Shooting Guide.

Feed Sync

When Anchore is first deployed, it synchronizes vulnerability feed data with upstream feeds. During this process, vulnerability records are stored in the database for Anchore to use for image analysis. The initial sync can take several hours as there are hundreds of thousands of feed records, but subsequent syncs typically don’t take as long. While the feeds are syncing, it’s best to let the process completely finish before doing anything else as restarting services may interrupt the sync process, requiring it to be re-run. This is a good time to familiarize yourself with Anchore policies, the Anchore-CLI subsystem and other feature usages.

The time it takes to successfully sync feeds is largely dependent upon environmental variables such as memory and CPU allocation, disk space and network bandwidth. The policy engine logs have information regarding the feed sync, including task start and completion, records inserted into the DB or information around a failed sync. The status of the feed sync can be viewed by using the Anchore-CLI system feeds subsystem:

`anchore-cli system feeds list`

Should the sync be interrupted or one of the feeds fail to sync after all other feeds have completed a manual sync can be triggered:

`anchore-cli system feeds sync`

Feed data is a vital component for Anchore. Ensuring the data is synchronized and up-to-date is the best place to start in order to have a fully functional and accurate Anchore deployment.

Analysis Result Questions or Analysis Failing

Once your Anchore deployment is up and running, performing image analysis can sometimes lead to an image failing to analyze or questions about the analysis output around false positives. When these occur, the best place to begin is by viewing the logs. Analysis happens in the analyzer pod or container (depending on deployment method), and the logs from the API and analyzer will shed light on the root cause of a failure to analyze an image. Typically, analysis failures can be caused by invalid access credentials, timeouts on image pulls or not enough disk space (scratch space). In any case, the logs will identify the root cause.

Occasionally image analyses will contain vulnerability matches on a package that may not seem to be valid, such as a false positive. False positives are typically caused by two things:

  • Package names reused across package managers (e.g. a gem and npm package with the same name). Many data sources, like NVD, don’t provide sufficient specification of the ecosystem a package lives in and thus Anchore may match the right name against the wrong type. This is most commonly seen in non-OS (Java, Python, Node, etc.) packages.
  • Distro package managers installing non-distro packages using the application package format and not updating the version number when backports are added. This can cause a match of the package against the application-package vulnerability data instead of the distro data.

The most immediate way to respond to a false positive is to create a rule in the Anchore policy engine by adding it to a whitelist. For more information on working with policy bundles and whitelists, check out our Policy Bundles and Evaluation documentation.

Pods/Containers Restarting or Exiting

Perhaps the most common issue we see at Anchore is the Anchore service pods or containers restarting, exiting or failing to start. There are multiple reasons that this may occur, typically all related to the deployment environment or configuration of Anchore. As with any troubleshooting in Anchore, the best place to start is by looking at the logs, describing the pod or by looking at the output from the Docker daemon when trying to start services with Docker Compose.

One common issue that causes a pod or container to fail to start has to do with volume mounts or missing secrets. For Anchore Enterprise, each service must have a license.yaml mounted as a volume for Docker Compose deployments and a secret containing the license.yaml for Kubernetes deployments. For Anchore Engine, the license is not necessary, however mounting configuration files and other files such as SSL/TLS certificates may result in invalid mounts.

One of the most common errors that we see when deploying Anchore has to do with memory and CPU resource allocation. Anchore will typically operate at a steady-state using less than 2 GB of memory. However, under load and during large feed synchronization operations (such as the initial feed sync), memory usage may burst above 4GB. Anchore recommends a minimum of 8GB for each service, for production deployments.

Be sure to review our requirements before deploying Anchore to confirm there are enough available resources for Anchore to operate without a hitch.

Conclusion

For more information, take a look at our documentation and FAQ’s. We hope that these issues aren’t ones you encounter but with a little planning and troubleshooting Anchore know-how, you’ll be up and analyzing in no time.

Anchore and Azure DevOps: Part 2

Previously in the Part 1 Blog, I showed you how to use Anchore to perform a stateful scan in Azure DevOps using Anchore Engine or Anchore Enterprise. This method works great, but what if you don’t have a running instance of Anchore? What if you just want to run a scan, gather the results, and then move on? Anchore (being the versatile tool it is) has that capability too!

Azure Starter Pipeline

Remember our simple Azure DevOps pipeline from my previous post:

trigger:
- master
 
resources:
- repo: self
 
stages:
- stage: Build
  displayName: Build and push stage
  jobs: 
  - job: Build
    displayName: Build
    pool:
      vmImage: ‘ubuntu-latest’
    steps:
    - task: Docker@2
      displayName: Build and push an image to container registry
      inputs:
        command: buildAndPush
        repository: jpetersenames/simpleserver
        dockerfile: Dockerfile
        containerRegistry: production
        tags: |
          $(Build.BuildId)

All this pipeline does is build an image and push it to our production registry every time code is pushed to our repository. We want to add security to our pipeline using Anchore, but we don’t have the resources to run a staging registry as well as an instance of Anchore. Perhaps you just want to try out Anchore in your pipeline to see how the compliance scanning works. This is where the inline scan offered by Anchore comes in. You can read more about the tool in the Anchore documentation, but I want to show you how you can seamlessly integrate Anchore into your pipeline with almost no dependencies.

Take a look at the pipeline below. You can see that we no longer need a staging registry. Instead, we just build a local image using BuildKit so we have all the nice features; suggested but not required for Anchore. Once we have our local image, we can grab the inline scan script that is publicly available through Anchore. Using the inline scan script and container, we can perform a compliance scan on a locally built image without any outside dependencies. Pretty cool!

trigger:
- master

resources:
- repo: self

variables:
- name: localImage
  value: 'local/simpleserver:$(Build.BuildId)'
- name: productionImage
  value: 'production/simpleserver:$(Build.BuildId)'

stages:
- stage: Build
  displayName: Build and push stage
  jobs:
  - job: Build
    displayName: Build
    pool:
      vmImage: 'ubuntu-latest'
    steps:
    - script: |
        DOCKER_BUILDKIT=1 docker build -t $(localImage) -f Dockerfile .
      displayName: Build the local image

    - script: |
        curl -s https://ci-tools.anchore.io/inline_scan-latest | bash -s -- \
          scan -b .anchore/policy.json -d Dockerfile -f -r $(localImage)
      displayName: Anchore Security Scan

    - script: |
        docker tag $(localImage) $(productionImage)
      displayName: Tag the image as production

    - task: Docker@2
      displayName: Push the image to the production registry
      inputs:
        command: push
        repository: jpetersenames/simpleserver
        dockerfile: Dockerfile
        containerRegistry: production
        tags: |
          $(Build.BuildId)

You can see that this pipeline is shorter than our previous pipeline that used anchore-cli and an instance of Anchore. The scan is the exact same as using any other instance of Anchore and it will provide the same results. Inline scan can also be loaded with any policy bundle you want to audit your image as I have done here using the -b option. You can also provide the -f option which will fail the pipeline when the policy scan returns a ‘fail’ result. This will provide output similar to what you see below where you are provided with the ‘fail’ result as well as which gates in the policy bundle were violated.

Security Fail Notice and Violated Policy Gates
You can also see at the top of the output in the terminal that some reports were generated. These are JSON files that contain the contents Anchore found inside the image as well as a list of the vulnerabilities that were detected.

Overall Anchore’s inline scan functionality is a powerful way to integrate security into your Azure DevOps pipeline. It allows you to run a full Anchore compliance scan with no dependencies. This is great for environments that are air-gapped or if it doesn’t make sense to keep a staging registry or a running Anchore instance.

Why We Recommend Helm for Production Instead of Docker Compose

Anchore provides a convenient quick-start using both Docker Compose and Helm to spin up each of its services. Docker Compose may have some advantages over Kubernetes for those new to container architectures, namely the smaller learning curve required, as deployments grow, Kubernetes is a more robust solution to handle scaling, high availability, and multi-node clusters whether in cloud, hybrid, or on-prem environments. In this blog, we’ll outline some pitfalls of deploying Anchore in a production environment using Docker Compose and why we recommend deploying on Kubernetes via Helm.

Competition Over Resources

The biggest issue with using Docker Compose as a deployment method for Anchore at a production-scale level is that Docker Compose is intended to run on a single host. Anchore services can be resource-intensive when performing actions such as feed synchronization and image analysis. Herein lies the issue: when using Docker Compose on a single host, the containers compete for the same underlying resources including memory, CPU, and disk I/O. By spreading services across a cluster of hosts, fewer containers may run on the same host, reducing the competition over resource allocation.

Difficulty Scaling Docker Compose

While it’s not impossible to scale with Docker Compose, it’s not as simple as it is using Kubernetes. Since Docker Compose is intended to run on a single host, there may be issues with conflicting ports, log sizes, and service communication. Within Anchore, the number of images analyzed concurrently is dependent on the number of analyzers deployed. Having multiple CI/CD pipelines is a common theme that we see, making the ability to scale analyzers a necessity to increase analysis throughput.

Effort Required to Upgrade

With Docker Compose, upgrading Anchore services requires modifying the docker compose.yaml, and then relaunching the containers. Should something be incorrect or the deployment needs to be rolled back, the containers would need to be stopped, reverted back to their previous versions, and then redeployed. Kubernetes and Helm provide an easy upgrade method, as well as a rollback should it be necessary.

Conclusion

Overall, Kubernetes is a more production-ready container orchestration platform than Docker Compose. There are multiple mature products out for monitoring Kubernetes clusters, it better handles secrets, as well as integrates easily with visualization and metrics tools. If you’re unsure about where to start when scaling Anchore, take a look at our Scanning in the Millions blog.

To get started with Anchore for either Helm or Docker Compose, check out our installation guide.

Anchore and Carahsoft

When you want to sell to the government, it behooves you to pick your partners wisely—and it’s no accident that Anchore chose to work with the largest trusted government IT solutions provider, Carahsoft Technology Corporation, to distribute Anchore’s products to public sector customers.

See press release: Carahsoft and Anchore launch partnership in public sector
This is a critical time for DevSecOps in government IT. The federal government, along with state and local government agencies and higher education institutions, are looking to new technologies such as containers, Kubernetes, CI/CD pipelines and advanced development methodologies such as DevSecOps to help drive their need for speed.

Anchore is a key part of the new technology stack in DevSecOps that can help bring government agencies into the 21st century with increased velocity and agility. Moreover, modern software approaches are designed to dramatically improve services while also saving big bucks for government software factories and the digital transformation they are driving. You need look no further than the cutting edge work being done by US DoD’s DevSecOps initiatives such as the USAF’s Platform One and Iron Bank. Both of which, Anchore is a key component. That’s why we recently received a SBIR Phase II contract from the United States Air Force for our work in software container hardening.

The Importance of Partners in Selling to Government Customers

Most software vendors who do business with the government work through partners and Anchore is no exception. In fact, our public sector sales strategy is partner-centric. With our newly announced partnership with Carahsoft, nearly all of our government business will flow through Carahsoft as our master government aggregator. The Carahsoft partnership signals that Anchore is “open for business” for government, higher education and state and local customers.
Carahsoft is able to generate unique volume and velocity for its partners’ sales efforts. Its phenomenal sales organization has the resources to address virtually all RFPs and other opportunities in the public sector space and its marketing/demand-gen and operational capabilities are second to none.

The Importance of Real Solutions for Government Customers

Carahsoft has been instrumental in building successful public sector businesses for several leading software vendors, from Red Hat, Adobe, VMWare, Google, and AWS, as well as many others. From its vast portfolio of suppliers, Carahsoft is able to create the right solution to meet the needs of the mission. Carahsoft’s dedicated open source practice is a natural home for Anchore. Working with Carahsoft represents an exciting new chapter in Anchore’s channel business sales model, and we’re thrilled to be bringing our technology into Carahsoft’s solution-centric motion.
Along with Carahsoft and its ecosystem of value-added partners and suppliers, Anchor’s public sector sales team is working hard to accelerate cloud-native development efforts in the government sector. We look forward to the chance to jointly help government agencies and institutions utilize DevSecOps to deliver better outcomes for their customers—the citizens of the United States.

Anchore and Azure DevOps

As I’m sure you have read throughout the previous blogs, Anchore is a very versatile tool that brings security to your containerized workflow. It can be integrated into any CI/CD platform for quick and easy security scans. Today I will show you how to integrate it into Azure DevOps, a useful tool offered by Microsoft.

Starter Azure Pipeline

Go ahead and take a look at this simple Azure DevOps pipeline:

trigger:
- master
 
resources:
- repo: self
 
stages:
- stage: Build
  displayName: Build and push stage
  jobs: 
  - job: Build
    displayName: Build
    pool:
      vmImage: ‘ubuntu-latest’
    steps:
    - task: Docker@2
      displayName: Build and push an image to container registry
      inputs:
        command: buildAndPush
        repository: jpetersenames/simpleserver
        dockerfile: Dockerfile
        containerRegistry: production
        tags: |
          $(Build.BuildId)

Whenever the code is pushed to this repository, it will kick off this pipeline to build a docker image and push it to our final registry. This is great, but we want to add a security scan for our containers before we push them to the final registry. What better tool to use for this than Anchore!

Adding Security

So what do we need to do to add Anchore to our pipeline? There are a few ways that you can use Anchore when it comes to integrating it into a pipeline. I am going to show you how to use the cli tool to access a running instance of Anchore Engine from inside your Azure DevOps pipeline.

You will need to make sure you have a few things before you start using Anchore:

  1. A running instance of Anchore Engine or Anchore Enterprise
  2. A staging registry for pre-scanned images

To set up an instance of Anchore Engine or Anchore Enterprise, please refer to our quick start documentation. I am going to use an Azure Container Registry as my staging registry. To create the registry go ahead and use your favorite method of creating Azure Resources. I used terraform:

provider "azurerm" {
  version = "=2.0.0"
  features {}
}
 
resource "azurerm_resource_group" "blog" {
  name     = "blog"
  location = "West US"
}
 
resource "azurerm_container_registry" "blog" {
  name                = "anchoreStaging"
  resource_group_name = azurerm_resource_group.blog.name
  location            = azurerm_resource_group.blog.location
  sku                 = "Standard"
  admin_enabled       = true
}

Once you have your registry you need to set up a service connection so you can access it easily from inside your pipeline. Go ahead and set up a service connection with a Docker Registry, once in the next blade select Azure Container Registry. Authenticate your Azure account and then select the anchoreStaging registry you just created.

Alright, now that you have your staging registry you must give Anchore the proper permissions to pull from it. Follow the steps in our documentation if you’re using an Azure Container Registry like I am. These instructions will allow Anchore to pull images from registries that aren’t publicly accessible.

Now that all the configuration has been done for your running instance of Anchore, we can add the tooling to our pipeline. We will need our usual information to access our Anchore instance (URL, username, and password); however, we don’t want to expose our password. To keep our password secret, use a variable group in Azure DevOps and make sure to lock the password variable.

Now we are all set to add Anchore to our Azure DevOps pipeline. Take a look at the pipeline code below. We must import the variable group that we created which contains our secret password, as well as our username and the URL for our Anchore instance.

Note: The Build and Production stages have been left out for brevity.

trigger:
- master

resources:
- repo: self

variables:
- name: stagedImage
  value: 'anchorestaging.azurecr.io/simpleserver:$(Build.BuildId)'
- name: productionImage
  value: 'production/simpleserver:$(Build.BuildId)'

  # Use a variable group to store the Anchore credentials
- group: anchoreCredentials


stages:
- stage: Build
  # Same build stage as previously shown


- stage: Security
  displayName: Security scan stage
  dependsOn: Build
  jobs:
  - job: Security
    displayName: Security
    pool:
      vmImage: 'ubuntu-latest'
    steps:
    - script: python -m pip install --upgrade setuptools wheel anchorecli
      displayName: Install Anchore CLI

      # Use the variables from the anchoreCredentials variable group
    - script: |
        export PATH=$PATH:/home/vsts/.local/bin
        export ANCHORE_CLI_USER=$(anchore_user)
        export ANCHORE_CLI_PASS=$(anchore_pass)
        export ANCHORE_CLI_URL=$(anchore_url)
        anchore-cli image add $(stagedImage) --dockerfile=Dockerfile
        anchore-cli image wait $(stagedImage)
        anchore-cli image vuln $(stagedImage) all
        anchore-cli evaluate check $(stagedImage)
      displayName: Anchore Security Scan

- stage: Production
  # Push the image to your production registry and deploy it however you want

You can see here that we have added a Security stage to our pipeline. Inside this stage, we install the anchore-cli tool using the python pip module. Since we are using the Ubuntu agent offered by Azure DevOps, the anchore-cli tool will install in the .local directory. This directory isn’t in our path by default so we must add it to our path along with configuring the credentials to access our Anchore instance. Once anchore-cli has been configured, you can use it however you like. I have chosen to simply add an image and wait for it to scan. Once it has been scanned, I print out all the vulnerabilities and get the policy evaluation result. The evaluate check command will fail the pipeline if the policy evaluation returns a ‘fail’ result.

Summing Up

To sum it all up, it is very easy to integrate strict security into a new or existing Azure DevOps pipeline. As you can see, it only took a few lines of yaml to add a security scan that will keep insecure or non-compliant containers from reaching our production environment. Anchore is a very versatile tool, and this is just one of the ways it can be deployed into a pipeline. This method uses a running instance of Anchore Engine or Anchore Enterprise to scan the staged images. This provides a stateful scan which means users can grab the results after the fact to create reports and provide justifications for passed or failed scans. Security is a requirement when developing modern production-grade software. Using Anchore and Azure DevOps, software developers can quickly and easily integrate security into their daily workflow to ensure only high-quality and secure software ever makes it to production.

Anchore and Jenkins Pipeline Configuration

In this blog, we’ll integrate Anchore Engine into a Jenkins pipeline to prevent vulnerable container images from entering our production environment. We’ll install Docker, Anchore Engine, and Jenkins on a single node (with Ansible) so we can then configure the Anchore plugin into our Jenkins jobs. In this example, we use AWS and a GitLab registry, however, a similar approach can be taken for any platform or registry.

Anchore Engine can also be installed on Kubernetes and configured on a separate node from your CI/CD tools. See our docs for more info.

Requirements

  • AWS account
  • GitLab account

Step 1: Project Setup

To get started, let’s sign in to GitLab and create a new group. We’ll need a group so we can fork the repo associated with this post into a GitLab namespace. If you already have an available namespace, you can use that.


Once we’ve created a group, let’s fork this repo, clone the forked project to our local machine, and cd into it.

git clone <forked_project_url>
cd jenkins-demo

In the next step we’ll install Ansible, but for now let’s install Boto, a Python interface that enables Ansible to communicate with the AWS API. After verifying that we have Python and pip installed, we’ll run the following command:

pip install boto boto3

For the sake of simplicity, we’ll use command-line flags with our Ansible playbook. Let’s paste our AWS credentials and set the environment variables we need for those flags:

export AWS_ACCESS_KEY_ID=<your_access_key> 
export AWS_SECRET_ACCESS_KEY=<your_secret_key>
export AWS_SESSION_TOKEN=<your_session_token>

export AWS_PRIVATE_KEY=<path_to_your_private_key>  # e.g. ~/.ssh/mykey.pem
export AWS_KEYPAIR_NAME=<your_keypair_name>        # e.g. mykey
export AWS_REGION=<your_region>                    # e.g. us-east-2

export REGISTRY=<your_hostname>  # e.g. registry.gitlab.com/<group>/jenkins-demo
export REGISTRY_USER=<your_registry_username>
export REGISTRY_PASS=<your_registry_password>

export ANSIBLE_HOST_KEY_CHECKING=False
export MY_IP=$(curl -s icanhazip.com)

We now have the files and variables needed to set up our infrastructure and configuration. Let’s see how we can use Ansible to do this in the next step.

Step 2: Infrastructure Setup

If you are unfamiliar with Ansible, check out the link to the quickstart video. Afterward, be sure to install Ansible on your appropriate machine (if you haven’t already). In my case, I am using macOS with Python 3.8 and pip installed, so I ran:

pip install --user ansible

Once Ansible is installed, let’s change into the ansible directory so we can run some commands:

cd ansible

In this directory, we have our ansible.cfg file along with our plays. There is a main.yml play that executes our provisioning, installing, and configuring plays in the correct order (we will not need an inventory file for this demo). Let’s create our infrastructure now:

ansible-playbook main.yml \
--private-key=$AWS_PRIVATE_KEY \
-e key_name=$AWS_KEYPAIR_NAME \
-e region=$AWS_REGION \
-e registry=$REGISTRY \
-e registry_user=$REGISTRY_USER \
-e registry_pass=$REGISTRY_PASS \
-e my_ip=$MY_IP

It will take several minutes for our plays to finish executing all of their tasks. Here is a brief overview of what our playbook is doing:

  • Creating an AWS security group with our machine as the only whitelisted address for ingress (hence the MY_IP variable)
  • Creating an AWS EC2 instance (Ubuntu / t2.xlarge) attached with the security group we just created
  • Installing Docker, Docker Compose, Anchore Engine, and Jenkins on the EC2 instance
  • Adding our registry to Anchore Engine so we can scan images and enforce policy (hence the REGISTRY variables)

Note – After you have finished following this post, you can tear down all infrastructure by running:

ansible-playbook destroy.yml \
--private-key=$AWS_PRIVATE_KEY \
-e region=$AWS_REGION

Now that we have our infrastructure in place, software installed, and a registry added to Anchore Engine, we can move on to setting up our project with the Jenkins UI!

Step 3: Jenkins Configuration

In this step, we will access Jenkins, configure the Anchore Container Image Scanner plugin, create a credential so Jenkins can access GitLab, and configure a job to use our Jenkinsfile.

Within the AWS Management Console, go to the EC2 service and search for our “jenkins-demo” instance. We’ll navigate to the instance’s Public IP on port 8080 (the default Jenkins port) from the browser on our local machine (an ingress rule for port 8080 from our local machine has already been created for us). We should see the Jenkins login page:


To retrieve your Jenkins administrator password, we’ll SSH into the instance from our local machine (an ingress rule for port 22 from our local machine has already been created for us) and run:

sudo docker logs jenkins

Copy the Administrator password from the logs, paste it into the prompt on the Jenkins login page, and click Continue.

Select Install Suggested Plugins on the next page.

Create a First Admin User and click Save and Continue.

Confirm the Jenkins URL on the following page, click Save and Finish, then Start using Jenkins. We should see the Jenkins Dashboard:


We will now install the Anchore Container Image Scanner plugin and configure it to access Anchore Engine.

On the left-hand side of the page, go to Manage Jenkins > Manage Plugins, click the Available tab, search for “Anchore”, select the Anchore Container Image Scanner Plugin, and click Install without restart:


After installing the plugin, go to Manage Jenkins > Configure System, and scroll down to the Anchore Container Image Scanner Plugin settings. We’ll paste our EC2 instance’s Public DNS and set the port to 8228 (the default Anchore Engine port). Enter the Engine Username as “admin” and Engine Password as “foobar” (the default Anchore Engine authentication) then click Save:


We will now create a global credential so our Jenkins job can access the Jenkinsfile from our GitLab repo and registry.

On the left-hand side of the page, go to Credentials > System, then click “Global credentials (unrestricted)” and Add Credentials. There are several different kinds to choose from, but in this demo we will use Username with password. We’ll add our GitLab username and password and set the ID of the credential to “gitlab-registry” (we use this ID in our Jenkinsfile) then click OK:

The last part of this step is to configure a Jenkins job to use the Jenkinsfile from our GitLab repo.

From the Jenkins Dashboard, select create new jobs, name the item, select pipeline job, and click OK (the Anchore Container Image Plugin also supports freestyle jobs, but we’ll use a pipeline job for this demo).

We are then prompted by our job’s configuration settings. Scroll down to the Pipeline settings, change ‘Definition’ to Pipeline script from SCM, select Git as the ‘SCM’, and paste your forked repository’s URL. Select the credential that we just created and click Save:

Step 4: Test

In order to test our pipeline, we’ll need to make sure our Jenkinsfile is ready. Change lines 5 and 6 of the Jenkinsfile to use your repository and registry. Once you’ve pushed changes to GitLab, head back to Jenkins and Open Blue Ocean on the left, then run the pipeline job we just created.

Our Jenkinsfile builds from the Dockerfile in our repo, which is then analyzed by Anchore Engine. In this example, we are simply analyzing debian:latest and the default Anchore policy issued a PASS, thus our pipeline continues to the next stage:

If we change the Dockerfile to build from node:13.14 instead, we’ll see the pipeline fail, preventing us from continuing to the next stage such as deploying the image into production:

Heading back to Jenkins classic UI, we can see there is now an “Anchore Report” associated with our Jenkins job. If we click on the report, we’ll find out that the node:13.14 image triggered 12 stop actions in relation to HIGH vulnerabilities that did not comply with the default policy:

Step 5: Customize and Take Action

We now have Anchore Engine integrated with a Jenkins pipeline! We can add more registries and customize our policies by connecting to our EC2 instance via SSH. For more information on using registries and policies with Anchore Engine, see:

Regardless of which CI/CD tool, cloud platform, source code manager, or registry you’re using, it is critical to prevent bad actors from gaining access to your containers and clusters. With new vulnerabilities being discovered every day, hackers are constantly looking for ways to breach the attack surface and inflict costly damage.

Anchore Engine is a great first step towards container security, policy, and compliance. However, if you or your company is interested in a more comprehensive commercial platform, check out Anchore Enterprise and find out why organizations like the U.S. Department of Defense have made Anchore a requirement in their adoption of DevSecOps.

Anchore and GitLab Pipeline Configuration

In this blog, we will add Anchore security and compliance to a GitLab container pipeline. We will be using AWS and a GitLab registry, however the same approach can be taken for any platform or registry.

Requirements

  • AWS account
  • GitLab account

Step 1: Project Setup

To get started, let’s sign into GitLab and create a new group. We’ll need a group so we can fork the repo associated with this post into a GitLab namespace. If you already have an available namespace, you can use that.

GitLab New Group
Once we’ve created a group, let’s fork this repo, clone the forked project to our local machine, and cd into it.

git clone
cd gitlab-demo

Next, we will need a GitLab Runner to execute our .gitlab-ci.yml file. So, back in GitLab, within our forked repo, let’s navigate to Settings > CI/CD and expand the Runners section.

GitLab Setting Up Runners
In this guide, we will be using a specific runner so Anchore Engine and our GitLab Runner can live on the same machine. Underneath “Shared Runners”, disable shared Runners for the project (if enabled).

Lastly, underneath “Set up a specific Runner manually”, copy the registration token. We will use this token in the next step.

Step 2: Infrastructure Setup

In order to speed up the installation process, we will use Infrastructure-as-Code. If we inspect the terraform.tf file in our repo, we will see that it performs several tasks for us:

  • Creates an AWS EC2 instance (Ubuntu AMI / t2.xlarge / 16 GiB storage) with a security group that allows ssh into the instance from our local machine only
  • Installs and starts Docker
  • Installs and runs Anchore Engine via Docker Compose (Anchore Engine can also be deployed on Kubernetes; see our docs for more info)
  • Adds our registry to Anchore Engine
  • Installs the Anchore CLI
  • Installs, registers, and starts our GitLab Runner as a Shell Executor

All of this can be done by exporting 8 simple environment variables and running a few basic commands with Terraform. If you haven’t already, install Terraform now.

Let’s start by pasting our registration token from the previous step and setting the remaining required environment variables from our local machine.

export TF_VAR_gitlab_runner_registration_token=  
# paste token from previous step

export TF_VAR_region=<AWS_REGION>                                    
# example: us-east-2

export TF_VAR_key_name=<AWS_KEYPAIR_NAMES> 
# example: mykey                           

export TF_VAR_key_path=<AWS_PRIVATE_KEY_PATH>
# example: ~/.ssh/mykey.pem

export TF_VAR_registry=<REGISTRY_HOSTNAME>  
# example: registry.gitlab.com/container-pipeline/gitlab-demo      
                   
export TF_VAR_registry_username=<REGISTRY_USERNAME>  
                
export TF_VAR_registry_password=<REGISTRY_PASSWORD>

Verify that our AWS credentials file contains non-expired profile credentials (Terraform will hang if these are unset or expired).

cat ~/.aws/credentials

Copy our AWS profile name.

[default] # copy this
aws_access_key_id =
aws_secret_access_key =
aws_session_token =

Create the final environment variable Terraform needs to create an AWS connection.

export TF_VAR_profile=
# example: default

Finally, after confirming that we are inside our repo (in the same directory as the terraform.tf file), let’s initialize our project, apply our configuration, and accept changes.

terraform init
terraform apply
yes

Terraform is now spinning up our EC2 instance and performing the tasks listed at the beginning of this step (this will take approximately 3.5 minutes).

Step 3: Test and Customize

By default, when GitLab sees an active runner associated with our project, it triggers our pipeline build every time we push changes. While we could trigger our pipeline manually or with pull requests, try modifying the Dockerfile and push your changes. Check out the results in the CI/CD > Jobs logs.

Pipeline Test and Customization
In this example, we simply tested debian:latest and our result was FAIL. Anchore Engine found 2 high vulnerabilities that did not comply with the default policy, thus our pipeline broke and was prevented from continuing to the next stage. If you desire, you can change the ANCHORE_FAIL_ON_POLICY variable in .gitlab-ci.yml to “false” to allow the pipeline to continue.

We now have Anchore Engine configured with a GitLab pipeline. You can connect to the EC2 instance via ssh from the local machine you ran the Terraform commands with so you can further manage your registries and policies. For more information on using registries and policies with Anchore Engine, see:

This guide shows just one way you can integrate container security and compliance into a GitLab pipeline. Feel free to use the files in the associated repo when you are integrating Anchore into your pipeline and scanning your own images!

Anchore Engine: Tips and Tricks for New Users

Just like you, I was new to Anchore just a few short weeks ago. Here is a quick run down to make getting started just a little bit easier using the documentation for Anchore Engine.

Anchore Engine is an open source project that allows users to inspect and analyze security risks within containers. It can be used as a standalone tool, as a part of a CI/CD pipeline to scan for security vulnerabilities during a software build pipeline, or as a custom solution through integration via the REST API. It is a powerful tool with limitless possibilities, but for our purposes today, we will use Anchore Engine on its own.

Pre-installation Setup

The quickest way to get started is through Docker Compose. But before pulling the Docker image, we need to make sure that the machine we will be running Anchore on has enough resources to run smoothly. For production environments, we recommend using the Anchore Helm chart as Kubernetes allows for greater flexibility when it comes to load balancing, scalability, and performance. However, for getting started quickly, Docker is perfectly fine. You can refer to other technical specifications that are necessary for provisioning a machine to run Anchore, if needed.

Provisioning with Anchore Engine

If we want Anchore to detect non-os vulnerabilities coming from different package managers such as pip, yum, etc., we need to configure it to do so in the config.yaml file in the container. Set the nvd parameter to true to sync non-os vulnerability feeds and then restart Anchore. This will start the feed sync again with the new sources. For additional assistance, find information on enabling various feed sources.

Once you have the Anchore containers up and running, your next step is to wait. The vulnerability feeds need some time to sync. This will only take a few minutes to complete, and in the meantime, you can install the Anchore CLI. This will make executing commands faster and easier than executing them through the Anchore Engine container. To do this, ensure that Python and pip are installed on your system and run pip install --user --upgrade anchorecli. With Anchore CLI installed, you can add your first image. Additionally, Anchore Engine can be accessed through its API.  *Note. It is highly recommended that you enable Swagger UI as it allows for greater visibility into the Anchore Engine API.

The Anchore CLI is built on top of the Anchore REST API. With it installed, we can do a number of things. Once the feeds have finished syncing, we can begin scanning images with a full vulnerability library backing up our scans.

Analyzing Images

Adding an image is as simple as running the following command anchore-cli image add <repository>/library/<image_name>:<version>. This will pull the requested image and queue it for analysis as well as provide a print out of metadata discovered within the repository. Once the engine has completed its analysis, the status will be set to analyzed and the vulnerability findings can be viewed. If you want to specify a Dockerfile to be analyzed as additional metadata, this can be accomplished by running the command just like it was before, but with the addition of specifying the location of the dockerfile whose content should be passed in along with the image: anchore-cli image add<repository>/library/<image_name>:<version> --dockerfile=/path/to/Dockerfile and if we want to reanalyze an image, we will add it again with a --force tag at the end.

We can also analyze images from private repositories. By default, Anchore Engine will only pull images from TLS/SSL enabled registries. If yours is self-signed or has a certificate from an uncommon or unknown CA source, you can still scan your images. Simply run one of the two following commands to add the image. anchore-cli registry add REGISTRY USERNAME PASSWORD --insecure will skip credential validation in the case that you are sure the credentials are correct, but cannot be validated by Anchore Engine.

Once an image is analyzed, we will want to view its contents or other information associated with that image. We can do this by running anchore-cli image content INPUT_IMAGE CONTENT_TYPE.

Once an image is analyzed, we can view the vulnerabilities present in that particular image. To do so, we will run anchore-cli image vuln IMPUT_IMGAGE VULN_TYPE. The available vuln types are os which are vulnerabilities against operating system packages, non-os which are vulnerabilities against language packages such as pip, or we can display both by adding the tag all. With these commands, we will get a report of the vulnerabilities and their severity.

Conclusion

With this, we should have a good start on understanding some of the major concepts behind Anchore Engine and how it works. For more information, the documentation is a great place to look.

Scanning in the Millions: Scaling with Anchore

In today’s DevSecOps environment filled with microservices and containers, applications are developed with the idea of scaling in mind. Performing security checks on thousands – or even millions – of container images may seem like a giant undertaking, but Anchore was built with the idea of scaling to handle vast amounts of image analyses. While Anchore conveniently provides quickstarts using both Docker-Compose and Helm for general usage and proof-of-concepts, preparing a production-grade deployment for Anchore requires some more in-depth planning.

In this blog, we will take a look at some of the architectural features that help facilitate scaling an Anchore installation into a more production-ready deployment. Every deployment is different, as is every environment, and keeping these general ideas in mind when planning the underlying architecture for Anchore will help reduce issues while setting you up to scale with Anchore as your organization grows.

Server Resourcing

Whether your Anchore installation is deployed on-premise with underlying virtual machines or in a cloud environment such as AWS, GCP, or Azure, there are some key components that should be considered to facilitate the proper functioning of Anchore. Some of the areas to consider when doing capacity planning are the number of underlying instances, the resource allocation per node, and whether having a few larger nodes is more beneficial than having multiple smaller nodes.

Resource Allocation

As with any application, resource allocation is a crucial component to allow Anchore to perform at its highest level. With the initial deployment, Anchore synchronizes with upstream feed data providers which can be somewhat resource-intensive. After the initial feeds sync, the steady operating state is much lower, but it is recommended for a production-scale deployment that each of Anchore’s services is allocated at least 8GB of memory; these include the following services:

  • analyzer
  • API
  • catalog
  • queue
  • policy-engine
  • enterprise-feeds (if using Anchore Enterprise)

CPU utilization can vary per service, but generally, each service can benefit from 1-2 dedicated vCPUs.  As more images are added for concurrent analysis, these values should also be increased to support the load.

Cluster Size and Autoscaling

The appropriate sizing for your deployment will vary based on factors such as the number of images you are scanning over a given period of time, the average size of your images, the location of the database service tier, but a good rule of thumb to start is to use a few larger nodes over multiple smaller nodes. This enables the cluster to adequately support regular operations during non-peak times when the system is primarily on standby and provides services room to scale as additional resources are needed.

Another approach which adheres more with an autoscaling architecture is to use a combination of larger nodes for the core Anchore services (API, catalog, policy-engine, and queue), and smaller nodes that can be used as dedicated nodes for the analyzer services; ideally one analyzer per smaller node for best results. This can be used in conjunction with autoscaling groups and spot instances, enabling the cluster to scale as memory or CPU utilization increases.

Storage Resourcing

When considering allocating storage for an Anchore installation, not only does database capacity planning play a crucial role, but underlying instance disk space and various persistent storage volume space should also be considered. Volume space per node can be roughly calculated by 3-4x the size of the largest image that will be analyzed. Anchore uses a local directory for image analysis operations including downloading layers and unpacking the image content for the analysis process. This space is necessary for each analyzer worker service and should not be shared. The scratch space is ephemeral and can have its lifecycle bound to that of the service container.

Anchore uses the following persistent storage types for storing image metadata, analysis reports, policy evaluation, subscriptions, tags, and other artifacts.

Configuration Volume – This volume is used to provide persistent storage of database configuration files and optionally certificates. (Requires less than 1MB of storage)

Object Storage – The Anchore Engine stores documents containing archives of image analysis data and policies as JSON documents.

By default, this data is persisted in a PostgreSQL service container defined in the default helm chart and docker-compose template for Anchore. While this storage solution is sufficient for testing and smaller deployments, storage consumption may grow rapidly with the number of images analyzed, requiring a more scalable solution for medium and large production deployments.

To address storage growth and reduce database overhead, we recommend using an external object store for long-term data storage and archival. Offloading persistent object storage provides scalability, improves API performance, and supports the inclusion of lifecycle management policies to reduce storage costs over time. External object storage can be configured by updating the following section of your deployment template:

...
services:
  ...
  catalog:
  ...
  object_store:
    compression:
      enabled: false
      min_size_kbytes: 100
    storage_driver:
      name: db
      config: {}

Anchore currently supports the use of Simple Storage Service (AWS S3), Swift, and MinIO for Kubernetes deployments.

You can learn more about the configuration and advantages of external object storage in our docs.

Database Connection Settings

A standard Anchore deployment includes an internal PostgreSQL service container for persistent storage, but for production deployments, we recommend utilizing an external database instance, either on-premises or in the cloud (Amazon RDS, Azure SQL, GCP Cloud SQL). Every Anchore service communicates with the database, and every service has a configuration option that allows you to set client pool connections, with the default set at 30. Client pool connections control how many client connections each service can make concurrently. In the Postgres configuration, max connections control how many clients total can connect at once.

By default, the settings in PostgreSQL out of the box are around 100 max connections. To improve scalability and performance, we recommend leaving the Anchore client max connection setting at its defaults and bumping up the max connections in Postgres configuration appropriately. With the client default at 30, the corresponding max connections setting for our deployment of 100 Anchore services should be at least 3000 (30 * 100).

Archival/Deletion Rules & Migration

As your organization grows, it may not be necessary to store older image analysis in your database in the active working set. In fact, hanging onto this type of data in the database can quickly lead to a bloated database with information no longer relevant to your organization. To help reduce the storage capacity of the database and keep the active working set focused on what is current, Anchore offers an “Analysis Archive” tool that allows users to manually archive and delete old image analysis data or to create a ruleset that automatically archives and deletes image analysis data after a specified period of time. Images that are archived can be restored to the active working set at any time, but using the archive allows users to reduce the necessary storage size for the database while maintaining analysis records for audit trails and provenance.

The following example shows how to configure the analysis archive to use an AWS S3 bucket to offload analysis data from the database.

...
services:
  ...
  catalog:
  ...    
  analysis_archive:
      compression:
        enabled: False
        min_size_kbytes: 100
      storage_driver:
        name: 's3'
        config:
          access_key: 'MY_ACCESS_KEY'
          secret_key: 'MY_SECRET_KEY'
          #iamauto: True
          url: 'https://S3-end-point.example.com'
          region: False
          bucket: 'anchorearchive'
          create_bucket: True

For users with existing data who want to enable an external analysis archive driver, there are some additional steps to migrate the existing data to the external analysis archive. For existing deployments, you can learn about migrating from the default database archive to a different archive driver here.

For more information, check out our documentation on Using the Analysis Archive.

Deployment Configuration

One of the quintessential features of Anchore is the ability to customize your deployment, from the aforementioned server and storage resourcing to the number of services and how Anchore can fit into your architecture. From a production perspective, a couple of areas should be considered as the organization scales to support larger numbers of images to analyze while maintaining a steady throughput; the ratio of analyzers to core service and the ability to enable layer caching are two that we have found to be helpful.

Service Replicas

Specifically, with Kubernetes deployments in mind via Helm, Anchore services can be scaled up or down using a `values.yaml` file and setting the `replicaCount` to the desired number of replicas. This can be achieved with Docker-Compose as well, but the deployment would need to be running in something like Docker Swarm or AWS ECS.

...
  ...
anchoreAnalyzer:
  replicaCount: 1 ← Here is where the number of Analyzer services can be upped
  ...

Check out these links for scaling services with Docker or scaling with Kubernetes. Also, take a look at the documentation for our Helm chart for some more information on deploying with Helm.

Golden Ratio of Thumb

When scaling Anchore, we recommend keeping a 4-1 ratio of analyzers to core services. This means for a deployment that runs 16 analyzers, we recommend having 4 of the API, catalog, queue, and policy-engine services. The idea behind this stems from the potential for a situation where there are four concurrent heavy memory, cpu, and input/output tasks all happening at once in one of the core services, such as four analyzers all initiating the same task at once like sending an image to a single policy-engine. While a well-provisioned server may be able to handle something like this while still being able to support other lighter tasks, generally the underlying server can start to be overwhelmed unless it’s specifically provisioned to handle many concurrent workloads simultaneously. Additionally, using the 4-1 analyzer-to-core-services ratio helps spread the memory usage load, and where possible as outlined in the above Server Resourcing section, splitting the analyzers out to dedicated nodes helps ensure healthy resource utilization.

Layer Caching

In some cases, your container images will share a number of common layers, especially if images are built from a standard base image. Anchore can be configured to cache layers in the image manifest to eliminate the need to download layers present in multiple images. This can improve analyzer performance and speed up the analysis process.

Layer caching can be enabled by setting a max value greater than ‘0’ in your helm chart

anchoreAnalyzer:
  layerCacheMaxGigabytes: 0

And under the ‘Analyzer’ section of the docker-compose template:

analyzer:
    enabled: True
    require_auth: True
    cycle_timer_seconds: 1
    max_threads: 1
    analyzer_driver: 'nodocker'
    endpoint_hostname: '${ANCHORE_HOST_ID}'
    listen: '0.0.0.0'
    port: 8084
    layer_cache_enable: True
    layer_cache_max_gigabytes: 4

By default, each analyzer container service uses ephemeral storage allocated to the container. Another consideration to improve performance is to offload temporary storage to a dedicated volume. With the cache disabled the temporary directory should be sized to at least 3 times the uncompressed image size to be analyzed. This option can be set under `scratchVolume` settings in the Global configuration section of the helm chart:

scratchVolume:
   mountPath: /analysis_scratch
   details:
     # Specify volume configuration here
     emptyDir: {}

Conclusion

In this blog, we’ve briefly touched on several of the areas that we believe to be of critical importance when scaling with Anchore. Some of the more important aspects to keep in mind, and what we’ve seen from our customers who run at scale, are as follows:

  • Resource allocation
      • Proper memory and CPU allocation is a critical component of running a successful Anchore deployment
  • Database provisioning
      • Database sizing is important to consider in the long-term, allowing you to analyze images for years to come without the concern of running out of DB space
      • Connection pooling is another crucial aspect to consider to allow Anchore services to concurrently access the database without hitting limits
  • Tons of configuration options
      • Anchore has a vast amount of different configuration options to help customize Anchore to fit your organizational needs

While this was a high-level overview, special attention should be paid to each when performing architectural and capacity planning.  From a broader perspective, cloud providers each offer documentation on architectural planning with autoscaling as well as recommendations for how to scale applications in their specific cloud environments.

Latest Anchore Action Delivers Container Security as an Integrated GitHub Experience

At their recent Satellite event in early May, GitHub released a powerful new addition to their increasingly robust set of security and automation features within GitHub Advanced Security, called code scanning. At a high level, this new feature brings static code analysis (based on the CodeQL technology acquired from Semmle last year), with a focus on identifying common and known security flaws in source code patterns, directly into the software development lifecycle (SDLC). Along with GitHub Actions, users are now even closer to using these native tools to manage their end-to-end ‘commit-to-release’ process, including security checks along the way.

At Anchore, we’re a firm believer in the concepts of identifying security issues as far ‘left’ and as part of as many stages of the SDLC as possible, which drastically reduces the impact of a security problem when compared to discovering an issue after software is released (or worse, deployed). Because of this alignment of purpose, we were excited to dive into this new feature in collaboration with our partners at GitHub, and explore ways in which we could potentially leverage this new capability with our own technology for scanning container images for security flaws, using the same framework and management tools that GitHub is providing for source code analysis.

Today, we’re happy to announce that Anchore’s GitHub Scan Action now supports integration with GitHub’s code scanning feature on eligible repositories. With this new capability, users can leverage both GitHub’s CodeQL-based security analysis to their action flows, and also now include another vital security step with Anchore that scans and reports on any security, compliance and best-practice flaws that may be present in a final container build artifact. By adding both steps, users are able to not only get high quality source code security scans, but also be assured that any container image that is built from the source code (often a final step that produces the actual artifact that would be deployed) is also scanned and secured. At Anchore, we believe that this is an important step that must be considered as the construction of container images often brings in additional code, dependencies, and configurations that are not directly present in the source code itself.

Anchore Scan Action

The Anchore Scan Action is a step that any GitHub Actions user can include in their existing workflows. This Action provides a vulnerability scan and/or an Anchore policy evaluation against a locally generated container artifact. We won’t go into the full details of the Anchore Scan Action here, but please refer to the Anchore Scan Action page for more information on configuring and including this action. For the purposes of this discussion, the high level idea of the Anchore Scan Action is that it takes as input a reference to a container image, performs its security and compliance scan, and generates JSON reports for the container image software bill of materials (SBOM), vulnerabilities that have been discovered as present in the container image, and a full (customizable) Anchore policy evaluation report.

One of the powerful new features of the GitHub code scanning feature is that the system supports the ability for third-party tools (like Anchore!) to produce results that live alongside the built in CodeQL reports. For the latest release of the Anchore Scan Action, we’ve integrated with this capability – the same container vulnerability scanning step now can generate a document (in SARIF format) that encodes Anchore’s vulnerability report data in a form that can then be uploaded back to GitHub, resulting in a security report that lives alongside the new code scanning alerts. This way, findings from both the CodeQL source code scanning step and the Anchore container image scanning step can be reviewed and managed using a common interface.

Anchore Code Scanning Workflow in Github

In the screenshot above, we’re looking at an example of a workflow that checks out code, performs a CodeQL scan, builds a container image from the code, performs an Anchore scan, and completes. Once the run is finished, we see that the report section of the security tab in GitHub now includes both a CodeQL section as well as an Anchore Container Scan section, listing all of the vulnerabilities that Anchore discovered as present in the built container image. Clicking into one of the findings, we’ll get even more detail:

Anchore Action Code Scan Results
Here, we can see that the Anchore scan result includes information about the vulnerability identifier, severity, the vulnerable software artifact metadata (name, location, type and version) and a link to the upstream vulnerability information itself.

Example Workflow: Automating a Scan

Through GitHub Actions and an increasing tool-chest of powerful security and quality tools, GitHub has made it extremely easy to add this type of scanning and reporting to your existing workflow. Below is a short example of a workflow YAML definition that implements the steps that produced the screenshots in the previous section. If you’re already using the Anchore Scan Action, then the only changes required are to enable the ACS report generation feature, and add an ‘upload’ step at the end of the scan.

Example Action YAML:

name: "Run Anchore Scan Action (ACS SARIF Demo)"
 
on: [push]
 
jobs:
  CodeQL-Analysis:
    runs-on: ubuntu-latest
    steps:
    - name: Checkout the code
      uses: actions/checkout@v2
 
    # Initializes the CodeQL tools for scanning.
    - name: Initialize CodeQL
      uses: github/codeql-action/init@v1
      # Override language selection by uncommenting this and choosing your languages
      # with:
      #   languages: go, javascript, csharp, python, cpp, java
 
    - name: Perform CodeQL Analysis
      uses: github/codeql-action/analyze@v1
  Anchore-Scan-Action:
    runs-on: ubuntu-latest
    steps:
    - name: Checkout the code
      uses: actions/checkout@v2
    - name: Build the Docker image
      run: docker build . --file Dockerfile --tag localbuild/testimage:latest      
    - name: Run the local anchore scan action itself with sarif generation enabled
      uses: anchore/scan-action@v1
      with:
        image-reference: "localbuild/testimage:latest"
        debug: true
        acs-report-enable: true
        acs-report-severity-cutoff: "Medium"
    - name: Upload Anchore Scan ACS Report
      uses: github/codeql-action/upload-sarif@v1
      with:
        sarif_file: results.sarif

Summary and Further Information

This new feature within GitHub Advanced Security is truly exciting for us at Anchore – as more and more processes and best practices continue to favor a ‘shift left’ mindset (something that has been a core focus of Anchore technology throughout its history), we’re looking forward to continuing to work closely with GitHub and the community to bring fully featured security tooling right into your automated workflows quickly and easily.

For more information on the above topics, please see the following links:

Watch the Rise of DevSecOps in Gov Software Initiatives

On May 27th, Anchore had the privilege of participating in the virtual Microsoft Azure Government DC Meetup. The rise of DevSecOps in gov software initiatives was a fantastic event with a great spread of knowledge. There were demos such as deploying OpenStack onto secure infrastructure and implementing DevSecOps at full speed.

I gave a demo showcasing Anchore integrated into Azure DevOps in a daily developers life cycle for full speed security. Utilizing a custom Anchore integration, I showcased how to quickly and easily detect security defects in containers before they are deployed. Also, I shared some common best practices and showed how Anchore can enforce them.

The event also featured a panel discussion about DevSecOps in the government sector, consisting of experienced individuals from F35 Joint Strike Fighter Program, NIST, and Azure Gov. Check out the full playlist here!

Top 5 Tips for New Anchore Engine/Enterprise Users

In my first three months here at Anchore, I’ve experienced firsthand the highs and lows of working with new technologies. The adoption of any new tool comes with a learning curve that includes the process of trial and error. In this post, I’d like to share some tips relating to common issues that I’ve seen new users of Anchore Engine and Enterprise encounter in the hope to ease this process for future users.

1. Make Sure to Add Registries to Anchore Before Attempting to Scan Images

By default, Anchore will attempt to download images from a registry without further configuration. However, if your registry requires authentication, then registry credentials will need to be defined. If you forget to add your registry before you attempt to scan an image, you will receive a Skopeo error stating “cannot fetch image digest/manifest from registry”.

To add a registry via the Anchore CLI:

anchore-cli registry add REGISTRY USERNAME PASSWORD

See here for more information about configuring registries.

2. Use the API Reference on SwaggerHub and the CLI Debug Flag

One of the many great capabilities of Anchore is the ability to interact through a CLI, UI (Enterprise only), or RESTful API. This allows dev, devops, and secops teams to use Anchore however they prefer. If you are having trouble connecting to the API, you could have the username, password, or URL set incorrectly. You can see what each CLI command is doing by passing the –debug flag:

anchore-cli --debug system feeds sync

See here for more information about configuring the CLI.

3. Be Careful When Adding Repositories

When adding a repository, Anchore Engine will automatically add the discovered tags to the list of subscribed tags. By default, repositories added to Anchore Engine are also automatically watched. There have been times when new users have accidentally added a repository with a large number of tags and then froze their system that could not handle the workload. To prevent this from happening, try:

anchore-cli repo add repo.example.com/apps --noautosubscribe
anchore-cli repo unwatch repo.example.com/myrepo

See here for more information about using repositories.

4. Use a Policy Bundle That Fits Your Company’s Security Needs

Anchore Engine includes a default policy configured at installation that performs basic CVE and Dockerfile checks. This default policy was not intended to be used in production. You could, however, use the default policy as a building block for your own policy. There are many different ways to customize policies with Anchore to meet security and compliance requirements. For more information, see:

5. Make Sure Ingress is Set Up Correctly if You’re Using Cloud Platforms and CI/CD Tools

This last tip is rather basic but still relates to a common issue nonetheless. If you’re running Anchore, for example, on a cloud machine, make sure your ingress rules are set up correctly so that your CI/CD tools (e.g. Jenkins, GitLab CI, etc.) are able to access Anchore Engine. A simple check on your inbound rules could present the reason why your pipeline job is “timing out” or “refusing connection” to Anchore. By default, the Anchore service is configured on port 8228; make sure any third-party tools you’re using can access that port.

Anchore Scan for Atlassian Bitbucket Pipelines

Recent announcements from Atlassian have made several powerful new features of the Bitbucket platform available worldwide – at Anchore, this means that our official Anchore Scan Pipe for Atlassian Bitbucket Pipelines is also now generally available, bringing container image security and compliance scanning ever closer to your Atlassian Bitbucket based automated software delivery systems.

Pipelines enable users to construct automated CI/CD processes that are closely aligned with source code activities, triggering on events like developer pull requests and code commits to automatically generate executable software (such as container images) that is built, tested, verified, and finally released.  Many modern CI/CD processes generate container images as the final executable software artifact, which introduces a vector by which new software and configurations are included in the executable that were not present in the source code itself.  This introduces potential security and compliance issues that are unique to this step of the build/test/release process – Anchore’s technology focuses on giving users the tools needed to assert flexible security, compliance and best-practice requirements in any container build process as early as possible, which makes the inclusion of Anchore into the Atlassian Bitbucket Pipeline ecosystem a natural fit.

The new Anchore Scan Pipe enables users to quickly and easily add Anchore’s container image security and compliance scanning into existing and new pipelines with just a few lines of YAML.  Further, the integration was developed in concert with the availability of Bitbucket’s recently announced Code Insights for Bitbucket Cloud feature, enabling the results of your Anchore scan to be presented natively in the Bitbucket Cloud UI alongside pull requests and commits.

To get started, check out the official Anchore Scan Pipe, or see the following quick run-through demonstrating the addition of an Anchore scan to your existing pipeline.

Step 1: Review your Container Image Building Pipeline

For example, your bitbucket_pipelines.yaml might have a simple step to build a container image similar to the following:

script:
  - export IMAGE_NAME=your_container_repo/your_container_image:$BITBUCKET_COMMIT
 
  # build the Docker image (this will use the Dockerfile in the root of the repo)
  - docker build -t $IMAGE_NAME -f Dockerfile .
 
  # push the new Docker image to the Docker registry
  - docker login --username $DOCKER_HUB_USERNAME --password $DOCKER_HUB_PASSWORD  
  - docker push $IMAGE_NAME

Step 2: Add Call to Anchore Scan Pipe

Anchore scans container image content, and thus requires that an image is built to be provided as input to the scan. This means that the Anchore Scan Pipe invocation can be placed anywhere between the image build and image push steps. Minimally, only the name of the newly built image must be passed to the pipe.

script:
  - export IMAGE_NAME=your_container_repo/your_container_image:$BITBUCKET_COMMIT
 
  # build the Docker image (this will use the Dockerfile in the root of the repo)
  - docker build -t $IMAGE_NAME -f Dockerfile .
 
  # run the anchore scan pipe
  - pipe: anchore/anchore-scan:0.1.2
  variables:
    IMAGE_NAME: $IMAGE_NAME
 
  # push the new Docker image to the Docker registry
  - docker login --username $DOCKER_HUB_USERNAME --password $DOCKER_HUB_PASSWORD  
  - docker push $IMAGE_NAME

When the pipe executes, it will perform a full software package vulnerability scan, as well as an Anchore policy evaluation using a set of checks that are included by default.

Step 3: Run the pipeline as usual, and observe the Anchore Scan Pipe executing

In the native Bitbucket Pipeline UI, you should now see the Anchore Scan Pipe invoked when the above step is executed.

Expanding the pipe dropdown will reveal more messages showing the Anchore Scan Pipe progress.

Step 4: Inspect scan results via Code Insights Report

Now that the pipe has executed against your commit, the last step is to review the results of the Anchore Scan Pipe, via the native Code Insights Reports section next to PRs and Commits. The Anchore scan will generate two reports (Vulnerabilities, Policy Evaluation) which can be toggled on and off via pipe configuration – by default, they’re both enabled:

Step 5: Tune your policy and scan options

Anchore has always included very flexible tooling to generate results based on your specifications. The Anchore Scan Pipe exposes this flexibility by enabling you to not only rely on the default Anchore policy but also specify your own by storing your custom policy document alongside your code, to have customized policies per repository. Click here to learn more about the breadth and depth of Anchore’s policy checking capabilities.

For more information:

Anchore Enterprise 2.3 Feature Series – Scheduled Reports

With the release of Anchore Enterprise 2.3 (built upon Anchore Engine v0.7.1), we are happy to announce a new feature of our reporting service: the ability to run scheduled reports.

Scheduled reporting is used to create custom queries, set a report to run on an automated schedule (or store the configuration for future use). Automatic notifications can be configured when a scheduled report is executed, providing insights for account-wide artifacts. The results are provided through a variety of formats in the Anchore Enterprise UI that include tabular, JSON, or CSV.

Scheduling a New Report

The first step in creating a new reporting schedule is to create a template to be used for the scheduled report. To begin, navigate to the View Reports tab. Under Creating a New Template, there is a drop-down that has several options and their descriptions; each can be used to generate reports. For this example, the template will be for Images with Critical Vulnerabilities.

Scheduling a new report in Anchore
For this example, just the default values will be used, but from the screenshot below, it’s easy to see there are a lot of different options and configurations to customize the report. After adding a name and description, clicking OK will save the template.

Scheduled report customizations
In the screenshot above, the fields allow users to control what data is shown in the results and are displayed from left to right within a report table. To optionally refine the result set returned, filter options can be added or removed, including setting a default value for each entry and specifying if the filter is optional or required. Now that the template has been created, a new scheduled query using it can be created. In the Create a New Query box, the Critical Vulnerabilities template is displayed as an option in the dropdown.

Creating a new query using Anchore templates
When the Create New Query Using Template window opens, name the query and provide an optional description.

Naming new query
Set any optional filters.

Optional query filters
Create a schedule for the report by clicking on Add Schedule. For this example, the report will be generated daily at 10:00 PM UTC time. Toggling the Enabled slider ensures that the report will be generated at the scheduled time; without enabling it, the query can be saved but it won’t automatically execute the report.

creating schedule for your report
The report can be previewed using the Preview Report from Currently Saved Query button.

Preview your new security report in Anchore

Conclusion

By using scheduled reports, users are able to automate analysis reporting for all images across their organization, making it simple to identify images affected and reduce the amount of effort needed to compile the same data. Taking it a step further, users can configure a notification to be triggered when the report is ready using email, GitHub, Jira, Slack, Teams, or a custom webhook. For more information on scheduled reports, take a look at our documentation on Using the Report Manager.

As always, you can view our documentation and installation guides here.

Anchore Scanning for Windows Container Images

With the recent release of version 2.3, Anchore Enterprise now supports scanning of Windows container images and the addition of a new feed source for identifying Windows vulnerabilities: Microsoft Security Response Center (MSRC).

MSRC

Microsoft Security Response Center maintains reports of security vulnerabilities affecting Windows systems in its Security Update Guide. In addition to publishing this data publicly on its website, Microsoft provides programmatic access to retrieve security update details in the Common Vulnerability Reporting Format via its Microsoft Security Update API. In order to access the API, users must obtain an API key using their Microsoft TechNet account.

Enabling the MSRC Feed Driver for Anchore Enterprise

In order to configure the feed source for use with Anchore Enterprise, the on-premise Enterprise Feeds Service must be enabled with the obtained API key. For instructions on how to obtain an API key from Microsoft, visit Anchore Enterprise Feed Driver Configuration.

Note: If you are upgrading an existing deployment via docker-compose, you will need to bring down the deployment WITHOUT deleting existing volume configurations (This can be completed by omitting the ‘-v’ flag via docker-compose). For Kubernetes deployments using Helm, the upgrade can be performed using the helm upgrade command.

To enable the on-premise feeds service and configure the MSRC driver on deployments using docker-compose, edit the following section of the compose template:

services:
  ...  
  feeds:
  ...
    environment:
    ...
    - ANCHORE_ENTERPRISE_FEEDS_MSRC_DRIVER_ENABLED=true
    - ANCHORE_ENTERPRISE_FEEDS_MSRC_DRIVER_API_KEY=

*For deployments using the config.yaml configuration file, update the following sections:

services:
  ...  
  feeds:
  ...
    drivers:
      msrc:
        enabled: true
        api_key: 

To enable the feeds service and the MSRC driver for Kubernetes deployments, update the following section of your custom values file:

anchore-feeds-db:
  enabled: true
  ...

anchoreEnterpriseFeeds:
  enabled: true
  ...
  # Enable microsoft feeds
  msrcDriverEnabled: true
  msrcApiKey: 
  ...

(For new deployments on Kubernetes using the stable/anchore-engine Helm chart, refer to the installation guide for instructions on deploying Anchore in your cluster).

Verify New Feed is Enabled

After bringing up the deployment, it may take a while for the feed sync to complete depending on whether or not this is a new deployment or existing upgrade. For details on checking the status of the feeds synchronization, refer to our enterprise docs.

Once the feeds have finished synchronizing, verify the MSRC feeds is included in the list:

– via Enterprise UI –
Verify new feed is enabled via Anchore UI
– or via API –
Verifying new feeds via API

Adding Windows Images

Just as with Linux containers, you can analyze a Windows container repository or tag by providing the image registry/repository/tag in the UI or via the API: anchore-cli image add

Adding Windows images in Anchore

Viewing Compliance and Vulnerabilities

Once the image analysis has completed, Anchore provides a detailed view of the image contents, vulnerability findings and compliance reports driven through policy.

Anchore vulnerability report of windows container
To produce security information for Windows images, Anchore compares the difference between the latest version (or patch set) of the base image and the image version you are scanning to generate a list of all the vulnerabilities that the image may be exposed to as disclosed by the Microsoft Research Center. In the example below, we can see the vulnerabilities Anchore identified in the image with further details on the severity of the CVE, package name and type and a link to Microsoft’s Security Update Guide for more details on the finding.

CVE analysis of windows containers

With the addition of support for Windows container image scanning, you can integrate Anchore into your container-based workflows for your Windows images and leverage our policy engine to enforce compliance.

Anchore Enterprise 2.3 Feature Series – NuGet Package Support

With the release of Anchore Enterprise 2.3, we are happy to share that you can now scan for vulnerabilities in NuGet packages inside your container images.

This new language package support is made possible by the addition of the GitHub Security Advisories data source into Anchore. You can read more about GHSA and how to enable the feed source in Anchore in a previous post.

Viewing NuGet Feeds

Once you have successfully configured the GitHub Security Advisories feeds in your Anchore installation, you can view the status of the feeds synchronization via the Anchore CLI by running the `anchore-cli system feeds list` command, or by navigating to the ‘System’ view in the Anchore Enterprise UI (see below).

feed sync view nuget packages

Viewing NuGet packages

With NuGet, just as with any identified package (OS and non-OS), Anchore provides the name, version, location, origin, and license of each identified package easily accessible via the API or UI in Anchore Enterprise (see below).
viewing NuGet packages in Anchore
This data is also accessible via the Anchore CLI by running: `anchore-cli image content mcr.microsoft.com/dotnet/core/sdk:2.1.805-nanoserver-1809 nuget`

Viewing Compliance and Vulnerabilities

Anchore also provides detailed compliance reports driven through policy. Anchore policies allow users to specify which checks to perform on what images and how the results should be interpreted. A policy is expressed as a policy bundle, which is made up of a set of rules that are used to perform an evaluation on a container image. The rules can define checks against an image for things such as security vulnerabilities, package whitelist and blacklists, configuration file contents, presence of credentials in an image, image manifest changes, exposed ports, and more.

In the example below, we can see that Medium severity vulnerabilities have been identified in NuGet packages present in the container image. The policy rule definition has been created to associate a WARN action when vulnerabilities of Medium severity are flagged.

vulnerability status NuGet packages
Finally, to find out more information surrounding the nature of these GHSAs, Anchore users can simply click on the link which, in this case, will take them to the GitHub Security Advisories page where a description of the issue is described in more detail (example).
NuGet packages in GitHub
At Anchore, we strive to provide comprehensive, actionable vulnerability identification that enables development without compromising security. The addition of NuGet package support allows users to find vulnerabilities in their .NET applications more quickly, highlighting the value of shifting security further to the left.

As always, you can view our documentation and installation guides for more information

Risk and Reward, Container Security in the Swiss Banking Sector

There’s an odd mix of fearlessness and fear that surrounds our constant need for innovation in modern business.

It takes courage to risk striking out in a new direction, turning your back on the perceived stability of the status quo. And yet, in many industries, the compulsion for innovation is fuelled by a very real fear of getting left behind.

Building on over 150 years of secure Swiss banking heritage, Hypothekarbank Lenzburg (HBL) feels these conflicting pressures more than most. But this hasn’t stopped its technology team from leading the Swiss banking sector in new, risk-fraught areas such as blockchain and open banking.

The recent pace of growth and innovation at HBL was fueled by bountiful new CI/CD pipelines, built on containerization and Kubernetes. However, this had also opened up very real risks for the bank’s operational security and stability:

“More and more of our software, from both internal and external developers, is now delivered as containers. This made it very hard for our traditional vulnerability management solution to keep up because it couldn’t scan containers efficiently,” explains Sascha Kaufmann, Head of IT Security at HBL, in our latest case study.

When HBL looked at solving this new challenge, it soon became clear that a conservative attitude towards IT security was actually the most dangerous approach.

Existing, tried-and-tested security vendors were unable to keep pace with the speed of container-based development. And the bold changes the organization had embraced by adopting cloud-native development, demanded a new security solution built for this new environment.

The real surprise for HBL was that in taking a new and dedicated approach to container security, the team turned an area of unacceptable risk into a pillar of strengthened security for the bank moving forward.

Discover DevSecOps at work in the banking sector with our latest case study.

Container Security for Government Information Systems

Over the last year, we received great feedback from our customers regarding our Container Security for U.S. Government Information Systems white paper. Today, we are publishing version 2.0, which updates and expands upon last year’s document.

The two central challenges for Federal organizations remain the same:

  1. Security and compliance guidelines are increasing in both urgency and complexity
  2. Development velocity must not be sacrificed in the pursuit of stronger security

Anchore helps Federal organizations address those two competing needs by providing technologies and services that integrate container security scanning into the development process so that development velocity can be maintained while meeting security requirements prior to launching code into runtime.

In version 2.0 of this paper, we dive further into topics such as:

  1. Using approved container parent images
  2. Protecting against supply chain attacks
  3. Leveraging container immutability for increased security
  4. Expressing security policy as code

To learn more about these topics and Anchore’s guidance for Federal, read our updated Container Security for U.S. Government Information Systems white paper

Anchore 2.3 Feature Series – GitHub Security Advisories

With the release of Anchore Enterprise 2.3 (built upon Anchore Engine v0.7.1), we are happy to announce a new feed provider: GitHub Security Advisories (GHSA).

GHSAs are another source of data that Anchore uses to match vulnerabilities to packages within a container. In this post, we will look into what GHSAs include, describe how Anchore use them, and walk through an example GitHub Action using Anchore to identify vulnerabilities from GHSAs.

GHSA Explained

As described in About GitHub Security Advisories, GHSAs allow code maintainers to privately discuss and fix security issues in their projects, and upon completion of a fix, publish the advisory to the project’s community. In turn, by publishing security advisories, maintainers make it easier for their communities to update affected packages and further investigate the impact of the vulnerability.

GHSA Under the Hood

GitHub is an authorized CVE Numbering Authority (CNA) and GHSAs created can optionally include an existing CVE reference or request that one be assigned through GitHub. When a new advisory is filed with GitHub, it is reviewed and pushed to the GitHub Advisory Database. Anchore uses this database as an upstream feed data source, allowing us to match vulnerabilities with the most up-to-date vulnerability data available.

For more information on CVEs, check out the blog by Anchore’s very own Hayden Smith on Why We Care About CVEs.

GHSA as an Anchore Feed Provider

Anchore uses GHSAs to match potential vulnerabilities for the following supported language types:

  • Java
  • Python
  • Ruby
  • Gem

GHSAs also give us a preview of NuGet (.NET) vulnerabilities, allowing Anchore to discover NuGet packages as part of the image analysis process. Including language packages during image inspection makes Anchore more than just a tool to identify CVEs, it allows fine-grained control over what is included in an image through policies as well.

Enabling the GitHub Feed Driver for Anchore Enterprise

GHSA is a publicly available feed source with an open API that requires that users generate a Personal Access Token (PAT) from their GitHub account. While GHSA is a feed source included in the open source Anchore Engine version, enabling the GHSA feed driver within Anchore Enterprise requires the PAT to be configured in the on-premise Enterprise Feeds Service; no other special permission or scoping is required.

For a full overview and instructions on how to generate and enable the GHSA Feed Driver within Anchore, please refer to Anchore Enterprise Feed Driver Configuration to begin using GHSA feeds in your deployment.

GitHub Scan Action with Anchore and GHSA

A seamless way to integrate Anchore with GHSA feeds is to use the Github Scan Action. Check out Anchore’s GitHub Scan Action for more information on using Anchore within GitHub’s CI/CD.

We begin by creating a Dockerfile that installs a package with a known GHSA vulnerability:

FROM docker.io/python:3.8.0a3

RUN pip install aubio-0.4.8

CMD echo "This is just a test"

Then we add it to a GitHub repository with the following Scan Action defined:

name: Docker Image CI
on: [push]
jobs:
  build:
    runs-on: ubuntu-latest
    steps:
    - uses: actions/checkout@v1
    - name: Build the Docker image
      run: docker build . --file Dockerfile --tag localbuild/testimage:latest
    - uses: anchore/scan-action@master
      with:
        image-reference: "localbuild/testimage:latest"
        dockerfile-path: "./Dockerfile"
        fail-build: true
    - name: anchore inline scan JSON results
      run: for j in `ls ./anchore-reports/*.json`; do echo "---- ${j} ----"; cat ${j}; echo; done

We are able to see that the Anchore Scan Action identifies multiple vulnerabilities. Let’s drill down on a known vulnerability identified as `GHSA-grmf-4fq6-2r79`:

From the scan results, we can see that GHSA is flagging a Mercurial Python package. It provides a link to the GHSA where we can see details about the vulnerability:

From here, end users can determine the best approach to remediation according to their organizational needs.

At Anchore, we strive to provide comprehensive, actionable vulnerability identification that enables development without compromising security. The addition of GHSA as a feed data provider allows users to find vulnerabilities more quickly, highlighting the value of shifting security further to the left.

Introducing Anchore Enterprise 2.3

Today, we announced the availability of Anchore Enterprise 2.3 for our enterprise and federal government customers.

Keeping to a 4-month development cycle since our last release, 2.3 includes some big new features that see expanded coverage for Windows containers and .NET packages as the headline. Microsoft is the original developer-champion; combined with their acquisition of GitHub, another ecosystem we are deepening support for, they are critical to the adoption of DevSecOps that is at the heart of Anchore’s mission.

Many thanks to the folks at Microsoft and GitHub who helped us with the features in the release, and well done to the engineering team for getting out the release despite the distraction and stresses of the pandemic.

Read about this release here, or view this webinar covering all the features of 2.3.

Support for Windows Containers

While Linux containers continue to represent the lion’s share of containers on Docker Hub and in production, Microsoft has been enthusiastic supporters of containers for Windows since 2016 when they released the first Windows container. Last year, Windows officially became supported on various distributions of Kubernetes.

As of 2.3, Anchore Enterprise can now inspect, scan and enforce policies across Windows containers, the same way we support Linux containers.  We perform a deep inspection of the entire image, cataloging all the files and their metadata to produce a software bill of materials (SBOM). These can be viewed in the Files tab of our UI or via the API, just as you can browse a Linux image.

Once we have this analysis, we then perform our security assessment. Unlike Linux images, which are collections of multiple packages, each with their own version information, Windows container images are more monolithic. That means the security information for the base OS is produced slightly differently. By comparing the difference between the latest version (or patch set) of the base image and the version you are scanning, we generate a list of all the vulnerabilities that you may be exposed to as disclosed by the Microsoft Research Center. Vulnerability checks, along with all of the other policy gates available in Anchore, can be applied to Windows images.

In addition to the OS vulnerabilities, Anchore Enterprise will also report on any additional language vulnerabilities for Python, Ruby, Node or Java apps layered on top of the base image. Of course, the most common application framework used with Windows is .NET which we are also now able to offer in Tech Preview.

Vulnerability Scanning for Nuget Packages (Tech Preview)

Nuget is a popular package management system for handling .NET packages. Sponsored by Microsoft, it is run as a community project and functions identically to other language packaging systems like npm, pip or gem that provide a central repository for libraries and add-ons.

Anchore Enterprise will now scan for Nuget package indexes and map .NET package versions against disclosed vulnerabilities, both on Linux or Windows containers. A new Nuget tab can be seen via our UI and is available as an option via the API which allows you to see what packages are installed.

Unlike npm or Python, there is less curation and centralization of security issues in the Nuget community. Individual contributors are left to decide how they want to manage their security notices. For the 2.3 release, we have chosen vulnerability sources that have the highest volume of disclosures and are making this feature available as Tech Preview so we can assess the coverage this provides for customer applications. As new sources become available, we will look to include them in future releases.

GitHub Security Database and Red Hat CVE Database

Last November, GitHub made several security announcements. Most notable was their ability to create CVEs directly from within their product and the availability of a security database that aggregated these CVEs and any other advisories created by hosted projects.

Anchore Enterprise now uses the GitHub Security Database as part of our aggregated vulnerability feed alongside other open and proprietary data sources. Customers should see more vulnerabilities being reported, especially where the source code software originates on GitHub. We really like the security workflows being embedded into GitHub and hope the communities of open source projects will use them to create a high fidelity database over time.

We’ve also switched to using the Red Hat CVE database as our primary source for all things RHEL-related. Previously we were using Red Hat Security Advisories which only provided notice of resolved issues and the products affected. The CVE database provides more information about issues that Red Hat has marked as “won’t fix” and uses CVE as the primary key, making it easier to manage policies using just CVE rules.

User Interface Improvements: Scheduled Reports and Event Management

One of the key differentiators for Anchore compared to other security tools is our ability to produce highly customizable reports that allow security teams to get a clear picture of their risks. Under the hood, we use GraphQL but our UI makes the process of creating a report much easier. Until now, these reports were created ad-hoc. With 2.3, reporting templates can be created and then scheduled for automatic creation. A notification can be configured via email, Slack, MS Teams or other methods, to notify you of the report’s availability.

Finally, we have also added an event management system to help admins more easily scan the system logs, find errors and prune old entries directly from within the UI.

Looking Forward

As ever, we look forward to hearing feedback from our open source community, commercial customers and partners. Don’t forget to join our community Slack channel as we discuss features for the next release due later in the year.

Getting Started With Anchore Policy Bundles

In order to shift security left in the development lifecycle without compromising production velocity, security requirements must be automated and embedded into continuous integration / continuous delivery workflows. Organizations can achieve this through the automated implementation, verification, remediation, monitoring and reporting of compliance into the development pipeline. Furthermore, organizations can manage security requirements in code repositories like any other piece of code using Anchore policy bundles.

How does Anchore Help Achieve this?

At Anchore, our focus is to help organizations embed compliance requirements into their containerized environments, establishing security guardrails earlier in the development pipeline.

CVE scanning allows developers to be proactive about security as they will get a near-immediate feedback loop on potentially vulnerable images. As developers add container images to the build pipeline, Anchore image scanning will scan the contents of the image to identify any known vulnerabilities in the container images. Taking this a step further, security and development teams can build policies according to security requirements and evaluate each image in the pipeline against these policies. This adds a layer of control to the images being scanned and facilitates the ability to decide which images should be promoted into production environments.

Components of a Policy Bundle

Anchore policy bundles (structured as JSON documents) are essentially the unit of policy definition and evaluation for your organization’s requirements.

A policy bundle consists of:

1. Policies: A set of rules to evaluate against an image and recommended actions if a match is found. Detail on these rules can be found in our documentation. A policy or whitelist can be used to evaluate an image against the following criteria:

  • Security vulnerabilities
  • Package whitelists and blacklists
  • Configuration file contents
  • Presence of credentials in an image
  • Image manifest changes
  • Exposed ports
  • Anchore policies returning a pass or fail decision result

2. Whitelists: A set of exclusions for matches found during policy evaluation. When a policy rule result is whitelisted, it is still present in the output of the policy evaluation, but it’s action is set to go and it is indicated that there was a whitelist match.

3. Mappings: Ordered rules that determine which policies and whitelists should be applied to a given container registry, repository or image at evaluation. Mappings are evaluated similar to access control lists, where the first rule matching an input is applied and any subsequent rules are ignored.

4. Whitelisted Images: Whitelisted images are images, defined by registry, repository, and tag/digest/imageId, that will always result in a pass status for bundle evaluation unless the image is also matched in the blacklisted images section.

5. Blacklisted Images: Overrides for specific images to statically set the final result of a policy evaluation to fail regardless of the actual evaluation results. Blacklisted image matches override any whitelisted image matches.

Policy Bundle Examples

Now that we’ve discussed the importance of compliance as code and how Anchore can help integrate your requirements into the container pipeline, let’s walk through some examples of how you can enforce security in your container images using Anchore policies.

Ensure a minimal base image is used

Utilizing minimal images that bundle only the necessary system tools and libraries minimizes the attack surface and ensures that you ship a secure OS.

  {
    "action": "WARN",
    "comment": "Ensure dockerfile is provided during analysis",
    "gate": "dockerfile",
    "params": [],
    "trigger": "no_dockerfile_provided"
  },
  {
    "action": "STOP",
    "comment": "Ensure a minimal base image is used",
    "gate": "dockerfile",
    "params": [
      {
        "name": "instruction",
        "value": "FROM"
      },
      {
        "name": "check",
        "value": "!="
      },
      {
        "name": "value",
        "value": "node:stretch-slim"
      },
      {
        "name": "actual_dockerfile_only",
        "value": "false"
      }
    ],
    "trigger": "instruction"
  }


Blacklist exposed ports / ensure sshd is disabled or absent

Your container applications shouldn’t be running an SSH or Telnet server. Checking the dockerfile for explicit management ports can ensure that these services are not exposed while blacklisting their associated packages can provide more enhanced security.

 {
  "action": "STOP",
  "comment": "Blacklist ssh package",
  "gate": "packages",
  "params": [
    {
      "name": "name",
      "value": "openssh-server"
    }
  ],
  "trigger": "blacklist"
},
{
  "action": "STOP",
  "comment": "Blacklist ssh package",
  "gate": "packages",
  "params": [
    {
      "name": "name",
      "value": "libssh2"
    }
  ],
  "trigger": "blacklist"
},
{
  "action": "STOP",
  "comment": "Blacklist ssh package",
  "gate": "packages",
  "params": [
    {
      "name": "name",
      "value": "libssh"
    }
  ],
  "trigger": "blacklist"
},
{
  "action": "WARN",
  "comment": "Ensure openssh configuration files are absent from image",
  "gate": "packages",
  "params": [
    {
      "name": "only_packages",
      "value": "ssh"
    },
    {
      "name": "only_directories",
      "value": "/etc/sshd"
    },
    {
      "name": "check",
      "value": "missing"
    }
  ],
  "trigger": "verify"
}

Ensure the COPY instruction is used instead of ADD

The COPY instruction copies local files recursively, given explicit source and destination files or directories.

The ADD instruction copies local files recursively, implicitly creates the destination directory if non-existant, and accepts archives as local or remote URLs as its source, which it expands or downloads respectively into the destination directory.

General best practice is to use the COPY command over ADD when copying data to your container image.

 {
  "action": "STOP",
  "comment": "The \"COPY\" instruction should be used instead of \"ADD\"",
  "gate": "dockerfile",
  "params": [
    {
      "name": "instruction",
      "value": "ADD"
    },
    {
      "name": "check",
      "value": "exists"
    },
    {
      "name": "actual_dockerfile_only",
      "value": "false"
    }
  ],
  "trigger": "instruction"
}

Checking for secrets

Secrets such as API keys and access credentials should never be present in your container image.

Scan images for AWS credentials:

  {
    "action": "STOP",
    "gate": "secret_scans",
    "params": [
      {
        "name": "content_regex_name",
        "value": "AWS_ACCESS_KEY"
      },
      {
        "name": "match_type",
        "value": "found"
      }
    ],
    "trigger": "content_regex_checks"
  }

Scan images for API keys:

  {
    "action": "STOP",
    "gate": "secret_scans",
    "params": [
      {
        "name": "content_regex_name",
        "value": "API_KEY"
      },
      {
        "name": "match_type",
        "value": "found"
      }
    ],
    "trigger": "content_regex_checks"
  }

Checking for vulnerable packages

Identifying vulnerable packages and dependencies in your container images as early as possible can improve production velocity and ensure your container applications are shipped free of bugs and malicious packages.

Blacklist malicious package identified as typo-squatting:

  {
    "action": "STOP",
    "comment": "Malicious library discovered [11.29.2019] typosquatting \"jellyfish\"",
    "gate": "packages",
    "params": [
      {
        "name": "name",
        "value": "jeIlyfish"
      }
    ],
    "trigger": "blacklist"
  },
  {
    "action": "STOP",
    "comment": "Malicious library discovered [11.29.2019] typosquatting python-dateutil",
    "gate": "packages",
    "params": [
      {
        "name": "name",
        "value": "python3-dateutil"
      }
    ],
    "trigger": "blacklist"
  }

Blacklist vulnerable package versions:

  {
    "action": "STOP",
    "comment": "Django 1.11 before 1.11.29, 2.2 before 2.2.11, and 3.0 before 3.0.4 allows SQL Injection if untrusted data is used as a tolerance parameter in GIS functions and aggregates on Oracle.",
    "gate": "packages",
    "params": [
      {
        "name": "name",
        "value": "Django"
      },
      {
        "name": "version",
        "value": "2.2.3"
      }
    ],
    "trigger": "blacklist"
  },
  {
    "action": "STOP",
    "comment": "A flaw was found in Mercurial before 4.9. It was possible to use symlinks and subrepositories to defeat Mercurial's path-checking logic and write files outside a repository",
    "gate": "packages",
    "params": [
      {
        "name": "name",
        "value": "mercurial"
      },
      {
        "name": "version",
        "value": "4.8.2"
      }
    ],
    "trigger": "blacklist"
  },
  {
    "action": "STOP",
    "comment": "Python 2.7.x through 2.7.16 and 3.x through 3.7.2 is affected by: Improper Handling of Unicode Encoding (with an incorrect netloc) during NFKC normalization",
    "gate": "packages",
    "params": [
      {
        "name": "name",
        "value": "Python"
      },
      {
        "name": "version",
        "value": "2.7.16"
      }
    ],
    "trigger": "blacklist"
  }

Remove setuid and setgid permissions

Removal of setuid and setgid permissions can prevent privilege escalation in running containers.

  {
    "action": "STOP",
    "comment": "Remove setuid and setgid permissions in the images",
    "gate": "files",
    "params": [],
    "trigger": "suid_or_guid_set"
  }


Ensure images implement use of a non-root user (UID not 0)

If not specified in the Dockerfile, a container will be executed as the root user. This is bad practice as it violates least privilege and puts the underlying docker host and any other running containers at risk.

 {
  "action": "STOP",
  "comment": "Blacklist root user (uid 0)",
  "gate": "retrieved_files",
  "params": [
    {
      "name": "path",
      "value": "/etc/passwd"
    },
    {
      "name": "check",
      "value": "match"
    },
    {
      "name": "regex",
      "value": "root:x:0:0:root:/root:/bin/bash"
    }
  ],
  "trigger": "content_regex"
},
{
  "action": "STOP",
  "comment": "Ensure user \"root\" is not explicitly referenced in Dockerfile",
  "gate": "dockerfile",
  "params": [
    {
      "name": "users",
      "value": "root"
    },
    {
      "name": "type",
      "value": "blacklist"
    }
  ],
  "trigger": "effective_user"
}

Enforce PID Limits

Enforcing PID limits minimizes the number of processes running in each container. Limiting the number of processes in the container prevents excessive spawning of new processes, lateral movement, fork bombs (processes that continually replicate themselves) and anomalous processes.

  {
    "action": "STOP",
    "comment": "Enforce PID Limits",
    "gate": "retrieved_files",
    "params": [
      {
        "name": "path",
        "value": "/proc/sys/kernel/pid_max"
      },
      {
        "name": "check",
        "value": "match"
      },
      {
        "name": "regex",
        "value": "256"
      }
    ],
    "trigger": "content_regex"
  }

Identify unusually large images

Auditing the size of your container images can help identify any anomalies such unsanctioned packages or files that have been added to the image.

  {
    "action": "WARN",
    "comment": "Warn on image size",
    "gate": "metadata",
    "params": [
      {
        "name": "attribute",
        "value": "size"
      },
      {
        "name": "check",
        "value": ">"
      },
      {
        "name": "value",
        "value": "125000"
      }
    ],
    "trigger": "attribute"
  }

Blacklist unapproved licenses found in a container image

Container images can contain thousands of OS files and packages from open source libraries. Identifying the licenses governing these packages can ensure your organization maintains legal compliance.

  {
    "action": "WARN",
    "comment": "Warn on presence of unapproved licenses",
    "gate": "licenses",
    "params": [
      {
        "name": "licenses",
        "value": "GPLv2+, GPL-3+"
      }
    ],
    "trigger": "blacklist_exact_match"
  }

Conclusion

These policies are basic, but can help you get started with Anchore policies. Using them, you can establish a security baseline that improves over time. To learn more, visit our documentation.

The entire policy, when assembled, looks like this:

{
    "description": "",
    "name": "anchore-policy-blog",
    "policies": [
      {
        "comment": "",
        "name": "General Checks",
        "rules": [
          {
            "action": "WARN",
            "comment": "Warn on image size",
            "gate": "metadata",
            "params": [
              {
                "name": "attribute",
                "value": "size"
              },
              {
                "name": "check",
                "value": ">"
              },
              {
                "name": "value",
                "value": "125000"
              }
            ],
            "trigger": "attribute"
          },
          {
            "action": "WARN",
            "comment": "Warn on presence of unapproved licenses",
            "gate": "licenses",
            "params": [
              {
                "name": "licenses",
                "value": "GPLv2+, GPL-3+"
              }
            ],
            "trigger": "blacklist_exact_match"
          }
        ],
        "version": "1_0"
      },
      {
        "comment": "",
        "name": "File System Checks",
        "rules": [
          {
            "action": "STOP",
            "comment": "Remove setuid and setgid permissions in the images",
            "gate": "files",
            "params": [],
            "trigger": "suid_or_guid_set"
          },
          {
            "action": "STOP",
            "comment": "Blacklist root user (uid 0)",
            "gate": "passwd_file",
            "params": [
              {
                "name": "user_ids",
                "value": "0"
              }
            ],
            "trigger": "blacklist_userids"
          },
          {
            "action": "STOP",
            "comment": "Blacklist ssh package",
            "gate": "packages",
            "params": [
              {
                "name": "name",
                "value": "openssh-server"
              }
            ],
            "trigger": "blacklist"
          },
          {
            "action": "STOP",
            "comment": "Blacklist ssh package",
            "gate": "packages",
            "params": [
              {
                "name": "name",
                "value": "libssh2"
              }
            ],
            "trigger": "blacklist"
          },
          {
            "action": "STOP",
            "comment": "Blacklist ssh package",
            "gate": "packages",
            "params": [
              {
                "name": "name",
                "value": "libssh"
              }
            ],
            "trigger": "blacklist"
          },
          {
            "action": "WARN",
            "comment": "Ensure openssh configuration files are absent from image",
            "gate": "packages",
            "params": [
              {
                "name": "only_packages",
                "value": "ssh"
              },
              {
                "name": "only_directories",
                "value": "/etc/sshd"
              },
              {
                "name": "check",
                "value": "missing"
              }
            ],
            "trigger": "verify"
          },
          {
            "action": "STOP",
            "comment": "Enforce PID Limits",
            "gate": "retrieved_files",
            "params": [
              {
                "name": "path",
                "value": "/proc/sys/kernel/pid_max"
              },
              {
                "name": "check",
                "value": "match"
              },
              {
                "name": "regex",
                "value": "256"
              }
            ],
            "trigger": "content_regex"
          }
        ],
        "version": "1_0"
      },
      {
        "comment": "Blacklist vulnerable packages",
        "name": "Vulnerable Packages",
        "rules": [
          {
            "action": "STOP",
            "comment": "Django 1.11 before 1.11.29, 2.2 before 2.2.11, and 3.0 before 3.0.4 allows SQL Injection if untrusted data is used as a tolerance parameter in GIS functions and aggregates on Oracle.",
            "gate": "packages",
            "params": [
              {
                "name": "name",
                "value": "Django"
              },
              {
                "name": "version",
                "value": "2.2.3"
              }
            ],
            "trigger": "blacklist"
          },
          {
            "action": "STOP",
            "comment": "A flaw was found in Mercurial before 4.9. It was possible to use symlinks and subrepositories to defeat Mercurial's path-checking logic and write files outside a repository",
            "gate": "packages",
            "params": [
              {
                "name": "name",
                "value": "mercurial"
              },
              {
                "name": "version",
                "value": "4.8.2"
              }
            ],
            "trigger": "blacklist"
          },
          {
            "action": "STOP",
            "comment": "Python 2.7.x through 2.7.16 and 3.x through 3.7.2 is affected by: Improper Handling of Unicode Encoding (with an incorrect netloc) during NFKC normalization",
            "gate": "packages",
            "params": [
              {
                "name": "name",
                "value": "Python"
              },
              {
                "name": "version",
                "value": "2.7.16"
              }
            ],
            "trigger": "blacklist"
          }
        ],
        "version": "1_0"
      },
      {
        "comment": "Blacklist malicious package types",
        "name": "Malicious Packages",
        "rules": [
          {
            "action": "STOP",
            "comment": "Malicious library discovered [11.29.2019] typosquatting \"jellyfish\"",
            "gate": "packages",
            "params": [
              {
                "name": "name",
                "value": "jeIlyfish"
              }
            ],
            "trigger": "blacklist"
          },
          {
            "action": "STOP",
            "comment": "Malicious library discovered [11.29.2019] typosquatting python-dateutil",
            "gate": "packages",
            "params": [
              {
                "name": "name",
                "value": "python3-dateutil"
              }
            ],
            "trigger": "blacklist"
          }
        ],
        "version": "1_0"
      },
      {
        "comment": "Dockerfile security checks",
        "name": "Dockerfile Checks",
        "rules": [
          {
            "action": "STOP",
            "comment": "The \"COPY\" instruction should be used instead of \"ADD\"",
            "gate": "dockerfile",
            "params": [
              {
                "name": "instruction",
                "value": "ADD"
              },
              {
                "name": "check",
                "value": "exists"
              },
              {
                "name": "actual_dockerfile_only",
                "value": "false"
              }
            ],
            "trigger": "instruction"
          },
          {
            "action": "STOP",
            "comment": "Blacklist SSH & Telnet ports",
            "gate": "dockerfile",
            "params": [
              {
                "name": "ports",
                "value": "22,23"
              },
              {
                "name": "type",
                "value": "blacklist"
              },
              {
                "name": "actual_dockerfile_only",
                "value": "false"
              }
            ],
            "trigger": "exposed_ports"
          },
          {
            "action": "STOP",
            "comment": "Ensure dockerfile is provided during analysis",
            "gate": "dockerfile",
            "params": [],
            "trigger": "no_dockerfile_provided"
          },
          {
            "action": "STOP",
            "comment": "Ensure a minimal base image is used",
            "gate": "dockerfile",
            "params": [
              {
                "name": "instruction",
                "value": "FROM"
              },
              {
                "name": "check",
                "value": "!="
              },
              {
                "name": "value",
                "value": "node:stretch-slim"
              },
              {
                "name": "actual_dockerfile_only",
                "value": "false"
              }
            ],
            "trigger": "instruction"
          }
        ],
        "version": "1_0"
      }
    ],
    "version": "1_0"
  }

Building a DevSecOps Platform with the U.S. Air Force

When I arrived at Anchore, I joined an amazing group of engineers working to turn a bunch of slides into a tangible reality for the U.S. Air Force (USAF) and U.S. Department of Defense (DoD).
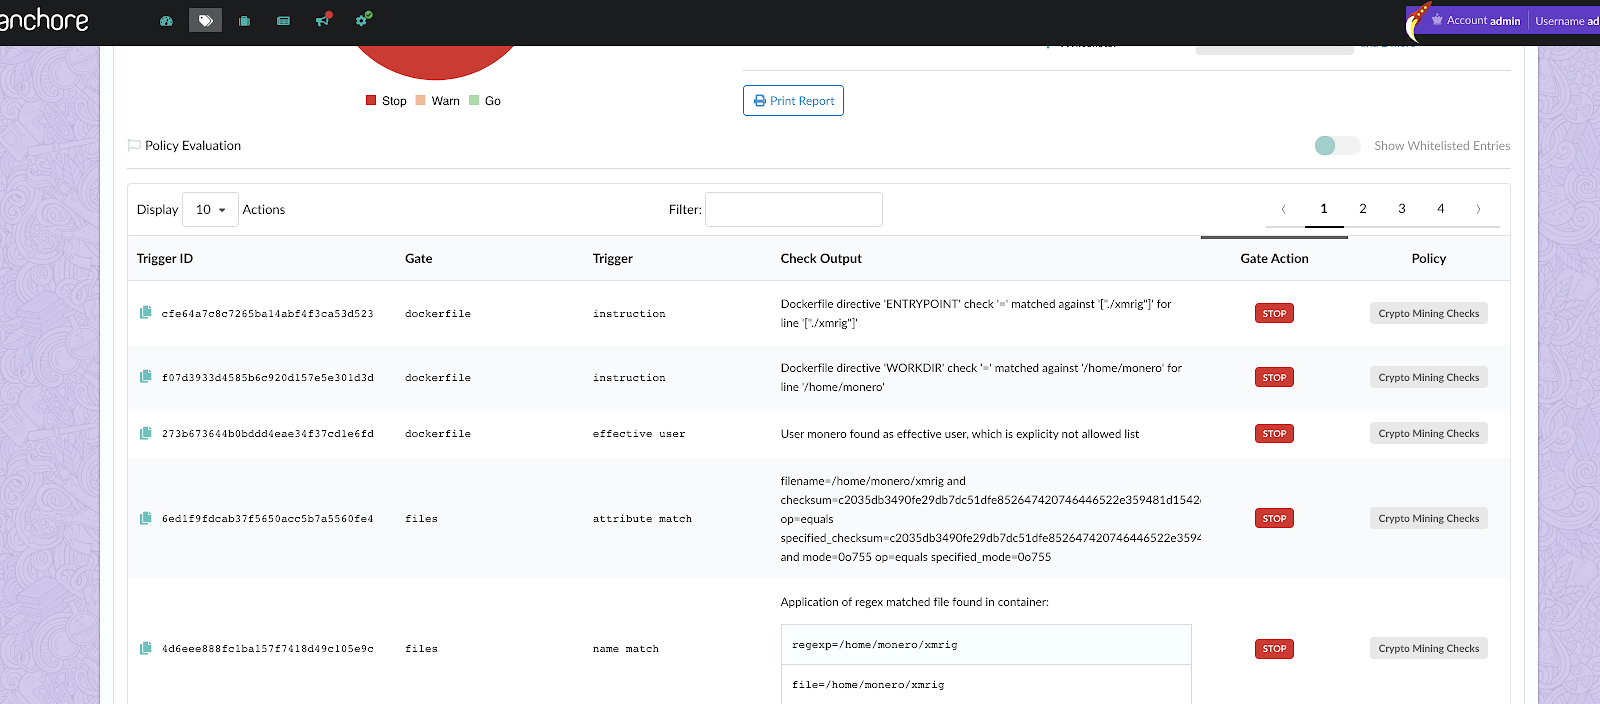
Our team of engineers at Anchore quickly became immersed in our first engagement with the DoD, along with Red Hat North American Public Sector consultants. During our initial onboarding, the DevSecOps Platform and Container Hardening teams faced multiple challenges. We had to build Platform One, a secure platform 100% based on OCI compliant images running on Kubernetes. In order to have Platform One running on secure images, we needed to harden and scan 170+ containers from hundreds of different vendors with Anchore. In addition, the USAF needed the image scanning to happen in an automated fashion. The goal was to have a DevSecOps pipeline that “bakes in” 100% of the DoD’s security and compliance checks before anything gets deployed to Kubernetes.
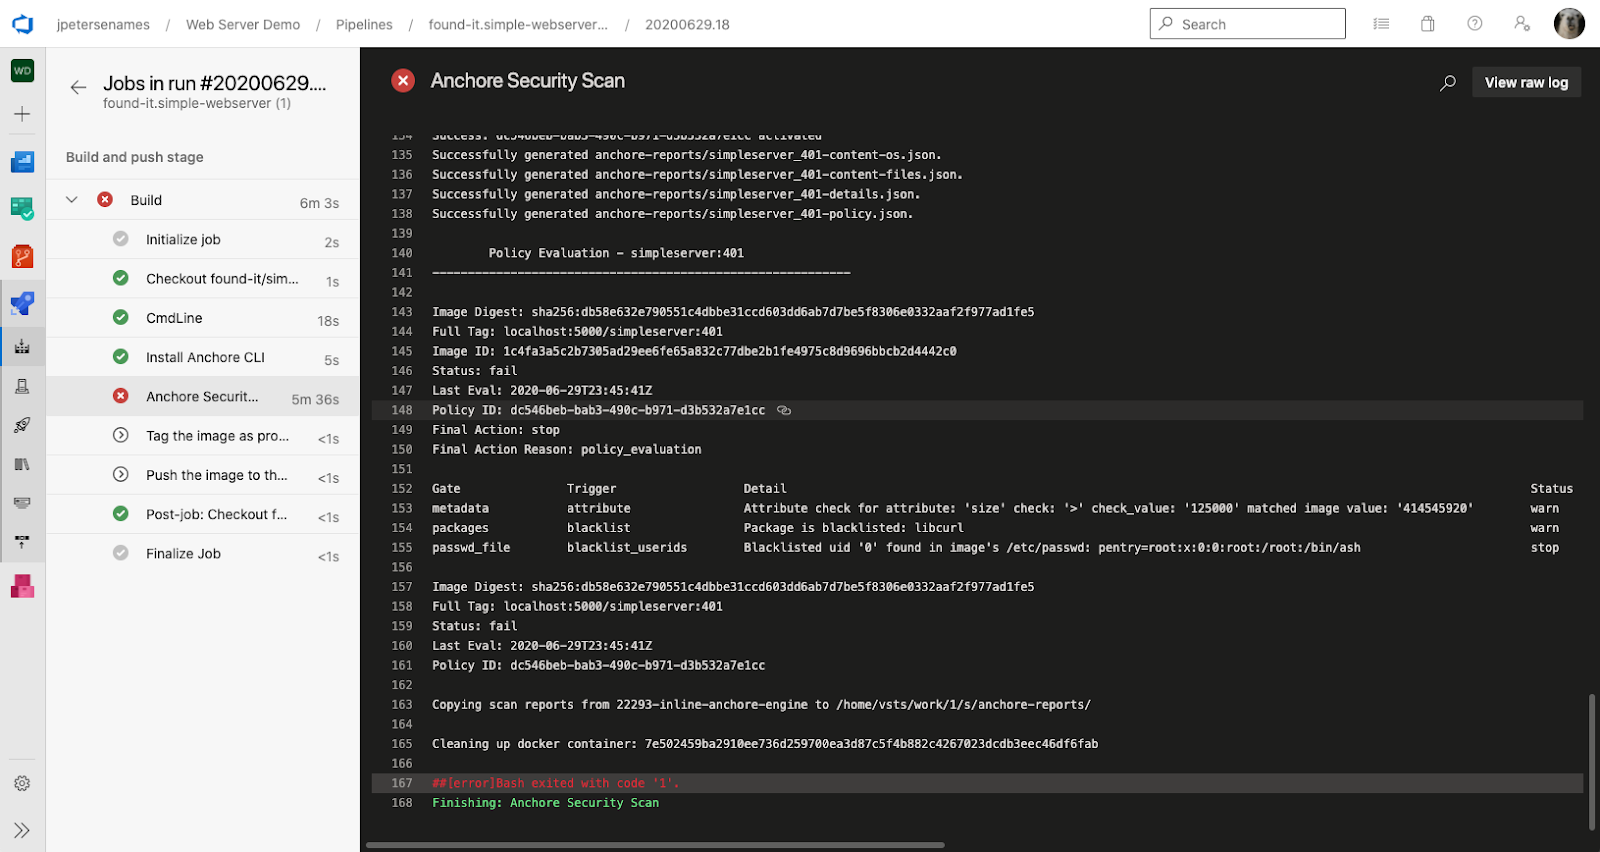
The Platform One project has broken new ground in many ways, such as insider threat checks on container images via Anchore and the integration of an entire security pipeline specific to container images. In many respects, the capabilities we have helped develop in the Platform One project surpass even those of our enterprise customers.

For most enterprise customers, adopting DevOps and implementing CI/CD gives them the capability to push new code continuously so that the latest version of their enterprise software is available to customers. For the USAF, the goal isn’t just to have unparalleled deployment velocity that enables them to deploy the latest software to fighter aircraft across the globe. They also need additional layers of security with a zero trust model, monitoring for insider threat within the software supply chain, and integration of strict software security best practices into container images.

This is a huge advancement – not just for the Air Force, but any service branch within the DoD. Any user can download pre-hardened, OCI-compliant images from Iron Bank, also known as the DoD Centralized Artifact Repository, which stores all of the images secured by the Container Hardening team. DoD users can use these containers to create their own software factories for their respective missions. The consumption of Iron Bank images saves a ton of time and resources that would be needed to build a DevSecOps pipeline from scratch. Developers can now focus on developing, not having to worry about typical STIGs, security, and compliance checks. The Platform One team, with help from Anchore and Red Hat, has taken care of them for you.

Read more about the Platform One and container hardening journey that have taken with our partners at Red Hat in our joint case study.

Anchore Enterprise in the Red Hat Marketplace

Anchore Enterprise is now available through Red Hat Marketplace, an open cloud marketplace that makes it easier to discover and access certified software for container-based environments across the hybrid cloud.

Built in partnership by Red Hat and IBM, Red Hat Marketplace is designed to make it easy for developers, procurement teams and IT leaders to gain access to popular enterprise software. The software in the marketplace has all been tested and certified for Red Hat OpenShift Container Platform, so it runs anywhere OpenShift runs.

We think it’s important to know what’s inside the containers you build and ship. That’s why you should integrate deep container image inspection into every stage of the DevOps workflow. At Anchore, our mission is to make sure that’s easy. We are excited to offer Anchore Enterprise through the Red Hat Marketplace so it can be seamlessly discovered and deployed by software builders everywhere.

This has been a big week for our friendship with Red Hat! Just yesterday we released Development at Mach One, a white paper documenting our recent shared mission implementing DevSecOps with the United States Air Force. Read it to learn how powerful Anchore and Red Hat are when we work together with our customers. Then visit out our Red Hat Marketplace entry to get started with Anchore Enterprise today.

Development at Mach Speed, A Case Study

For a little over a year now, engineers at Anchore have been working alongside our friends at Red Hat on an important mission: helping the United States Department of Defense reinvent the way they consume, build, and deploy software.

The DoD, just like any major organization, builds and ships a lot of software. This software runs on all kinds of devices, from everyday smartphones to extremely specialized equipment. They have teams of developers working to maintain it all, supported by a network of vendors, consultants, and contractors. There is constant pressure to keep the pace of innovation up. But here’s where the similarities with typical organizations end: when a breach occurs, they stand to lose a whole lot more than just a customer. The DoD’s software ensures the success of critical missions, and that can mean life or death.

The answer lies in DevSecOps: the integration of security best practices into a fast-moving development process, using policy-driven automation to create a high level of confidence.

Our teams worked with the DoD to implement a flexible, container-based platform for software delivery powered by Red Hat OpenShift and Anchore Enterprise. With this platform, the DoD can maintain a streamlined, zero-trust security and compliance posture while releasing new software as frequently as mission conditions require.

To learn more about this project, download our free in depth case study.

Why We Care About CVEs

Common Vulnerabilities and Exposures, or “CVEs”, are identifiers for specific vulnerabilities. MITRE defines its CVE list as a “dictionary of publicly disclosed cybersecurity vulnerabilities and exposures that is free to search, use, and incorporate into products and services.” The CVE list feeds into the National Vulnerability Database (NVD).

CVEs allow teams to track vulnerabilities that directly impact their system. In modern DevSecOps environments, it is common for CVE’s to be discovered during both build and runtime. A CVE matters because it provides traceability for each vulnerability that adversely impacts software. It is a way to describe and manage a discrete vulnerability. The name of a CVE simply provides the year each vulnerability was detected, which is useful. But the truly impactful part of each CVE as it matters to our everyday users come from the data and various scoring methods associated with each one. The scoring, description, and intelligence associated with each CVE are far more important than the CVE identifier itself.

Anchore includes CVEs in our report generation as they are the primary way our customers trace the impact of a vulnerability on their images. In many popular attacks against container images, attackers focus on the software supply chain (such as storing malicious images in container registries, typosquatting attacks on packages/images, etc.) rather than probing an existing system for a specifically available exploit in a running image. That being said, beyond their value in identifying and tracking specific vulnerabilities, they lack the information required for a security team to take action.

So Now What?

But how does Anchore incorporate the importance of a CVE into their product? What can your team do to be more proactive with container security?

Your security team can definitely help prevent typosquatting (see a good story at The New Stack about typosquatting and the dangers associated) and the downloading of malicious (accidentally, hopefully) images by your developers. Anchore can both help with supply chain oriented attacks in addition to taking the information we know about CVEs and using that as actionable data in our scanning policy.

Whitelist/Blacklist Your Images and Packages

To prevent this, Anchore easily provides the ability to blacklist images that may be suspicious, malicious, or simply up to no good in a public container registry. Navigate to your “policy tab”, select Edit Policy, then navigate to the whitelisted blacklisting images tab here:

Under blacklisted images, you can select “let’s add one.” You will see the screen below that allows you to add an image based on name (providing the registry, repo, and tag), by image ID, or by SHA digest. Blacklisting assumes you already know what is malicious and what is not. A more proactive approach would be whitelisting ONLY the images you want to use so that any other images, malicious or otherwise, are flagged for review in Anchore before they hit production. You also have the option to take this a step further and whitelist/blacklist specific packages for your organization to prevent typosquatting attacks.

Similarly, typosquatting attacks can happen on URLs, images, and even individual packages as was the case here where python packages contained legitimate code but had a setup.py script that would gather hostname and user information that would be sent back to another system. To prevent these unfortunate events from occurring in your container workloads, Anchore provides the ability to inspect your packages and blacklist specific package contents. You can view package contents here to understand the complete packages and files within your image to hunt for potentially malicious packages that wouldn’t be identified by a CVE.

Anchore allows you to make user-defined policy so you can easily blacklist malicious packages that are independently discovered by your security team or a part of any threat intelligence you are acting upon.  You can do this by navigating to policy checks and either adding to an existing policy or creating a new one. For this example, I will create a specific policy called “Typosquatting Checks” here:

I will then tailor this policy for specific known malicious packages that may be impersonating legitimate packages, and create a stop action in Anchore for any image that contains a malicious/fake package as seen here where we blacklist urlib3 (malicious package) that is impersonating urllib3 (legitimate package).

Don’t Boil the CVE Ocean: Incorporate CVSS Scoring into Scanning

Another more proactive way to tackle the management of CVEs in your environment, albeit not perfect given some flaws of scoring, is to integrate scoring into your scanning policy. The Common Vulnerability Scoring System (CVSS) is “an open framework for communicating the characteristics and severity of software vulnerabilities.” A way of explaining this is depicted below:

Source: NVD

At a high level, you can correlate a CVE with its CVSS score to determine which CVEs have the greatest impact on your system by looking at two things:

  1. Exploitability
  2. Impact

The higher the score on either of these factors, the more concern it should have for your security team. If a CVE has a very high exploitation score of a 9.5, but has a very low impact with a score of 2.0 then maybe it shouldn’t be a high priority. The same is true if you have a high impact score, but low exploitation score, which can commonly be the case if an attack vector isn’t widely available or if certain privileges are required in order to execute the attack and actually exploit the vulnerability. There are many other things that should be looked at when assessing vulnerability exploitation such as attack vectors, associated privileges, and attack complexity.

We put the power in the hands of the security teams to define the terms of policy enforcement for their container images. One way to make an intuitive policy using Anchore is to click “Add New Policy.”

There are 10+ selectors you can use to create your policy, such as CVSS base score, exploitability score, impact score, and fix availability.

This way, you aren’t scanning “just to scan” and check the compliance box for your next audit. You are scanning proactively, using a collection of user-defined acceptance rule checks to generate an actionable list of vulnerability and compliance findings immediately addressable by your security team.  By taking these steps, your teams can gain more security insight about the containers they are using instead of routinely gathering the CVE’s and attempting to solve your security woes by boiling the entire “CVE ocean.”

Anchore and GitHub Actions, A Tutorial

In this blog we’re going to show you how, with very little code, you can add robust security scanning, alerting and reporting to your existing GitHub projects.

(If you don’t get why, check out our GitHub Actions intro blog for some more background).

First, go into your Github repository and find the Action tab; it should be about midway along, as shown in the screenshot below:

If you’ve not set up any actions in this repo before, you’ll be greeted by the default setup screen.

We’re going to skip this by selecting the option on the left-hand side titled, ‘set up this workflow yourself’. This link takes us to the Action editor. You’ll find it has some example code already in place. So, go ahead and replace it with the following workflow:

name: Anchore Scan
on: [push]
jobs:
  build:
    runs-on: ubuntu-latest
    steps:
    - uses: actions/checkout@v1
    - name: Docker Build
      run: docker build . --file Dockerfile --tag testrepo/testimage:latest
    - uses: anchore/scan-action@v1
      with:
        image-reference: "testrepo/testimage:latest"
        dockerfile-path: "./Dockerfile"
        fail-build: true

If you are unfamiliar with Github Action syntax, you can find an excellent guide here.

In this workflow, we are creating a job called ‘Anchore Scan’, and setting it to scan every time that code is pushed into the repository. In addition, we are checking out our source code into an Ubuntu container and building a container based on a Dockerfile found in the root of the project.

Once the container is built, we then utilize Anchore Engine by calling the anchore/scan-action integration. As you can see, the scan-action takes three parameters:

First, image-reference, refers to the tag of the Docker image we created in the previous step.

Next, the dockerfile-path, highlights the Dockerfile, within the source code that is used to build it.

Finally, we have the fail-build. This option marks the action as failed if Anchore Engine finds anything in breach of its default policy.

This workflow is already looking pretty good, but we’re going to take it a step further and post a Slack alert for failures, offering us interactive feedback on security issues.

For the next step, you’ll need a slack incoming webhook.

Once you have the webhook, add it as a secret to your Github repository by going into Settings and then Secrets in your repository settings. Name the secret SLACK_WEBHOOK, and then add the following code to the workflow:

  - name: Send alert
      if: failure()
      uses: rtCamp/[email protected]
      env:
        SLACK_CHANNEL: general
        SLACK_COLOR: '#3278BD'
        SLACK_ICON: https://github.com/rtCamp.png?size=48
        SLACK_MESSAGE: 'Post Content :rocket:'
        SLACK_TITLE: Post Title
        SLACK_USERNAME: rtCamp
        SLACK_WEBHOOK: ${{ secrets.SLACK_WEBHOOK }}

This code uses another custom action to send messages to slack. Note the if: failure() directive; this ensures that the message is only sent if our Anchore scan failed, which in most cases means it found a security issue (because, although we’re lovely people, you only really want to hear from us if there is a problem).

Last up, we’re going to add a final action to our workflow to collect the detailed reports that Anchore Engine provides when scanning a container. These reports contain relevant data such as the bill of materials, any CVEs found and detailed build logs (maybe you can think of a security-focused colleague who finds this sort of stuff compelling).

Add the following code to your workflow:

 - name: Upload artifact
      uses: actions/[email protected]
      with:
        name: AnchoreReports
        path: ./anchore-reports/

This code makes use of the upload-artifact Action. It takes the contents of the anchore-reports directory created by Anchore, zips it, and makes it available as a build artifact.

Now we’re ready to add our workflow. Click the ‘start commit’ button on the right-hand side, and commit the action to our repository. Since this is a code push into the repository, it triggers the workflow we’ve just created. Click on the actions tab in your repository to be taken to a list of workflows. On the left, you should see our workflow, and if you click on it, you’ll see the current output for the running job. Once it’s finished you should see output similar to the screenshot below:

If you examine the details of the `runanchore/scan` step inside the build log, you should see something similar to the following screenshot:

We’ve got a few warnings, but otherwise, we’re in good shape. Finally, clicking on the Artifacts tab on the top right-hand side downloads the Anchore Engine reports. This gives us an amazing depth of knowledge on the image we scanned.

With Github Actions, a few lines of YAML and Anchore Engine, you can embed container scanning into the developer workflow, pushing this increasingly crucial security practice left and into the hands of developers. This immediate and easy feedback helps you keep your projects and data secure, without an enormous overhead.

To check out the full documentation for Anchore Github Actions and take a more detailed look at additional functionality such as custom policies visit the GitHub page.

As always, we’d love to hear your feedback, and we hope you love using Anchore in Github as much as we do.

Anchore and GitHub Actions

GitHub gets a lot of love from most developers, and the team here at Anchore are no exception.

Deemed worthy of its own top-level tab in every repo, Actions is GitHub’s newest tool for automating your software workflows with world-class CI/CD. Users get DevOps pipelines with the ability to build, test, and deploy code directly from GitHub.

Add in Anchore to this already heady cocktail, and GitHub Actions can now deliver a practical DevSecOps workflow – straight from the repo.

This ensures that, when your container is ready to deploy into any environment, it has had a rigorous security scan. You deploy the code you intend to and nothing else; your dependencies are scanned, and any potentially nasty surprises made visible.

If we already have your undivided attention at this point, feel free to jump right into our tutorial, which shows you how, with very little code, you can add robust security scanning, alerting and reporting to your existing GitHub projects.

Meanwhile, if you are interested in more of the theory and reasoning behind Anchore, keep reading on…

Why Shift Left Using GitHub

Software development is now one of the most collaborative of all human endeavors. The web page you are reading right now is almost certainly the sum total of work from thousands of individual developers. Most of these people have never met each other, but they leverage each other’s work to create the technology that now underpins almost every facet of our daily lives.

This collaboration extends widely; almost every ‘smart’ device, from your TV right through to your car makes use of software written by developers from almost every part of the globe. It is a modern-day wonder that powers a dizzying pace of innovation.

And for many developers, GitHub has become the focus of much of this collaboration. It is more than just a place to store code, it is a vast, well-connected collaboration platform. Within GitHub, developers can share, review, reuse and work together on code, regardless of background or geographic location.

However, maintaining security is challenging in this new collaborative world. It is now almost impossible to manually apply any form of effective security. So, like the Operations teams before, security now has to team up with developers: DevOps is becoming DevSecOps. And like its predecessor, DevSecOps is all about embracing automation, fast feedback loops and, of course, collaboration.

Collectively, this trend is now widely referred to as ‘shifting left’.

Ok. So… why Shift Left Using GitHub?

1. The fast feedback loop

Security has long been seen as a final, irritating inconvenience in the development process. Preventing developers from moving on to the next task. Security considerations appeared as late-stage scrutiny, putting developers through the wringer of fixing issues, only to find another bug has popped-up, after yet another manual or late security intervention.

By marrying GitHub Actions and Anchore, developers get security feedback right alongside their existing unit tests. Fix, iterate, and fix again. Once your tests are clean, it’s ready to go. Security becomes part of the same workflow developers know and love.

2. Easy to set up, easy to use

GitHub is built for collaboration, and Actions are no exception. Anchor has done all the hard work for you, meaning you just need to include our Action and a handful of code. We’ve done the rest, giving you security and peace-of-mind without you having to tear your hair out managing complexity to get there.

3. One place to look

GitHub is where developers go to work. It is a tool they interact with throughout the day, using it to store, test and collaborate on code. By making security front and center in their favorite tool, it means they have one place to look. Put the information somewhere else, and after the first rush of curiosity, it’ll gather dust, unloved and uninspected. Anchore and GitHub Actions keep the security picture front and center.

4. Comprehensive and complete

The Anchore engine is a powerful, Open Source container security scanning tool that the GitHub action makes use of. You get almost the same level of scrutiny, and peace of mind that you would get from running it on your desktop. It’s the perfect mashup of automation and power. To make Anchore engine fit with the ethos of GitHub actions we’ve chosen defaults that offer fast, concise and actionable reports based on the container contents. However, if you want a slower, but more detailed scan that includes application packages, you can enable it by using the include-app-packages option found in the GitHub Action docs.

5. Policy as code

Because it’s the full Anchore Engine, it means you can define your security policy as code and make use of it in the Action. This is the perfect blend of a fast feedback loop for developers, based on a security practitioner’s insight. It’s like having your security team checking every element of your artifacts, 24/7, and letting the real practitioners drop the grunt work and focus on more valuable endeavors.

If this has whetted your appetite, then check out our tutorial on GitHub Actions, which will show you how to integrate some of Anchore’s open source peace-of-mind into your pipeline, with just a handful of code.

Anchore’s Approach to DevSecOps

Toolkits and orchestrators such as Docker and Kubernetes have been increasingly popular for companies wishing to containerize their applications and microservices. However, they also come with a responsibility for making sure these containers are secure. Whether your company builds web apps or deploys mission-critical software on jets, you should be thinking about ways to minimize your attack surface.

Aside from vandalizing and destroying company property, hackers can inflict massive damage simply by stealing data. In 2017, Equifax was fined over $500 million after customer data was stolen. British Airways and Uber have also been victims of data breaches and were fined hundreds of millions of dollars in recent years. With an average of 75 records being exploited every second, preventing bad actors from gaining access to your containers, pipelines, registries, databases, clusters and services is extremely important. Compliance isn’t just busywork, it keeps people (and their data) safe.

In this post, we’d like to discuss the unique approach Anchore takes to solving this problem. But before we get into that, let’s take a moment to define the buzzword that is probably the reason you’re reading this post: DevSecOps.

In a nutshell, DevSecOps is a modernized agile methodology that combines the efforts of development, operation and security teams. Working together to integrate security into every step of the development process, teams can deliver applications safely, at massive scale, without burdening them with heavyweight audits. DevSecOps helps teams catch issues early, before they cause damage and while they are still easy to fix. By making security a shared responsibility and shifting it left (towards developers and DevOps engineers), your company can deal with vulnerabilities before they enter production, saving time and reducing costs drastically.

In the following sections, we’ll cover a few unique reasons why organizations such as eBay, Cisco and the US Department of Defense have made Anchore a requirement in their software development lifecycle to help implement security with DevSecOps.

Lightweight Yet Powerful

At Anchore, we believe that everyone should know what’s inside the container images they build and consume. That is why the core of our solution is an open source tool, Anchore Engine, which performs deep image inspection and vulnerability scanning across all layers. When users scan an image, Anchore Engine generates a software bill of materials (SBOM) that consists of files, operating system packages, and software artifacts (including Node.JS NPM modules, Ruby GEMs, Java archives and Python packages). Anchore Engine also allows users to check for CVEs, secrets, exposed ports and many others, but more on that later!

Anchore Engine was designed to be flexible, so you can implement it anywhere:

  • If you’re a developer and want to do a one-time scan of a container image for vulnerabilities before pushing any code to version control, you can use our CLI or API
  • If you’re a DevOps engineer and wish to scan container images before pushing to or after pulling from a registry, you can easily integrate with your preferred CI/CD tool (CircleCI, Jenkins, GitHub Actions, GitLab) or perform inline scanning and analysis
  • If you’re a security engineer responsible for locking-down clusters, you can use our Kubernetes Admission Controller to prevent any pods from running vulnerable containers

Anchore Engine can be configured on any cloud platform or on-premises, as well as with any Docker V2 compatible registry (public or private). Regardless of where you’re using Anchore Engine or how you’re using it, it’s important to know the exact contents of your containers so appropriate security measures can be taken.

Strict But Adaptable

Anchore Engine enables users to create custom security rules that can be adapted to align with company policy. For example, users can create and define checks for vulnerabilities, package whitelists and blacklists, configuration file contents, leaked credentials, image manifest changes, exposed ports and more. These rules allow you to enforce strict security gates like Dockerfile gates, license gates and metadata gates (check out our docs for more info!) before running any risky containers.

You may have heard of Infrastructure-as-Code, but have you heard of Security-as-Code or Policy-as-Code? Because Anchore policies are standard text files, they can be managed like source code and versioned over time as the software supply chain evolves and best practices are developed.

In addition to Anchore Engine, we offer Anchore Enterprise, which includes many enhanced features such as an easy-to-use interface, an air-gapped feed service, and notifications with Slack, Jira, GitHub or Microsoft Teams. There are many more features and capabilities of both Anchore Engine and Anchore Enterprise, but that is a topic for a later post.

Compliant And Growing

Just days away from becoming a CNCF Kubernetes Certified Service Provider, Anchore has been working hard to help companies fulfill their security requirements. Oftentimes, we receive calls from security teams who were asked to make their software adhere to certain compliance standards. Anchore is proud to help organizations achieve NIST SP 800-190 compliance, CIS Benchmarks for Docker and Kubernetes, and best practices for building secure Docker Images.

If you work with government agencies and are interested in another level of compliance, please check out our newest product, Anchore Federal! It includes a bundle of policies created in collaboration with the United States Department of Defense that can provide out-of-the-box compliance with the required standards.

In this post, we’ve listed a few key reasons why organizations choose to use Anchore. You may have noticed we also interchangeably used the words “you” and “your company”. That’s because – in today’s world of containers – you, as the reader, have the responsibility of talking with your company about what it’s doing to prevent threats, why it should be implementing DevSecOps processes, and how Anchore can help through container security. We are here to help.

Introducing Anchore Federal

Open source software can produce surprising results. Once you create a project or application that solves real problems – and make it available under a license that enables it to be distributed throughout the world – it won’t be long before it turns up in all sorts of interesting projects and organizations.

This has certainly been true for Anchore Engine. Since the formation of the project in 2016, we’ve seen over 30,000 separate installations and broad adoption of both Anchore’s open source tools and our enterprise products. So whilst not totally unexpected, in early 2019 we were happy to learn that Anchore had been adopted by the US Department of Defense as part of its software development pipeline.

Throughout 2019, the DoD rolled out an aggressive modernization initiative, DoD Enterprises DevSecOps, championed by the USAF Chief Software Officer, Nicolas Chaillan. One of its key objectives is to introduce automated software tools, services, and standards to programs throughout the DoD. Enabling programs to create and deploy software applications in a secure, flexible, and interoperable manner is a mission that resonates strongly with the team here at Anchore.

Over the last 12 months, our team has been working extensively with key Air Force stakeholders to meet these challenges, resulting in Anchore being one of the very few tools to be mandated as part of the DoD’s DevSecOps reference design. Our software is uniquely designed to identify and understand the exact composition of software containers and can enforce user-defined acceptance policies based on any DoD compliance standards. Our engineering teams continue to work alongside resources from the DoD and partner organizations to secure and harden software containers held within the DoD’s Centralized Artifact Repository.

Based on the lessons we’ve learned so far, and the insight we continue to build, we’re pleased to announce the availability of Anchore Federal. Built on top of Anchore Enterprise, Anchore Federal adds a collection of out-of-the-box policy rules to validate compliance with the rigid security requirements of the DoD program. It also provides access, via support arrangements, to the engineering resources at the very forefront of the project to ensure partners and programs are implementing best practices. As adoption of the platform grows, Anchore engineering teams will continue to update the included policies to reflect the changing security and regulatory landscape.

The team here at Anchore are excited about our ongoing participation with the program and are fully aligned behind the mission objectives. With the introduction of Anchore Federal, we look forward to enhancing the security of federal agencies’ application development lifecycles and drive cost savings through automation and shared best practice.

Anchore: 2020 and Beyond

Today marks a major milestone in the Anchore journey.

Just a little over 3 years since we opened our doors, we have secured a substantial $20M round of funding that will allow us to address the next wave of container users around the world. I am utterly pleased and totally blown away by what a team of a little less than 20 has achieved in such a short period of time. Like I experienced in the early days of Ansible, just a thousand lines of code and few pages of documentation – built to address an existing gap in the market by smart, capable engineers – can drive ubiquitous adoption in a very short period of time.

While building the Ansible brand a few years back, I had an opportunity to speak to customers and partners and see how containers, and Kubernetes, were transforming the way companies innovate. I quickly became convinced that the next generation compute platform would heavily leverage containers, and security would become key. Today, Gartner predicts that more than 75% of global companies will deploy containers in some capacity by 2022, and the total addressable market is estimated to be $2.1B by the year 2024 by MarketsandMarkets.

Dan Nurmi, Anchore co-founder, and I knew there was a tremendous opportunity. Needing to better understand the security and compliance needs around containers, we decided to build a SaaS platform to test our assumptions. Thousands of users quickly adopted the platform, providing us critical directional feedback on the challenges users and organizations were facing. We have since used that experience to deliver what is now called Anchore Enterprise, our flagship product that is currently in use at large scale by many Fortune 1000 companies including Cisco and eBay, and is even considered a mandatory part of the United States Department of Defense DevSecOps reference architecture.

Anchore’s mission is to empower developers to secure their container workflows in a manner that does not disrupt, distract or encumber them, allowing them to innovate at their own pace. Until now, software workload security has largely been addressed at runtime, but more and more we’re seeing that the majority of issues can be caught more easily during the software development lifecycle. That’s why we want to help organizations shift security left, ensuring that issues are found earlier through seamless integration with all major CICD platforms – whether deployed on-premises, in the public cloud, or through integration with GitHub Actions.

But Anchore is more than just the technology we build. An internal company mandate has been to build both our products and our team with the same core principles that guided Ansible: kindness and accountability. Our goal was never to get from A to B in the shortest possible time; instead, to allow our longer-term vision to be realized while truly enjoying the journey of working with others. I am, once again, thrilled by the fact that those same principles led to another great outcome.

Finally, in the journey to build a global brand, we’ve embarked on hiring great talent with strong open source and enterprise IT expertise. Our office locations already span both coasts, with team members in many US states and soon Europe. We are a fairly distributed team and we’re expecting aggressive growth in the many months to come.

A Buyers’ Guide to DevSecOps

Echoing Dickens, for many in software security, it is the best of times and it is the worst of times. Every day brings literal front page news about software compromises resulting in massive data leaks. Meanwhile, the use of cloud-native technologies has meant that the variety and complexity of the software being deployed has outstripped the ability of traditional security processes and tools to protect their organizations. Security is no longer an afterthought of the IT department but a board-level issue that can cost people their jobs when failures happen.

The security domain is finding answers to these challenges with new practices like DevSecOps and “Shift Left” strategies. These responses address the challenges in the security domain in a similar way to how software developers addressed their velocity and scale issues: by focusing on people and processes. As a cultural practice, DevSecOps is about breaking down barriers between developers, product security, and operations teams so security becomes a shared responsibility and is factored into all parts of the software lifecycle. Meanwhile, Shift Left is a posture that believes better security outcomes are achieved by being proactive in the development phase and enforcing best practices as early as possible.

While recognizing that the ultimate challenges are often cultural and social, software tools and products can help drive change. But for the owner of the security budget, evaluating tools can be difficult, especially where traditionally the security team has only been called in post-hoc to the development of software or the operation of the platform.

What follows are five key new areas to consider when looking at tools for DevSecOps.

Process Flexibility

Not only are we in the early days of perfecting new security processes but many companies are still adjusting to using CI/CD tools or GitOps-based workflows. It is a safe bet to say that every year, there is some change to how your company does software development as you learn what does and doesn’t work for you. When choosing a security tool, it should have the flexibility to integrate with whatever tools you use to drive automation and be able to work in multiple stages of the software development lifecycle. Look for products with full API coverage and an automation-centric architecture. The GUI is important but it should only be something you interact with for ad-hoc or post-hoc reasons. It’s more important that you can push information into the system and get data out using a variety of tools or custom scripts.

Signal to Noise

The ultimate goal is to avoid slowing down development velocity while ensuring developers take responsibility for security. This means they can’t be distracted with excessive data or false positive security alerts. Every security tool can generate a long list of issues for almost every software library or container and indeed this has been one of the calling cards of more traditional legacy tools: the more results, the better. You should verify that there is a way to separate the signal from the noise and that developers can get immediate and useful information to help them resolve issues or make updates as efficiently as possible. Following on from process flexibility, you also need to ensure that that information can get to the developers as part of their normal workflow; security issues are just another type of bug and creating separate security-specific workflows will add friction.

Software Bill of Materials (SBOM)

Supply chain security has become a top issue as a result of the increasing use of open source components and the well-publicized compromises found in various projects. With developers now making the decision about what code to use or re-use and releases often happening multiple times a day, periodic audits don’t work anymore. A Shift Left approach requires that a complete inventory of every piece of code has to be maintained in real-time. This allows ongoing scanning to be performed so the impact of CVEs can be assessed instantly and doesn’t require a crawl of deployed applications.

Data-driven Anomaly Detection

When it comes to runtime, the environment has changed to zero-trust models and immutability as a line of defense but the security techniques are the same: look for anomalies and alert. Agent-based approaches make much less sense in the cloud where containers may not even make running them possible. This is pushing detection to a data-based approach where algorithms can spot anomalies more effectively than admins looking for odd peaks or troughs in telemetry data. As algorithms are only as effective as the data they are applied, tools that collect data from both the platform and the application layer are critical.

Policy as Code

For many, a security policy is captured in Word documents and applied variably with product security teams acting as enforcers through spot checks and annoying requests for reports. DevSecOps evangelizes for repeatability, velocity and automation so in other words: no spreadsheets! It’s critical that policy can be codified and enforced consistently throughout the SDLC in a way that evolves as the threats change. Modern security products treat policy as something akin to another QA test that has to be passed. In this way, policy becomes just another software artifact to be developed, versioned and shipped. Out of the box policies can help you create a solid baseline but flexible policy options are critical for any organization that wants to manage the trade-off between shipping velocity and good-enough security.

Many of the traditional criteria still apply when choosing a security product: choose a vendor that understands your challenges; look for platform agnosticism and avoid lock-in; and select usability over complexity. But understanding that new challenges require new approaches will help you navigate a growing and complex ecosystem.

Announcing Anchore Enterprise 2.2

Just in time for the holidays, Anchore Enterprise 2.2, our latest update, is now generally available to all of our customers. For this release, we focus on third-party integrations to send notifications, and a new system dashboard to help customers view the status of their systems. This new enterprise release is based on open source Anchore Engine 0.6.0, also available now.

New Integrations with GitHub, Jira, Slack & Microsoft Teams

Anchore Enterprise is commonly used in either a CI/CD pipeline with a container registry or with a Kubernetes admission controller, to analyze and report on any container image issues. When an image fails a policy check, you typically want to notify your developers as soon as possible so they can fix the issue. With our new integrations, these notifications can now be sent to popular workflow tools (or via plain old email if you prefer), enabling the information to be used as part of existing processes.

Notifications can optionally be separated by account, by type (system or user) and by level (info, warn, error), which allows you to send alerts about security vulnerabilities to one set of users and notifications about the Anchore system itself to another.

Importantly for images, notifications are sent not only at the time of the initial scan, but also when a new vulnerability is detected in a previously scanned image, or when a policy is changed that causes an image to be marked as “out of compliance’. The notification service is a fantastic way of creating remediation workflows from the security team to the developers, or as part of an automated system. Look for upcoming Anchore integrations with other systems.

System Dashboard and Feed Sync Status

Anchore Enterprise is a distributed application consisting of many parts, including a database, a message queue, a report engine, a policy engine and so on. To help users see the status of each component, we’ve added a new system dashboard which makes it easier to troubleshoot issues and understand the roles of the various services.

The dashboard also reports which vulnerability data sources have been successfully downloaded. Anchore Enterprise downloads a complete set of vulnerability data for use locally, reducing the need to send data back and forth over the internet, and enabling air-gapped operations. This way, you are ensured that you are receiving data from all relevant sources and that the data is up to date, which is critical for securing your container images.

Looking Into 2020

We are planning one more release in the 2 series for early 2020. After that, we will focus on version 3 of the product which will significantly expand Anchore’s policy-based security capabilities by supporting all aspects of the container’s journey, from code to cloud. As more companies adopt DevSecOps practices, we hear feedback from our users that every step of the software development lifecycle should be enforced with clear policies that prevent the introduction of inadvertent or malicious flaws. We look forward to hearing feedback from our users about their experiences with Anchore Enterprise 2.2 and collaborating on the next phase of the Anchore roadmap.

GitHub Actions Reduces Barrier for Improving Security

GitHub has been a key vendor in making the developer experience friction-free and many of the features they announced this week at their GitHub Universe conference continue to set the standard.

What was notable at the event this week was that security has now been added to the fiction-free mantra and, for anyone who has worked in the security industry, this is not a combination of words you typically hear. Indeed security is mostly seen as being a friction-adder par excellence, so it was really encouraging to see security as the core theme of the day 2 keynote, along with multiple product announcements and talks. Ensuring that security can be added to container workflows with as little overhead as possible is at the core of Anchore’s mission and a key driver of general DevSecOps practices. The fact that GitHub, as the largest hoster of open source content in the world, is getting behind this is great for everyone in the community.

As we announced two days ago, we spent a number of weeks collaborating with GitHub to produce our Anchore Container Scan action. As Zach Hill, Chief Architect at Anchore, and Steve Winton, Senior Partner Engineer at GitHub, demonstrated at one of the breakouts, starting with as little as 4 lines of YAML, you can add Anchore to a CI/CD workflow to generate a full scan of a container and use the output to pass or fail a build. It is hard to conceive of a simpler way to add security to the software development workflow. No manual crafting of Jenkins build jobs, no post-hoc scanning of a content registry – just a simple event-driven model that takes a few minutes to run.

The ability to piece multiple actions together is the most interesting part of the GitHub Action story. The obvious workflow for developers to instrument is to build a container with their code, scan it using to Anchore, push it to the Github Packages registry and then deploy it with one of the AWS, Azure or Google cloud actions. But linking this to other security capabilities in GitHub is where it gets interesting. You could programmatically: create GitHub issues with information about security issues found and how to resolve them for developers to act on; create security notifications (or even a CVE) for users to see about your product; or, push all the resulting data from your scans to a database for security researchers to mine.

We do seem to be at a moment in the industry where the scale of the problem is clear, the urgency to fix is now felt more broadly within organizations, and, finally, the tools and processes to start fixing it are becoming credible. By removing the friction, GitHub and others are hopefully reducing the cost of improving security while making the benefit ever more clear.

As we continue to develop the Anchore Container Scan action, we’re keen to hear your ideas about how we can improve it to support these types of workflows. So please provide feedback in the repo or drop us an email.

Anchore for GitHub Actions

Today at Github Universe, we are announcing the availability of the Anchore Container Scan action for GitHub. Actions allow developers to automate CI/CD workflows, easily integrating tools like Anchore into their build processes. This new action was designed for teams looking to introduce security into their development processes. You can find the action in the GitHub Marketplace

At Anchore, our mission is to enable secure container-based workflows without compromising velocity. By adding Anchore Container Scan into their build process, development teams can gain deep visibility into the contents of their images and create custom policies that ensure compliance. That means discovering and remediating vulnerabilities before publishing images…without adding manual steps that slow everything down.

If you want to learn more about the Anchore Container Scan action, watch our latest webinar where Zach Hill, Chief Architect at Anchore, provides a quick overview and demonstration.

The Delivery Hero Story, Inviting Security to the Party

Last week, the team at Delivery Hero posted the first in a series of articles about bolstering container security and compliance in their DevOps container orchestration model using Anchore Engine. We think they did a fantastic job explaining their goals and sharing the progress they have made. Their article is a great read for those who are grappling with the same challenges.

We believe it’s important to incorporate security best practices early in the development process, and the Restaurant Partner Solutions team at DeliveryHero has done so with Anchore Engine while keeping up with over one million daily orders. So if you haven’t yet read about their project, please take a look at the full article.

Benefits of Static Image Inspection and Policy Enforcement

In this post, I will dive deeper into the key benefits of a comprehensive container image inspection and policy-as-code framework.
A couple of key terms:

  • Comprehensive Container Image Inspection: Complete analysis of a container image to identify it’s entire contents: OS & non-OS packages, libraries, licenses, binaries, credentials, secrets, and metadata. Importantly: storing this information in a Software Bill of Materials (SBOM) for later use.
  • Policy-as-Code Framework: a structure and language for policy rule creation, management, and enforcement represented as code. Importantly: This allows for software development best practices to be adopted such as version control, automation, and testing.

What Exactly Comes from a Complete Static Image Inspection?

A deeper understanding. Container images are complex and require a complete analysis to fully understand all of their contents. The picture above shows all of the useful data an inspection can uncover. Some examples are:

  • Ports specified via the EXPOSE instruction
  • Base image / Linux distribution
  • Username or UID to use when running the container
  • Any environment variables set via the ENV instruction
  • Secrets or keys (ex. AWS credentials, API keys) in the container image filesystem
  • Custom configurations for applications (ex. httpd.conf for Apache HTTP Server)

In short, a deeper insight into what exactly is inside of container images allows teams to make better decisions on what configurations and security standards they would prefer their production software to have.

How to Use the Above Data in Context?

While we can likely agree that access to the above data for container images is a good thing from a visibility perspective, how can we use it effectively to produce higher-quality software? The answer is through policy management.

Policy management allows us to create and edit the rules we would like to enforce. Oftentimes these rules fall into one of three buckets: security, compliance, or best-practice. Typically, a policy author creates sets of rules and describes the circumstances by which certain behaviors/properties are allowed or not. Unfortunately, authors are often restricted to setting policy rules with a GUI or even a Word document, which makes rules difficult to transfer, repeat, version, or test. Policy-as-code solves this by representing policies in human-readable text files, which allow them to adopt software practices such as version control, automation, and testing. Importantly, a policy as code framework includes a mechanism to enforce the rules created.

With containers, standardization on a common set of best-practices for software vulnerabilities, package usage, secrets management, Dockerfiles, etc. are excellent places to start. Some examples of policy rules are:

  • Should all Dockerfiles have effective USER instruction? Yes. If undefined, warn me.
  • Should the FROM instruction only reference a set of “trusted” base images? Yes. If not from the approved list, fail this policy evaluation.
  • Are AWS keys ever allowed inside of the container image filesystem? No. If they are found, fail this policy evaluation.
  • Are containers coming from DockerHub allowed in production? No. If they attempt to be used, fail this policy evaluation.

The above examples demonstrate how the Dockerfile analysis and secrets found during the image inspection can prove extremely useful when creating policy. Most importantly, all of these policy rules are created to map to information available prior to running a container.

Integrating Policy Enforcement

With policy rules clearly defined as code and shared across multiple teams, the enforcement component can freely be integrated into the Continuous Integration / Continuous Delivery workflow. The concept of “shifting left” is important to follow here. The principal benefit here is, the more testing and checks individuals and teams can incorporate further left in their software development pipelines, the less costly it will be for them when changes need to be made. Simply put, prevention is better than a cure.

Integration as Part of a CI Pipeline

Incorporating container image inspection and policy rule enforcement to new or existing CI pipelines immediately adds security and compliance requirements as part of the build, blocking important security risks from ever making their way into production environments. For example, if a policy rule exists to explicitly not allow a container image to have a root user defined in the Dockerfile, failing the build pipeline of a non-compliant image before pushing to a production registry is a fundamental quality gate to implement. Developers will typically be forced to remediate the issue they’ve created which caused the build failure and work to modify their commit to reflect compliant changes.

Below depicts how this process works with Anchore:

Anchore provides an API endpoint where the CI pipeline can send an image for analysis and policy evaluation. This provides simple integration into any workflow, agnostic of the CI system being used. When the policy evaluation is complete, Anchore returns a PASS or FAIL output based on the policy rules defined. From this, the user can choose whether or not to fail the build pipeline.

Integration with Kubernetes Deployments

Adding an admission controller to gate execution of container images in Kubernetes in accordance with policy standards can be a critical method to validate what containers are allowed to run on your cluster. Very simply: admit the containers I trust, reject the ones I don’t. Some examples of this are:

  • Reject an image if it is being pulled directly from DockerHub.
  • Reject an image if it has high or critical CVEs that have fixes available.

This integration allows Kubernetes operators to enforce policy and security gates for any pod that is requested on their clusters before they even get scheduled.

Below depicts how this process works with Anchore and the Anchore Kubernetes Admission Controller:

The key takeaway from both of these points of integration is that they are occurring before ever running a container image. Anchore provides users with a full suite of policy checks which can be mapped to any detail uncovered during the image inspection. When discussing this with customers, we often hear, “I would like to scan my container images for vulnerabilities.” While this is a good first step to take, it is the tip of the iceberg when it comes to what is available inside of a container image.

Conclusion

With immutable infrastructure, once a container image artifact is created, it does not change. To make changes to the software, good practice tells us to build a new container image, push it to a container registry, kill the existing container, and start a new one. As explained above, containers provide us with tons of useful static information gathered during an inspection, so another good practice is to use this information, as soon as it is available, and where it makes sense in the development workflow. The more policies which can be created and enforced as code, the faster and more effective IT organizations will be able to deliver secure software to their end customers.

Looking to learn more about how to utilizing a policy-based security posture to meet DoD compliance standards like cATO or CMMC? One of the most popular technology shortcuts is to utilize a DoD software factory. Anchore has been helping organizations and agencies put the Sec in DevSecOps by securing traditional software factories, transforming them into DoD software factories. Get caught up with the content below:

Success With Anchore, Best Practices from our Customers

Successful container and CI/CD security encompass not only vulnerability analysis but also a mindset based on integrating security with every step of the Software Development Life Cycle (SDLC). At Anchore, we believe incorporating early and frequent scanning with policy enforcement can help reduce overall security risk. This blog shares some of the elements that have helped our customers be successful with Anchore.

Scan Early/Scan Often

Anchore allows you to start analyzing right away, without changing your existing processes. There is no downside in putting an `anchore-cli image add <new image>` at the end of your CI/CD pipeline, and then exploring how to use the results of vulnerability scans or policy evaluations later. Since all images added to Anchore are there until you decide to remove them, analysis can be revisited later and new policies can be applied as your organizational needs evolve.

Scanning early catches vulnerabilities and policy violations prior to deploying into production. By scanning during the CI/CD pipeline, issues can be resolved prior to runtime narrowing the focus to issues that are solely runtime-related at that point. This “Shift Left” mentality moves application quality and security considerations closer to the developer, allowing issues to be addressed sooner in the delivery chain. Whether it’s CI/CD build plugins (Jenkins, CircleCI, etc.) or repository image scanning, adding security analysis to your delivery pipeline can reduce the time it takes to resolve issues as well as lower the costs associated with fixing security issues in production.

To learn more about Anchore’s CI/CD integrations, take a look at our CI/CD documentation.

To learn more about repository image analysis, see our Analyzing Images documentation.

Custom Policy Creation

At Anchore, we believe in more than just CVEs. Anchore policies act as a one-stop-checking-spot for Dockerfile best practices, as well as keep policy enforcement in-line with your organizational security standards, such as secret storage and application configuration within your container. At a high level, policy bundles contain the policies themselves, whitelists, mappings, whitelisted images, and blacklisted images.

Policies can be configured to be compliant with NIST, ISO, and banking regulations, among many others. As industry regulations and auditing regularly affect the time to deployment, performing policy checks early in the CI/CD pipeline can help increase the speed of deployments without sacrificing auditing or regulation requirements. At a finer-grained level, custom policies can enforce organizational best practices at an earlier point in the pipeline, enabling cross-group buy-in between developers and security personnel.

To learn more about working with Anchore policies, please see our Working with Policies documentation.

Policy Enforcement with Notifications

To build upon the above topic, another best practice is enabling notifications. With a typical CI/CD process, build failures prompt notifications to fix the build, whether it is due to a missing dependency or simply a typo. With Anchore, builds can be configured to fail when an analysis or a policy evaluation fails, prompting attention to the issue.

Taking this a step further, Anchore enables notifications through webhooks that can be used to notify the appropriate personnel in the event that there is an update to a CVE or if a policy evaluation status changes. Anchore leverages the ability to subscribe to tags and images to receive notifications when images are updated, when CVEs are added or removed and when the policy status of an image changes so you can take a proactive approach to ensure security and compliance. Having the ability to stay on top of the notifications above allows for the appropriate methods for remediation and triage to take place.

To learn more about using webhooks for notifications, please see our Webhook Configuration documentation.

For an example of how notifications can be integrated with Slack, please see our Using Anchore and Slack for Container Security Notifications blog.

Archiving Old Analysis Data

There may be times that older image analysis data is no longer needed in your working set but, for security compliance reasons, the data needs to be retained. Adding an image to the archive includes all analyses, policy evaluations, and tags for an image, allowing you to delete the image from your working set. Manually moving images to an archive can be cumbersome and time-consuming, but automating the process reduces the number of images in your working set while still retaining the analysis data.

Archiving analysis data backs it up, allowing it to be removed from the working set; it can always be moved back should something in the policy change, an organizational shift occurs, or you simply want it back in the working set. Archiving image data keeps the live set of images in line with what is current; over time, it could become cumbersome to continuously be running policy evaluations and vulnerability scans against images that are old and potentially not important. Archiving them keeps the working set lighter. Anchore’s archiving service makes it simple to automatically archive images and their data, implemented via adding rules to the analysis archive. With such rules, images with an analyzed date older than a specified number of days, specific tags, and the number of images can be automatically added to the archive, making it simpler to work with the newer images your organization is concerned with while maintaining the analysis data of older images.

To learn more about archiving old analysis data, please see our Using the Analysis Archive documentation.

To learn more about working with archiving rules, please see our Working with Archive Rules documentation.

Leveraging External Object Storage to Offload Database Storage

Anchore Engine uses a PostgreSQL database to store structured data for images, tags, policies, subscriptions, and metadata about images by default, but other types of data in the system are less structured and tend to be larger pieces of data. Because of that, there are benefits to supporting key-value access patterns for things like image manifests, analysis reports, and policy evaluations. For such data, Anchore has an internal object storage interface that, while defaulted to use the same PostgreSQL database for storage, can be configured to use external object storage providers to support simpler capacity management and lower costs.

By offloading the database storage, it eliminates the need to scale-out PostgreSQL while speeding up its performance. As the database grows, the various queries that are run against it and writing new data to it slow down, in turn slowing the productivity of Anchore. By leveraging an external object store and removing bulk data from PostgreSQL, only the relevant image metadata will be stored there, while other important data is stored externally and can be archived at lower costs.

To learn more about using any of our supported external object storage drivers, please see our Object Storage documentation.

Conclusion

Leveraging some of the best practices that have made our customers successful can help your organization achieve the same success with Anchore. As an open-source community, we value feedback and hearing about what best practices the community has developed.

Anchore Talk Webinar, Redefining the Software Supply Chain

We are pleased to announce Anchore Talks, a series of short webinars to help improve Kubernetes and Docker security best practices. We believe it is important to have excellent security measures in place when adopting containers, and that drives every decision we make when developing Anchore Enterprise and Anchore Engine. These talks, no longer than 15 minutes each, will share our perspective on the challenges and opportunities presented to today’s DevSecOps professionals and offer clear, actionable advice for securing the build pipeline.

Containers can create quite a few headaches for security professionals because they increase velocity and allow developers to pull from a wider variety of software. Fortunately, they can also offer more efficient tracking and oversight for your software supply chain, making it much easier to scan, find and patch vulnerabilities during the build process. Using containers, security can be baked in from the start, keeping the velocity of the build process high.

Anchore VP of Product Neil Levine has prepared our first Anchore Talk on this new approach to security, starting with how developers can source containers responsibly finishing with container immutability and its impact on audits and compliance. You won’t want to miss this brief 10-15 minute talk live on October 28th, starting at 10 am PST! It will also be available on-demand once you have signed up for a BrightTalk account. If keeping systems secure is your full-time job, we have some exciting content coming your way.

Anchore and Google Distroless

The most recent open source release of Anchore Engine (0.5.1), which is also available as part of Anchore Enterprise 2.1, added support for Google Distroless containers. But what are they and why is the addition notable?

When containers were first starting to be adopted, it was natural for many users to think of them as stripped-down virtual machines which booted faster. Indeed, if you look at the container images published by the operating system vendors, you can see that in most instances they take their stock distribution and remove all the parts they consider unnecessary. This still leaves images that are pretty large, in the hundreds of megabytes, and so some alternative distributions have become popular, notably Alpine which based on Busybox and the MUSL C library had its roots in the embedded space. Now images can be squeezed into the tens of megabytes, enabling faster build, downloads and a reduced surface area for vulnerabilities.

However, these images still ape VMs, enabling shell access and containing package managers, designed to let users grow and modify them. Google wanted a different approach that saw a container image as essentially a language runtime environment that was curated by the application teams themselves. The only thing that should be added to it was the actual application itself. The resulting family of images known as Distroless are only slightly larger than thin distros like Alpine but, by contrast, have better compatibility by using standard libraries (e.g. libc rather than MUSL).

As Google Distroless images are based on Debian packages, Anchore is now able to scan and report on any security findings in the base images as well as in the language files installed.

The images are all hosted on the Google Container Registry (GCR) and are available with Java and C (with experimental support also available for Python, NPM, Node and .Net). We can add them using the regular syntax for Anchore Engine on the CLI:

anchore-cli image add gcr.io/distroless/java:11

Being so small, the images are typically scanned in a minute or less. Using the Anchore Enterprise GUI, you can see the image is detected as being Debian:

Looking at its contents, you can see the image has very little in it – only 19 Debian packages, including libc6:

As standard Debian packages, Anchore can scan these and alert for any vulnerabilities. If there are fixes available, you can configure Anchore to trigger a rebuild of the image.

There is only one warning generated on the image by the standard Anchore policy which relates to the lack of a Dockerfile health check but other than that, this image – given its lean nature, is vulnerability free.

If you are using a compiled binary application like Java, another new feature allows you to add the hash of the binary to the Anchore policy check which means you can enforce a strict compliance check on every build that goes through your CI/CD. This will ensure that literally no other modifications are being made to the base images other than the application being layered on top.

For users who still need access to a shell for debugging or viewing locally stored log files, they may still prefer to use Alpine or other minimal ages, but or those fully vested in the cloud-native deployment model where containers conform to 12-factor best practices, Google Distroless images are a great asset to have in your development process.

You can find more information about Google Distoless on GitHub and existing users of both Anchore Engine or Anchore Enterprise just need to download the latest version to enable support.

Anchore Engine 0.5.1 Release

We are pleased to announce the immediate availability of Anchore Engine 0.5.1, the latest point update to our open source software from Anchore that helps users enforce container security, compliance, and best practice requirements. This update not only adds bug fixes and performance improvements but also adds a new policy gate check and support for Google’s distroless images.

Google’s distroless images are helping businesses tighten up security while speeding up the build, scan, and patch process for DevOps teams. Because these images only contain the application’s resources and runtime dependencies, the attack surface is significantly reduced and the process of scanning for and patching vulnerabilities becomes much simpler. Using distroless container images can help DevOps teams save time and become more agile in their development pipeline while keeping security at the forefront. For more documentation on distroless container images, take a look here.

Also in this release, our engineers have taken policy check to the next level with our secret search gate. Previously, our secret search gate made sure vulnerable information was not left in plain sight for hackers to exploit. Now you can use it to make sure necessities aren’t missing from your config file within your image.

If you haven’t already deployed Anchore Engine, you can stand it up alongside your favorite cloud native tools, begin hardening your container images and adhering to federally accepted compliance and best practices.

We are incredibly thankful for our open source community and can’t wait to share more project updates! For more information about the release, check out our release notes.

Visit AWS Marketplace For Anchore Engine on EKS

In this post, I will walk through the steps required to deploy the Anchore Engine Marketplace Container Image Solution on Amazon EKS with Helm. Amazon Elastic Kubernetes Service (Amazon EKS) is a managed service that makes it easy for users to run Kubernetes on AWS without needing to install and operate their own clusters. For many users looking to deploy Anchore Engine, Amazon EKS is a simple choice to reap the benefits of Kubernetes without the operational overhead.

Prerequisites

Before you begin, please make sure you have fulfilled the prerequisites detailed below. At a minimum, you should be comfortable working with the command-line and have a general understanding of how to work with Kubernetes applications.

  • A running Amazon EKS cluster with worker nodes launched. See EKS Documentation for more information on this setup.
  • Helm client and server installed and configured with your EKS cluster.
  • Anchore CLI installed on localhost.

Once you have an EKS cluster up and running with worker nodes launched, you can verify via the following command.

$ kubectl get nodes
NAME                             STATUS   ROLES    AGE   VERSION
ip-192-168-2-164.ec2.internal    Ready    <none>   10m   v1.14.6-eks-5047ed
ip-192-168-35-43.ec2.internal    Ready    <none>   10m   v1.14.6-eks-5047ed
ip-192-168-55-228.ec2.internal   Ready    <none>   10m   v1.14.6-eks-5047ed

Anchore Engine Marketplace Listing

Anchore Engine allows users to bring industry-leading open source container security and compliance to their container landscape in EKS. Deployment is done using the Anchore Engine Helm Chart, which can be found on GitHub. So if you are already running an EKS cluster with Helm configured, you can now deploy Anchore Engine directly from the AWS marketplace to tighten up your container security posture.

To get started, navigate to the Anchore Engine Marketplace Listing, and select “Continue to Subscribe”, “Continue to Configuration”, and “Continue to Launch”.

On the Launch Configuration screen, select “View container image details”

Selecting this will present the popup depicted below. This will display the Anchore Engine container images you will be required to pull down and use with your deployment.
There are two container images required for this deployment: Anchore Engine and PostgreSQL.

Next, follow the steps on the popup to verify you are able to pull down the required images (Anchore Engine and Postgres) from Amazon ECR.

Anchore Custom Configuration

Before deploying the Anchore software, you will need to create a custom anchore_values.yaml file to pass the Anchore Engine Helm Chart during your installation. The reason behind this is the default Helm chart references different container images than the ones on AWS Marketplace. Additionally, in order to expose our application on the public internet, you will need to configure ingress resources.

As mentioned above, you will need to reference the Amazon ECR Marketplace images in this Helm chart. You can do so by populating your custom anchore_values.yaml file with image location and tag as shown below.

postgresql:
  image: 709373726912.dkr.ecr.us-east-1.amazonaws.com/e4506d98-2de6-4375-8d5e-10f8b1f5d7e3/cg-3671661136/docker.io/library/postgres
  imageTag: v.0.5.0-latest
  imagePullPolicy: IfNotPresent
anchoreGlobal:
  image: 709373726912.dkr.ecr.us-east-1.amazonaws.com/e4506d98-2de6-4375-8d5e-10f8b1f5d7e3/cg-3671661136/docker.io/anchore/anchore-engine
  imageTag: v.0.5.0-latest
  imagePullPolicy: IfNotPresent

Note: Since the container images live in a private ECR registry, you will also need to create a secret with valid Docker credentials in order to fetch them.

Example Steps to Create a Secret

# RUN me where kubectl is available,& make sure to replace account,region etc
# Set ENV vars
ACCOUNT=123456789
REGION=my-region
SECRET_NAME=${REGION}-ecr-registry
[email protected] ( can be anything)

#
# Fetch token (which will expire in 12 hours)
#

TOKEN=`aws ecr --region=$REGION get-authorization-token --output text --query authorizationData[].authorizationToken | base64 -d | cut -d: -f2`

#
# Create registry secret
#
kubectl create secret docker-registry $SECRET_NAME --docker-server=https://${ACCOUNT}.dkr.ecr.${REGION}.amazonaws.com--docker-username=AWS --docker-password="${TOKEN}" --docker-email="${EMAIL}"

Once you have successfully created the secret, you will need to add ImagePullSecrets to a service account.

I recommend reading more about how you can add ImagePullSecrets to a service account here.

Ingress (Optional)

One of the simplest ways to expose Kubernetes applications on the public internet is through ingress. On AWS, an ALB ingress controller can be used. It is important to note that this step is optional, as you can still run through a successful installation of the software without it. You can read more about Kubernetes Ingress with AWS ALB Ingress Controller here.

Anchore Ingress Configurations

Just as we did above, any changes to the Helm chart configuration should be made in your anchore_values.yaml

Ingress

First, you should create an ingress section in your anchore_values.yaml file as shown in the code block below. The key properties here are apiPath and annotations.

ingress:
  enabled: true
  # Use the following paths for GCE/ALB ingress controller
  apiPath: /v1/*
  # uiPath: /*
    # apiPath: /v1/
    # uiPath: /
    # Uncomment the following lines to bind on specific hostnames
    # apiHosts:
    #   - anchore-api.example.com
    # uiHosts:
    #   - anchore-ui.example.com
  annotations:
    kubernetes.io/ingress.class: alb
    alb.ingress.kubernetes.io/scheme: internet-facing

Anchore Engine API Service

Next, you can create an anchoreApi section in your anchore_values.yaml file as shown in the code block below. The key property here is changing service type to NodePort.

# Pod configuration for the anchore engine api service.
anchoreApi:
  replicaCount: 1

  # Set extra environment variables. These will be set on all api containers.
  extraEnv: []
    # - name: foo
    #   value: bar

  # kubernetes service configuration for anchore external API
  service:
    type: NodePort
    port: 8228
    annotations: {}

AWS EKS Configurations

Once the Anchore configuration is complete, you can move to the EKS specific configuration. The first step is to create an IAM policy to give the Ingress controller we will be creating the proper permissions. In short, you need to allow permission to work with ec2 resources and create a load balancer.

Create the IAM Policy to Give the Ingress Controller the Right Permissions

  1. Go to the IAM Console.
  2. Choose the section Roles and search for the NodeInstanceRole of your EKS worker nodes.
  3. Create and attach a policy using the contents of the template iam-policy.json

Next, deploy RBAC Roles and RoleBindings needed by the AWS ALB Ingress controller from the template below:

wget https://raw.githubusercontent.com/kubernetes-sigs/aws-alb-ingress-controller/v1.0.0/docs/examples/rbac-role.yaml
kubectl apply -f https://raw.githubusercontent.com/kubernetes-sigs/aws-alb-ingress-controller/v1.0.0/docs/examples/rbac-role.yaml

Update ALB Ingress

Download the ALB Ingress manifest and update the cluster-name section with the name of your EKS cluster name.

wget https://raw.githubusercontent.com/kubernetes-sigs/aws-alb-ingress-controller/v1.0.1/docs/examples/alb-ingress-controller.yaml
# Name of your cluster. Used when naming resources created
            # by the ALB Ingress Controller, providing distinction between
            # clusters.
            - --cluster-name=anchore-prod

Deploy the AWS ALB Ingress controller YAML:

kubectl apply -f alb-ingress-controller.yaml

Installation

Now that all of the custom configurations are completed, you are ready to install the Anchore software.

First, ensure you have the latest Helm Charts by running the following command:

helm repo update

Install Anchore Engine

Next, run the following command to install the Anchore Engine Helm chart in your EKS cluster:

helm install --name anchore-engine -f anchore_values.yaml stable/anchore-engine

The command above will install Anchore Engine using the custom anchore_values.yaml file you’ve creaed

You will need to give the software a few minutes to bootstrap.

In order to see the ingress resource we have created, run the following command:

$ kubectl describe ingress
Name:             anchore-enterprise-anchore-engine
Namespace:        default
Address:          xxxxxxx-default-anchoreen-xxxx-xxxxxxxxx.us-east-1.elb.amazonaws.com
Default backend:  default-http-backend:80 (<none>)
Rules:
  Host  Path  Backends
  ----  ----  --------
  *     
        /v1/*   anchore-enterprise-anchore-engine-api:8228 (192.168.42.122:8228)
Annotations:
  alb.ingress.kubernetes.io/scheme:  internet-facing
  kubernetes.io/ingress.class:       alb
Events:
  Type    Reason  Age   From                    Message
  ----    ------  ----  ----                    -------
  Normal  CREATE  14m   alb-ingress-controller  LoadBalancer 904f0f3b-default-anchoreen-d4c9 created, ARN: arn:aws:elasticloadbalancing:us-east-1:077257324153:loadbalancer/app/904f0f3b-default-anchoreen-d4c9/4b0e9de48f13daac
  Normal  CREATE  14m   alb-ingress-controller  rule 1 created with conditions [{    Field: "path-pattern",    Values: ["/v1/*"]  }]

The output above shows you that a Load Balancer has been created in AWS with an address you can hit in the browser. A great tool to validate that the software is up and running is the Anchore CLI. Additionally, you can use this tool to verify that the API route hostname is configured correctly:

Note: Read more on Configuring the Anchore CLI

$ anchore-cli --url http://anchore-engine-anchore-engine.apps.54.84.147.202.nip.io/v1 --u admin --p foobar system status
Service analyzer (anchore-enterprise-anchore-engine-analyzer-cfddf6b56-9pwm9, http://anchore-enterprise-anchore-engine-analyzer:8084): up
Service apiext (anchore-enterprise-anchore-engine-api-5b5bffc79f-vmwvl, http://anchore-enterprise-anchore-engine-api:8228): up
Service simplequeue (anchore-enterprise-anchore-engine-simplequeue-dc58c69c9-5rmj9, http://anchore-enterprise-anchore-engine-simplequeue:8083): up
Service policy_engine (anchore-enterprise-anchore-engine-policy-84b6dbdfd-fvnll, http://anchore-enterprise-anchore-engine-policy:8087): up
Service catalog (anchore-enterprise-anchore-engine-catalog-b88d4dff4-jhm4t, http://anchore-enterprise-anchore-engine-catalog:8082): up

Engine DB Version: 0.0.11
Engine Code Version: 0.5.0

Conclusion

With Anchore installed on EKS, Security and DevOps teams can seamlessly integrate comprehensive container image inspection and policy enforcement into their CI/CD pipeline to ensure that images are analyzed thoroughly for known vulnerabilities before deploying them into production. This will not only avoid the pain of finding and remediating vulnerabilities at runtime but also allow the end-user to define and enforce custom security policies to meet their specific company’s internal policies and any applicable regulatory security standards. We are happy to provide users with the added simplicity of deploying Anchore software on Amazon EKS with Helm as a validated AWS Marketplace container image solution.

Anchore Engine Available in Azure Marketplace

We are pleased to announce the immediate availability of Anchore Engine in the Azure marketplace.

Microsoft has grown its cloud native development and DevOps offerings significantly in the past two years. The Azure offerings available today such as Azure Container Instances (ACI), Azure Kubernetes Service (AKS), and Azure Pipelines give enterprises and agencies the tools they need to build scalable, cloud native applications. With Azure, Microsoft helps organizations innovate and grow while saving time and money, enabling business transformation and increased competitiveness.

At Anchore, we have a similar mission. We want organizations to innovate quickly with containers but be confident that the software they ship is safe. Our comprehensive container image inspection and analysis solution is a perfect fit for the kind of innovative enterprises and agencies that use Azure. That is why we are proud to make it available through the Azure Marketplace.

Give it a try! If you don’t already have an Azure account, you can get one for free. Then, check out our marketplace page to get started.

Anchore Enterprise 2.1 Features Single Sign-On (SSO)

With the release of Anchore Enterprise 2.1 (based on Anchore Engine v0.5.0), we are happy to announce integration with external identity providers that support SAML 2.0. Adding support for external identity providers allows users to enable Single Sign-On for Anchore, reducing the number of user stores that an enterprise needs to maintain.

Authentication / Authorization

SAML is an open standard for exchanging authorization and authentication (auth-n/auth-z) data between an identity provider (IdP) and a service provider (SP). As an SP, Anchore Enterprise 2.1 can be configured to use an external IdP such as Keycloak for auth-n/auth-z user transactions.

When using SAML SSO, users log into the Anchore Enterprise UI via the external IdP without ever passing credentials to Anchore. Information about the user is passed from the IdP to Anchore and Anchore initializes the user’s identity within itself using that data. After first sign-in, the username exists without credentials in Anchore and additional RBAC configuration can be done on the identity directly by Anchore administrators. This allows Anchore administrator users to control access of their own users without also having to have access to a corporate IdP system.

Integrating Anchore Enterprise with Keycloak

The JBoss Keycloak auth-n/auth-z IdP is a widely used and open-source identity management system that supports integration with applications via SAML and OpenID Connect. It also can operate as an identity broker between other providers such as LDAP or other SAML providers and applications that support SAML or OpenID Connect.

In addition to Keycloak, other SAML supporting IdPs could be used, such as Okta or Google’s Cloud Identity SSO. There are four key features that an IdP must provide in order to successfully integrate with Anchore:

  1. It must support HTTP Redirect binding.
  2. It should support signed assertions and signed documents. While this blog doesn’t apply either of these, it is highly recommended to use signed assertions and documents in a production environment.
  3. It must allow unsigned client requests from Anchore.
  4. It must allow unencrypted requests and responses.

The following is an example of how to configure a new client entry in KeyCloak and configure Anchore to use it to permit UI via Keycloak SSO.

Deploying Keycloak and Anchore

For this example, I used the latest Keycloak image from Docker Hub (Keycloak v7.0.0). The default docker-compose file for Anchore Enterprise 2.1 includes options to enable OAuth. By default, these options are commented out. Uncommenting `ANCHORE_OAUTH_ENABLED` and `ANCHORE_AUTH_SECRET` will enable SSO.

Using the following docker-compose file, I can deploy Keycloak with its own Postgres DB:

version: '3'

volumes:
  postgres_data:
      driver: local

services:
  postgres:
      image: postgres
      volumes:
        - postgres_data:/var/lib/postgresql/data
      environment:
        POSTGRES_DB: keycloak
        POSTGRES_USER: keycloak
        POSTGRES_PASSWORD: password
  keycloak:
      image: jboss/keycloak
      environment:
        DB_VENDOR: POSTGRES
        DB_ADDR: postgres
        DB_DATABASE: keycloak
        DB_USER: keycloak
        DB_SCHEMA: public
        DB_PASSWORD: password
        KEYCLOAK_USER: admin
        KEYCLOAK_PASSWORD: Pa55w0rd
      ports:
        - 8080:8080
        - 9990:9990
      depends_on:
        - postgres

Next, I can deploy Anchore Enterprise with the following docker-compose file:

# All-in-one docker-compose deployment of a full anchore-enterprise service system
---
version: '2.1'
volumes:
  anchore-db-volume:
    # Set this to 'true' to use an external volume. In which case, it must be created manually with "docker volume create anchore-db-volume"
    external: false
  anchore-scratch: {}
  feeds-workspace-volume:
    # Set this to 'true' to use an external volume. In which case, it must be created manually with "docker volume create feeds-workspace-volume"
    external: false
  enterprise-feeds-db-volume:
    # Set this to 'true' to use an external volume. In which case, it must be created manually with "docker volume create enterprise-feeds-db-volume"
    external: false

services:
  # The primary API endpoint service
  engine-api:
    image: docker.io/anchore/anchore-engine:v0.5.0
    depends_on:
    - anchore-db
    - engine-catalog
    #volumes:
    #- ./config-engine.yaml:/config/config.yaml:z
    ports:
    - "8228:8228"
    logging:
      driver: "json-file"
      options:
        max-size: 100m
    environment:
    - ANCHORE_ENDPOINT_HOSTNAME=engine-api
    - ANCHORE_DB_HOST=anchore-db
    - ANCHORE_DB_PASSWORD=mysecretpassword
    - ANCHORE_AUTHZ_HANDLER=external
    - ANCHORE_EXTERNAL_AUTHZ_ENDPOINT=http://enterprise-rbac-authorizer:8228
    - ANCHORE_ENABLE_METRICS=false
    - ANCHORE_LOG_LEVEL=INFO
    # Uncomment both ANCHORE_OAUTH_ENABLED and ANCHORE_AUTH_SECRET to enable SSO feature of anchore-enterprise
    - ANCHORE_OAUTH_ENABLED=true
    - ANCHORE_AUTH_SECRET=supersharedsecret
    command: ["anchore-manager", "service", "start",  "apiext"]
  # Catalog is the primary persistence and state manager of the system
  engine-catalog:
    image: docker.io/anchore/anchore-engine:v0.5.0
    depends_on:
    - anchore-db
    #volumes:
    #- ./config-engine.yaml:/config/config.yaml:z
    logging:
      driver: "json-file"
      options:
        max-size: 100m
    expose:
    - 8228
    environment:
    - ANCHORE_ENDPOINT_HOSTNAME=engine-catalog
    - ANCHORE_DB_HOST=anchore-db
    - ANCHORE_DB_PASSWORD=mysecretpassword
    - ANCHORE_ENABLE_METRICS=false
    - ANCHORE_LOG_LEVEL=INFO
    # Uncomment both ANCHORE_OAUTH_ENABLED and ANCHORE_AUTH_SECRET to enable SSO feature of anchore-enterprise
    - ANCHORE_OAUTH_ENABLED=true
    - ANCHORE_AUTH_SECRET=supersharedsecret
    command: ["anchore-manager", "service", "start",  "catalog"]
  engine-simpleq:
    image: docker.io/anchore/anchore-engine:v0.5.0
    depends_on:
    - anchore-db
    - engine-catalog
    #volumes:
    #- ./config-engine.yaml:/config/config.yaml:z
    expose:
    - 8228
    logging:
      driver: "json-file"
      options:
        max-size: 100m
    environment:
    - ANCHORE_ENDPOINT_HOSTNAME=engine-simpleq
    - ANCHORE_DB_HOST=anchore-db
    - ANCHORE_DB_PASSWORD=mysecretpassword
    - ANCHORE_ENABLE_METRICS=false
    - ANCHORE_LOG_LEVEL=INFO
    # Uncomment both ANCHORE_OAUTH_ENABLED and ANCHORE_AUTH_SECRET to enable SSO feature of anchore-enterprise
    - ANCHORE_OAUTH_ENABLED=true
    - ANCHORE_AUTH_SECRET=supersharedsecret
    command: ["anchore-manager", "service", "start",  "simplequeue"]
  engine-policy-engine:
    image: docker.io/anchore/anchore-engine:v0.5.0
    depends_on:
    - anchore-db
    - engine-catalog
    #volumes:
    #- ./config-engine.yaml:/config/config.yaml:z
    expose:
    - 8228
    logging:
      driver: "json-file"
      options:
        max-size: 100m
    environment:
    - ANCHORE_ENDPOINT_HOSTNAME=engine-policy-engine
    - ANCHORE_DB_HOST=anchore-db
    - ANCHORE_DB_PASSWORD=mysecretpassword
    - ANCHORE_ENABLE_METRICS=false
    - ANCHORE_LOG_LEVEL=INFO
    # Uncomment the ANCHORE_FEEDS_* environment variables (and uncomment the feeds db and service sections at the end of this file) to use the on-prem feed service
    #- ANCHORE_FEEDS_URL=http://enterprise-feeds:8228/v1/feeds
    #- ANCHORE_FEEDS_CLIENT_URL=null
    #- ANCHORE_FEEDS_TOKEN_URL=null
    # Uncomment both ANCHORE_OAUTH_ENABLED and ANCHORE_AUTH_SECRET to enable SSO feature of anchore-enterprise
    - ANCHORE_OAUTH_ENABLED=true
    - ANCHORE_AUTH_SECRET=supersharedsecret
    command: ["anchore-manager", "service", "start",  "policy_engine"]
  engine-analyzer:
    image: docker.io/anchore/anchore-engine:v0.5.0
    depends_on:
    - anchore-db
    - engine-catalog
    #volumes:
    #- ./config-engine.yaml:/config/config.yaml:z
    expose:
    - 8228
    logging:
      driver: "json-file"
      options:
        max-size: 100m
    environment:
    - ANCHORE_ENDPOINT_HOSTNAME=engine-analyzer
    - ANCHORE_DB_HOST=anchore-db
    - ANCHORE_DB_PASSWORD=mysecretpassword
    - ANCHORE_ENABLE_METRICS=false
    - ANCHORE_LOG_LEVEL=INFO
    # Uncomment both ANCHORE_OAUTH_ENABLED and ANCHORE_AUTH_SECRET to enable SSO feature of anchore-enterprise
    - ANCHORE_OAUTH_ENABLED=true
    - ANCHORE_AUTH_SECRET=supersharedsecret
    volumes:
    - anchore-scratch:/analysis_scratch
    - ./analyzer_config.yaml:/anchore_service/analyzer_config.yaml:z
    command: ["anchore-manager", "service", "start",  "analyzer"]
  anchore-db:
    image: "postgres:9"
    volumes:
    - anchore-db-volume:/var/lib/postgresql/data
    environment:
    - POSTGRES_PASSWORD=mysecretpassword
    expose:
    - 5432
    logging:
      driver: "json-file"
      options:
        max-size: 100m
  enterprise-rbac-authorizer:
    image: docker.io/anchore/enterprise:v0.5.0
    volumes:
    - ./license.yaml:/license.yaml:ro
    #- ./config-enterprise.yaml:/config/config.yaml:z
    depends_on:
    - anchore-db
    - engine-catalog
    expose:
    - 8089
    logging:
      driver: "json-file"
      options:
        max-size: 100m
    environment:
    - ANCHORE_ENDPOINT_HOSTNAME=enterprise-rbac-authorizer
    - ANCHORE_DB_HOST=anchore-db
    - ANCHORE_DB_PASSWORD=mysecretpassword
    - ANCHORE_ENABLE_METRICS=false
    - ANCHORE_LOG_LEVEL=INFO
    # Uncomment both ANCHORE_OAUTH_ENABLED and ANCHORE_AUTH_SECRET to enable SSO feature of anchore-enterprise
    - ANCHORE_OAUTH_ENABLED=true
    - ANCHORE_AUTH_SECRET=supersharedsecret
    command: ["anchore-enterprise-manager", "service", "start",  "rbac_authorizer"]
  enterprise-rbac-manager:
    image: docker.io/anchore/enterprise:v0.5.0
    volumes:
    - ./license.yaml:/license.yaml:ro
    #- ./config-enterprise.yaml:/config/config.yaml:z
    depends_on:
    - anchore-db
    - engine-catalog
    ports:
    - "8229:8228"
    logging:
      driver: "json-file"
      options:
        max-size: 100m
    environment:
    - ANCHORE_ENDPOINT_HOSTNAME=enterprise-rbac-manager
    - ANCHORE_DB_HOST=anchore-db
    - ANCHORE_DB_PASSWORD=mysecretpassword
    - ANCHORE_AUTHZ_HANDLER=external
    - ANCHORE_EXTERNAL_AUTHZ_ENDPOINT=http://enterprise-rbac-authorizer:8228
    - ANCHORE_ENABLE_METRICS=false
    - ANCHORE_LOG_LEVEL=INFO
    # Uncomment both ANCHORE_OAUTH_ENABLED and ANCHORE_AUTH_SECRET to enable SSO feature of anchore-enterprise
    - ANCHORE_OAUTH_ENABLED=true
    - ANCHORE_AUTH_SECRET=supersharedsecret
    command: ["anchore-enterprise-manager", "service", "start",  "rbac_manager"]
  enterprise-reports:
    image: docker.io/anchore/enterprise:v0.5.0
    volumes:
    - ./license.yaml:/license.yaml:ro
    depends_on:
    - anchore-db
    - engine-catalog
    ports:
    - "8558:8228"
    logging:
      driver: "json-file"
      options:
        max-size: 100m
    environment:
    - ANCHORE_ENDPOINT_HOSTNAME=enterprise-reports
    - ANCHORE_DB_HOST=anchore-db
    - ANCHORE_DB_PASSWORD=mysecretpassword
    - ANCHORE_ENABLE_METRICS=false
    - ANCHORE_AUTHZ_HANDLER=external
    - ANCHORE_EXTERNAL_AUTHZ_ENDPOINT=http://enterprise-rbac-authorizer:8228
    - ANCHORE_LOG_LEVEL=INFO
    # Uncomment both ANCHORE_OAUTH_ENABLED and ANCHORE_AUTH_SECRET to enable SSO feature of anchore-enterprise
    - ANCHORE_OAUTH_ENABLED=true
    - ANCHORE_AUTH_SECRET=supersharedsecret
    command: ["anchore-enterprise-manager", "service", "start",  "reports"]
  enterprise-ui-redis:
    image: "docker.io/library/redis:4"
    expose:
    - 6379
    logging:
      driver: "json-file"
      options:
        max-size: 100m
  enterprise-ui:
    image: docker.io/anchore/enterprise-ui:v0.5.0
    volumes:
    - ./license.yaml:/license.yaml:ro
    #- ./config-ui.yaml:/config/config-ui.yaml:z
    depends_on:
    - engine-api
    - enterprise-ui-redis
    - anchore-db
    ports:
    - "3000:3000"
    logging:
      driver: "json-file"
      options:
        max-size: 100m
    environment:
    - ANCHORE_ENGINE_URI=http://engine-api:8228/v1
    - ANCHORE_RBAC_URI=http://enterprise-rbac-manager:8228/v1
    - ANCHORE_REDIS_URI=redis://enterprise-ui-redis:6379
    - ANCHORE_APPDB_URI=postgres://postgres:mysecretpassword@anchore-db:5432/postgres
    - ANCHORE_REPORTS_URI=http://enterprise-reports:8228/v1
    - ANCHORE_POLICY_HUB_URI=https://hub.anchore.io

Once all containers are deployed, we can move into configuring SSO.

Configure the Keycloak Client

Adding a SAML client in Keycloak can be done following the instructions provided by SAML Clients in the Keycloak documentation.

  • Once logged into the Keycloak UI, navigate to Clients and select Add Client.
  • Enter http://localhost:3000/service/sso/auth/keycloak as the Client ID.
      • This will be used later in the Anchore Enterprise SSO configuration.
  • In the Client Protocol dropdown, choose SAML.
  • Enter http://localhost:3000/service/sso/auth/keycloak as the Client SAML Endpoint.
  • Select Save.

Once added, I can now configure the Anchore Enterprise SSO relevant sections. The majority of the defaults provided by Keycloak are sufficient for the purposes of this blog. However, some configurations do need to be changed.

  • Adding a Name helps identify the client in a user-friendly manner.
  • Adding a Description gives users more information about the client.
  • Set Client Signature Required to Off.
      • In this blog, I’m not setting up client public keys or certs in the SAML Tab, so I’m turning off validation.
  • Set Force POST Binding to Off.
      • Anchore requires the HTTP Redirect Binding to work, so this setting must be off to enable that.
  • Set Force Name ID Format to On.
      • Ignore any name ID policies and use the value configured in the admin console under Name ID Format.
  • Ensure Name ID Format is set to Username.
      • This should be the default.
  • Enter http://localhost:3000/service/sso/auth/keycloak to Valid Redirect URIs.
  • Ensure http://localhost:3000/service/sso/auth/keycloak is set as the Master SAML Processing URL.
      • This should be the default.
  • Expand Fine Grain SAML Endpoint Configuration add add http://localhost:3000/service/sso/auth/keycloak to Assertion Consumer Service Redirect Binding URL.

The configuration should look like the screenshot below, select Save.

I can now download the metadata XML to import into Anchore Enterprise.

  • Select the Installation tab.
  • Choose Mod Auth Mellon files from the Format Option dropbox.
  • Select Download.

Configure Anchore Enterprise SSO

Next, I will configure the Anchore Enterprise UI to use Keycloak for SSO.

  • Once logged into the Anchore Enterprise UI as Admin, navigate to Configuration.
  • Select SSO from the column on the left.
  • Select Let’s Add One under the SSO tab.

I will add the following configurations to the fields on the next screen, several fields will be left blank as they are not necessary for this blog.

  • Enter keycloak for the Name.
  • Enter -1 for the ACS HTTPS Port.
      • This is the port to use for HTTPS to the ACS (Assertion Consumer Service, in this case, the UI). It is only needed if you need to use a non-standard https port.
  • Enter http://localhost:3000/service/sso/auth/keycloak for the SP Entity ID.
      • The service provider entity ID must match the client ID used in the Keycloak configuration above.
  • Enter http://localhost:3000/service/sso/auth/keycloak for the ACS URL.
  • Enter keycloakusers for Default Account.
      • This can be any account name (existing or not) that you’d like the users to be members of.
  • Select read-write from the Default Role dropdown.
  • From the .zip file the downloaded from Keycloak in the above section, copy the contents of the idp-metadata.xml into IDP Metadata XML.
  • Uncheck Require Signed Assertions.
  • The configuration should look like the series of screenshots below, select Save.

After logging out of the Anchore Enterprise UI, there is now an option to authenticate with Keycloak.

After selecting the Keycloak login option, I am redirected to the Keycloak login page. I can now login with existing Keycloak users, in this case, “example”.


The example user did not exist in my Anchore environment but was added upon the successful login to Keycloak.

Conclusion

I have successfully gone through the configuration for both the Keycloak Client and Anchore Enterprise SSO. I hope this step-by-step procedure is helpful in setting up SSO for your Anchore Enterprise solution. For more information on Anchore Enterprise 2.1 SSO support, please see Anchore SSO Support. For the full Keycloak and other examples, see Anchore SSO Examples.

Seeking DevSecOps Engineers

Anchore is on a mission: to enable our customers to deploy software containers with confidence. We allow them to enjoy the benefits of cloud-native application development, safe in the knowledge that the containers they deploy into production are secure and compliant. With that confidence, they can continue to develop and ship software at breakneck speeds.

But that’s not all. We are also on a mission to create the defining technology company in one of today’s hottest technology spaces. As a start-up, we are looking for people who are as passionate about DevSecOps as we are and want to spend their days helping customers and users modernize their software development pipelines.

We’re always hiring across the team for all positions, but we urgently need DevSecOps Engineers to help our growing customer base adopt Anchore and develop best practices for container hardening and security. We’re looking for people who care passionately about creating something unique and want to have a visible impact on the success of Anchore and our customers.

If you’re interested in learning more please contact us at [email protected]. We’d love to meet you.

Anchore Engine in the AWS Marketplace

Container adoption is soaring in enterprises and the public sector, making services such as Amazon Elastic Kubernetes Service extremely valuable for DevOps teams that want to run containerized workloads in Kubernetes easily and efficiently. For organizations that are already deploying, scaling and managing containerized applications with Kubernetes, Amazon EKS spreads your workload across availability zones to ensure a robust implementation of your Kubernetes control plane.

Announcing Anchore Engine in the AWS Marketplace

We are very excited to announce the availability of Anchore Engine in the AWS Marketplace. Anchore Engine allows users to bring industry-leading open source container security and compliance to their container landscape in EKS. Deployment is done using the Anchore Engine Helm Chart, which can be found in GitHub. So if you are already running an EKS cluster with Helm configured, you can now deploy Anchore Engine directly from the AWS marketplace to tighten up your Container security posture.

With our unique approach to static scanning, DevOps teams can seamlessly integrate Anchore into their CI/CD pipeline to ensure that images are analyzed thoroughly for known vulnerabilities before deploying them into production. This will not only avoid the pain of finding and remediating vulnerabilities at runtime but also allow the end-user to define and enforce custom security policies to meet their specific company’s internal policies and any applicable regulatory security standards.

Getting Started

To get started, take a look at the Anchore Engine documentation to familiarize yourself with the basics. Then, once you have EKS set up, visit the Anchore Engine AWS Marketplace page to take the next steps. 

Anchore 2.1 Feature Series, Enhanced Vulnerability Data

With the release of Anchore Enterprise 2.1 (based on Anchore Engine 0.5.0), we are pleased to announce that Anchore Enterprise customers will now receive access to enhanced vulnerability data from Risk Based Security’s VulnDB for increased fidelity, accuracy, and live-ness of image vulnerability scanning results.

Recognizing that container images need an added layer of security, Anchore conducts a deep image inspection and analysis to uncover what software components are inside of the image, and generate a detailed manifest that includes packages, configuration files, language modules, and artifacts. Following analysis, user-defined acceptance policies are evaluated against the analyzed data to certify the container images.

As the open-source software components and their dependencies within container images quickly increase, so do the inherent security risks these packages often present. Anchore software will identify all operating systems and supported language packages (npm, Java, Python, Ruby), and importantly, map these packages to known vulnerabilities. In addition to package identification, Anchore also indexes every file in the container image filesystem, providing end-users complete visibility into the full contents.

Risk Based Security’s VulnDB

VulnDB provides the richest, most complete vulnerability intelligence available to help users and teams address points of risk across their organization – in the case of Anchore customers, security risks within container images. VulnDB provides over 70,000 additional vulnerabilities not found in the publicly available source Common Vulnerabilities and Exposures (CVE) database. Additionally, 45.5% of 2018 omissions from the CVE database are high to critical in severity. This ties directly into a key understanding we have here at Anchore: just being reliant on publicly available vulnerability sources is not sufficient for Enterprises looking to seriously improve their security posture.

Viewing vulnerability results in the Anchore UI

Just as in previous releases, Anchore Enterprise users can view vulnerability results for an image in the UI.

Below is a snapshot of Anchore Enterprise with vulnerable packages identified by VulnDB:

Diving deeper into a single VulnDB identifier presents the user with more information about the issue and provides links to external sources.

Below is a single VulnDB identifier record in Anchore Enterprise:

Note: As always, users can fetch vulnerability information via the Anchore API or CLI.

Given that more organizations are increasing their use of both containers and OSS components, it is becoming more critical for enterprises to have the proper mechanisms in place to uncover and fix vulnerable packages within container images as early as possible in the development lifecycle.

Enhanced Feed Comparison

We’ve also taken it upon ourselves to scan some commonly used images with Anchore Engine (no VulnDB) and Anchore Enterprise (with VulnDB) and investigate the deltas.

Here is an example of six images we tested:

As shown above, VulnDB provides our customers with additional vulnerability data than what is available publically. Allowing development, security, and operations teams to make more informed vulnerability and policy management decisions around their container image workloads.

Anchore 2.1 Feature Series, Local Image Analysis

With the release of Anchore Enterprise 2.1 (based on Anchore Engine 0.5.0), local image analysis is now available. Inline Analysis gives users the ability to perform image analysis on a locally built Docker image without the need for it to exist inside a registry. Local image scanning analyzes an image from a local Docker engine and exports the analysis into your existing Anchore Engine deployment.

Local Analysis vs Typical Anchore Deployments

While local scanning is convenient when access to a registry is not available, Anchore recommends scanning images that have been pushed to the registry as it is a more robust solution. Local scanning is not meant to alter the fundamental deployment of Anchore Engine nor the image analysis strategy of Anchore. Adding an image via local scanning removes some of the wonderful features that are included in Anchore, like monitoring a registry for image tag or repository updates, subscriptions, or webhook notifications. Rather, it is intended to allow users to analyze images as one-off events, such as prior to moving them to a registry or deploying them from tarball in an air-gapped network. Additionally, by extracting the image from the Docker engine, local analysis can be used to analyze images from custom-tailored sources, such as OpenShift source-to-image or Pivotal kpack builds, or even on systems that don’t access any Continuous Integration/Continuous Deployment (CI/CD) processes.

Running Local Analysis on an Air-Gapped Network

As an example for this blog, I chose to perform a local analysis on an image I built but doing so while my network was disconnected from the Internet. Many systems don’t have access to Internet-facing registries, such as Docker Hub.

Getting Started

To start, an Internet-accessible machine is required to pull the local image analysis script, Anchore Docker images, and the base Alpine Docker image I use for my local build.

Using the following docker-compose file on an Internet-accessible machine, I can pull down the Anchore Enterprise Docker images:

# All-in-one docker-compose deployment of a full anchore-enterprise service system
---
version: '2.1'
volumes:
  anchore-db-volume:
    # Set this to 'true' to use an external volume. In which case, it must be created manually with "docker volume create anchore-db-volume"
    external: false
  anchore-scratch: {}
  feeds-workspace-volume:
    # Set this to 'true' to use an external volume. In which case, it must be created manually with "docker volume create feeds-workspace-volume"
    external: false
  enterprise-feeds-db-volume:
    # Set this to 'true' to use an external volume. In which case, it must be created manually with "docker volume create enterprise-feeds-db-volume"
    external: false

services:
  # The primary API endpoint service
  engine-api:
    image: docker.io/anchore/anchore-engine:latest
    depends_on:
    - anchore-db
    - engine-catalog
    #volumes:
    #- ./config-engine.yaml:/config/config.yaml:z
    ports:
    - "8228:8228"
    logging:
      driver: "json-file"
      options:
        max-size: 100m
    environment:
    - ANCHORE_ENDPOINT_HOSTNAME=engine-api
    - ANCHORE_DB_HOST=anchore-db
    - ANCHORE_DB_PASSWORD=mysecretpassword
    - ANCHORE_AUTHZ_HANDLER=external
    - ANCHORE_EXTERNAL_AUTHZ_ENDPOINT=http://enterprise-rbac-authorizer:8228
    - ANCHORE_ENABLE_METRICS=true
    command: ["anchore-manager", "service", "start",  "apiext"]
  # Catalog is the primary persistence and state manager of the system
  engine-catalog:
    image: docker.io/anchore/anchore-engine:latest
    depends_on:
    - anchore-db
    #volumes:
    #- ./config-engine.yaml:/config/config.yaml:z
    logging:
      driver: "json-file"
      options:
        max-size: 100m
    expose:
    - 8228
    environment:
    - ANCHORE_ENDPOINT_HOSTNAME=engine-catalog
    - ANCHORE_DB_HOST=anchore-db
    - ANCHORE_DB_PASSWORD=mysecretpassword
    - ANCHORE_ENABLE_METRICS=true
    command: ["anchore-manager", "service", "start",  "catalog"]
  engine-simpleq:
    image: docker.io/anchore/anchore-engine:latest
    depends_on:
    - anchore-db
    - engine-catalog
    #volumes:
    #- ./config-engine.yaml:/config/config.yaml:z
    expose:
    - 8228
    logging:
      driver: "json-file"
      options:
        max-size: 100m
    environment:
    - ANCHORE_ENDPOINT_HOSTNAME=engine-simpleq
    - ANCHORE_DB_HOST=anchore-db
    - ANCHORE_DB_PASSWORD=mysecretpassword
    - ANCHORE_ENABLE_METRICS=true
    command: ["anchore-manager", "service", "start",  "simplequeue"]
  engine-policy-engine:
    image: docker.io/anchore/anchore-engine:latest
    depends_on:
    - anchore-db
    - engine-catalog
    #volumes:
    #- ./config-engine.yaml:/config/config.yaml:z
    expose:
    - 8228
    logging:
      driver: "json-file"
      options:
        max-size: 100m
    environment:
    - ANCHORE_ENDPOINT_HOSTNAME=engine-policy-engine
    - ANCHORE_DB_HOST=anchore-db
    - ANCHORE_DB_PASSWORD=mysecretpassword
    - ANCHORE_ENABLE_METRICS=true
    command: ["anchore-manager", "service", "start",  "policy_engine"]
  engine-analyzer:
    image: docker.io/anchore/anchore-engine:latest
    depends_on:
    - anchore-db
    - engine-catalog
    #volumes:
    #- ./config-engine.yaml:/config/config.yaml:z
    expose:
    - 8228
    logging:
      driver: "json-file"
      options:
        max-size: 100m
    environment:
    - ANCHORE_ENDPOINT_HOSTNAME=engine-analyzer
    - ANCHORE_DB_HOST=anchore-db
    - ANCHORE_DB_PASSWORD=mysecretpassword
    - ANCHORE_ENABLE_METRICS=true
    volumes:
    - anchore-scratch:/analysis_scratch
    command: ["anchore-manager", "service", "start",  "analyzer"]
  anchore-db:
    image: "postgres:9"
    volumes:
    - anchore-db-volume:/var/lib/postgresql/data
    environment:
    - POSTGRES_PASSWORD=mysecretpassword
    expose:
    - 5432
    logging:
      driver: "json-file"
      options:
        max-size: 100m
  enterprise-feeds-db:
    image: "postgres:9"
    volumes:
    - enterprise-feeds-db-volume:/var/lib/postgresql/data
    environment:
    - POSTGRES_PASSWORD=mysecretpassword
    expose:
    - 5432
    logging:
      driver: "json-file"
      options:
        max-size: 100m
  enterprise-rbac-authorizer:
    image: docker.io/anchore/enterprise:latest
    volumes:
    - ./license.yaml:/license.yaml:ro
    #- ./config-enterprise.yaml:/config/config.yaml:z
    depends_on:
    - anchore-db
    - engine-catalog
    expose:
    - 8089
    logging:
      driver: "json-file"
      options:
        max-size: 100m
    environment:
    - ANCHORE_ENDPOINT_HOSTNAME=enterprise-rbac-authorizer
    - ANCHORE_DB_HOST=anchore-db
    - ANCHORE_DB_PASSWORD=mysecretpassword
    - ANCHORE_ENABLE_METRICS=true
    command: ["anchore-enterprise-manager", "service", "start",  "rbac_authorizer"]
  enterprise-rbac-manager:
    image: docker.io/anchore/enterprise:latest
    volumes:
    - ./license.yaml:/license.yaml:ro
    #- ./config-enterprise.yaml:/config/config.yaml:z
    depends_on:
    - anchore-db
    - engine-catalog
    ports:
    - "8229:8228"
    logging:
      driver: "json-file"
      options:
        max-size: 100m
    environment:
    - ANCHORE_ENDPOINT_HOSTNAME=enterprise-rbac-manager
    - ANCHORE_DB_HOST=anchore-db
    - ANCHORE_DB_PASSWORD=mysecretpassword
    - ANCHORE_AUTHZ_HANDLER=external
    - ANCHORE_EXTERNAL_AUTHZ_ENDPOINT=http://enterprise-rbac-authorizer:8228
    - ANCHORE_ENABLE_METRICS=true
    command: ["anchore-enterprise-manager", "service", "start",  "rbac_manager"]
  enterprise-feeds:
    image: docker.io/anchore/enterprise:latest
    volumes:
    - feeds-workspace-volume:/workspace
    - ./license.yaml:/license.yaml:ro
    #- ./config-enterprise.yaml:/config/config.yaml:z
    depends_on:
    - enterprise-feeds-db
    ports:
    - "8448:8228"
    logging:
      driver: "json-file"
      options:
        max-size: 100m
    environment:
    - ANCHORE_ENDPOINT_HOSTNAME=enterprise-feeds
    - ANCHORE_DB_HOST=enterprise-feeds-db
    - ANCHORE_DB_PASSWORD=mysecretpassword
    - ANCHORE_ENABLE_METRICS=true
    command: ["anchore-enterprise-manager", "service", "start",  "feeds"]
  enterprise-reports:
    image: docker.io/anchore/enterprise:latest
    volumes:
    - ./license.yaml:/license.yaml:ro
    depends_on:
    - anchore-db
    - engine-catalog
    ports:
    - "8558:8228"
    logging:
      driver: "json-file"
      options:
        max-size: 100m
    environment:
    - ANCHORE_ENDPOINT_HOSTNAME=enterprise-reports
    - ANCHORE_DB_HOST=anchore-db
    - ANCHORE_DB_PASSWORD=mysecretpassword
    - ANCHORE_ENABLE_METRICS=true
    - ANCHORE_AUTHZ_HANDLER=external
    - ANCHORE_EXTERNAL_AUTHZ_ENDPOINT=http://enterprise-rbac-authorizer:8228
    command: ["anchore-enterprise-manager", "service", "start",  "reports"]
  enterprise-ui-redis:
    image: "docker.io/library/redis:4"
    expose:
    - 6379
    logging:
      driver: "json-file"
      options:
        max-size: 100m
  enterprise-ui:
    image: docker.io/anchore/enterprise-ui:latest
    volumes:
    - ./license.yaml:/license.yaml:ro
    #- ./config-ui.yaml:/config/config-ui.yaml:z
    depends_on:
    - engine-api
    - enterprise-ui-redis
    - anchore-db
    ports:
    - "3000:3000"
    logging:
      driver: "json-file"
      options:
        max-size: 100m
    environment:
    - ANCHORE_ENGINE_URI=http://engine-api:8228/v1
    - ANCHORE_RBAC_URI=http://enterprise-rbac-manager:8228/v1
    - ANCHORE_REDIS_URI=redis://enterprise-ui-redis:6379
    - ANCHORE_APPDB_URI=postgres://postgres:mysecretpassword@anchore-db:5432/postgres
    - ANCHORE_REPORTS_URI=http://enterprise-reports:8228/v1
    - ANCHORE_POLICY_HUB_URI=https://hub.anchore.io

I can pull the images with the following command:

$ docker-compose -f docker-compose-enterprise.yaml pull
Pulling anchore-db ... done
Pulling engine-catalog ... done
Pulling engine-analyzer ... done
Pulling engine-policy-engine ... done
Pulling engine-simpleq ... done
Pulling engine-api ... done
Pulling enterprise-feeds-db ... done
Pulling enterprise-rbac-authorizer ... done
Pulling enterprise-rbac-manager ... done
Pulling enterprise-feeds ... done
Pulling enterprise-reports ... done
Pulling enterprise-ui-redis ... done
Pulling enterprise-ui ... done

Next, I’ll pull the Inline Scan image from Anchore:

$ docker pull docker.io/anchore/inline-scan:v0.5.0
Pulling docker.io/anchore/inline-scan:v0.5.0
v0.5.0: Pulling from anchore/inline-scan
c8d67acdb2ff: Already exists
79d11c1a86c4: Already exists
ced9ca3af39b: Already exists
c1e8af2e6afa: Already exists
ca674bdc4ffc: Already exists
7fa29b97cf4f: Already exists
15f5109f7371: Already exists
662a1f6a8a80: Already exists
6e87d34cd76e: Pull complete
7f7b513db561: Pull complete
5c7e09ac2f74: Pull complete
b50890f6248a: Pull complete
5f8043f17686: Pull complete
3a3cdaeaf045: Pull complete
c877ae27c8fe: Pull complete
58edd3c9fcf5: Pull complete
0ef916eddeef: Pull complete
Digest: sha256:650a7fae8f95286301cdb5061475c0be7e4fb762ba2c85ff489494d089883c1c
Status: Downloaded newer image for anchore/inline-scan:v0.5.0

Now I will pull the local image analysis script using curl from anchore.io’s ci-cd endpoint and make it executable:

$ curl -o inline_scan.sh https://ci-tools.anchore.io/inline_scan-v0.5.0
$ chmod +x inline_scan.sh

Finally, I will pull down the base Alpine image that I will use to build my local Docker image:

$ docker pull docker.io/library/alpine:latest

From here, I disconnect my Internet connection as the rest of the example is simulating an air-gapped network

Deploying Anchore Enterprise

In this example, I deploy Anchore Enterprise because the UI makes it simple to see results from the local image I analyze. Local image analysis is also available with OSS Anchore Engine v0.5.0.

Using the same docker-compose-enterprise.yaml from above, I can now deploy Anchore Enterprise:

$ docker-compose -f docker-compose-enterprise.yaml up -d
Creating network "aevolume_default" with the default driver
Creating aevolume_anchore-db_1 ... done
Creating aevolume_enterprise-ui-redis_1 ... done
Creating aevolume_enterprise-feeds-db_1 ... done
Creating aevolume_engine-catalog_1 ... done
Creating aevolume_enterprise-feeds_1 ... done
Creating aevolume_engine-simpleq_1 ... done
Creating aevolume_enterprise-reports_1 ... done
Creating aevolume_engine-analyzer_1 ... done
Creating aevolume_engine-policy-engine_1 ... done
Creating aevolume_enterprise-rbac-authorizer_1 ... done
Creating aevolume_enterprise-rbac-manager_1 ... done
Creating aevolume_engine-api_1 ... done
Creating aevolume_enterprise-ui_1 ... done

Build Local Image

For this example, I built the simplest Docker image from this Dockerfile:

FROM docker.io/library/alpine:latest

CMD echo "hello world"

Then I built it with:

$ docker build . -t local/example:latest
Sending build context to Docker daemon 2.048kB
Step 1/2 : FROM docker.io/library/alpine:latest
latest: Pulling from library/alpine
9d48c3bd43c5: Pull complete
Digest: sha256:72c42ed48c3a2db31b7dafe17d275b634664a708d901ec9fd57b1529280f01fb
Status: Downloaded newer image for alpine:latest
---> 961769676411
Step 2/2 : CMD echo "hello world"
---> Running in 74bdcd240547
Removing intermediate container 74bdcd240547
---> 325116ad4e62
Successfully built 325116ad4e62
Successfully tagged local/example:latest

Once built, I can view it in my local Docker images with:

$ docker images
REPOSITORY       TAG     IMAGE ID      CREATED        SIZE
local/example    latest  373de5bd56d3  9 seconds ago  5.58MB

Running Local Analysis

Since I haven’t really done anything with my local Docker image except echo “hello world”, any vulnerabilities found during the analysis will be a reflection on the base image used; in this case docker.io/library/alpine:latest.

I can perform the analysis on the image, passing in the URL to my locally running Anchore Engine, the username (admin), the password (foobar), the path to my Dockerfile, and the full image tag.

$ ./inline_scan.sh analyze -r https://localhost:8228/v1 -u admin -p foobar -f dockerfile local/example:latest
docker.io/anchore/inline-scan:v0.5.0
Saving local/example:latest for local analysis
Successfully prepared image archive -- /tmp/anchore/example:latest.tar

Analyzing local/example:latest...
[MainThread]  [INFO] using fulltag=localbuild/local/example:latest fulldigest=localbuild/local/example@sha256:325116ad4e6211cfec2acaea612b9ae78b2a2768ec71ea37c68e416730c95efa
 Analysis complete!

Sending analysis archive to http://localhost:8228


Cleaning up docker container: c492f64a122a9631eaf616f5018ad22b55379f8595839a9ea1e69fd110a2dfe5

Viewing the Results

After running the analysis, the results are imported into my Anchore Engine running locally and can now be viewed in the Enterprise UI.

After signing in and navigating to “Image Analysis”, I can see my locally built Docker image listed:

When I dig down into the analyzed image, I can see the vulnerability findings from the local analysis as if it were an image pulled from a registry:

Conclusion

I have successfully executed an analysis of a locally built image on an air-gapped network. I hope this overview of the new local image analysis from Anchore was able to provide some insight into it’s recommended use and that the example provided helps you with your container security needs. For more information regarding local image analysis, please see our inline analysis documentation.

Announcing Anchore Enterprise 2.1

Today, we’re pleased to announce the immediate availability of Anchore Enterprise 2.1, our latest enterprise solution for container security. Anchore Enterprise provides users with the tools and techniques needed to enforce security, compliance and best-practices requirements with usable, flexible, cross-organization, and—above all—time-saving technology from Anchore. This release is based on the all-new Anchore Engine 0.5.0, which is also available today.

New Features of Anchore Enterprise 2.1

Building upon our 2.0 release in May, Anchore Enterprise 2.1 adds major new features and architectural updates that extend integration/deployment options, security insights, and the evaluation power available to all users.

Major new features and resources launched as part of Anchore Enterprise 2.1 include:

  • GUI report enhancements: Leveraging Anchore Enterprise’s reporting service, there is a new set of configurable queries available within the Enterprise GUI Reports control. Users can now generate filtered reports (tabular HTML, JSON, or CSV) that contain image, security, and policy evaluation status for collections of images.
  • Single-Sign-On (SSO): Integration support for common SSO providers such as Okta, Keycloak, and other Enterprise IDP systems, in order to simplify, secure, and better control aspects of user management within Anchore Enterprise
  • Enhanced authentication methods: SAML / token-based authentication for API and other client integrations
  • Enhanced vulnerability data: Inclusion of third party vulnerability data feeds from Risk Based Security (VulnDB) for increased fidelity, accuracy, and live-ness of image vulnerability scanning results, available for all existing and new images analyzed by Anchore Enterprise
  • Policy Hub GUI: View, list and import pre-made security, compliance and best-practices policies hosted on the open and publicly available Anchore Policy Hub
  • Built on Anchore Engine v0.5.0: Anchore Enterprise is built on top of the OSS Anchore Engine, which has received new features and updates as well (see below for details)

Anchore Engine

Anchore Enterprise 2.1 is built on top of Anchore Engine version 0.5.0, a new version of the fully functional core services that drive all Anchore deployments. Anchore Engine has received a number of new features and other new project updates:

  • Vulnerability Data Enhancements: The Anchore Engine API and data model has been updated to include CVE references (for vulnerabilities that can refer to several CVEs) and CVSSv3 scoring information
  • Local Image Analysis: New tooling to support isolated container image analysis outside of Anchore Engine, generating an artifact that can be imported into your on-premises Anchore Enterprise deployment
  • Policy Enhancements: Many new vulnerability check parameters, enabling the use of CVSSv3 scores, vendor-specific scores, and new time-based specifications for even more expressive policy checks

For a full description of new features, improvements and fixes available in Anchore Engine, view the release notes.

Once again, we would like to sincerely thank all of our open-source users, customers and contributors for spirited discussion, feedback, and code contributions that are part of this latest release of Anchore Engine. If you’re new to Anchore, welcome! We would like nothing more than to have you join our community.

Anchore Enterprise 2.1—Available Now

With Anchore Enterprise 2.1, available immediately, our goal has been to expand the integration, secure deployment, and policy evaluation power for all Anchore users as an evolution of the features available already to existing users.

For users looking for comprehensive solutions to the unique challenges of securing and enforcing best-practices and compliance to existing CI/CD, container monitoring and control frameworks, and other container-native pipelines, we sincerely hope you enjoy our latest release of Anchore software and other resources—we look forward to working with you!

Precogs for Software To Spot Vulnerabilities?

There are some movies which provide an immediate dose of entertainment for 2 hours and you instantly forget them afterwards. Others lurk within you, and constantly resurface to make you think about ideas or concepts. The 2002 movie Minority Report is one of the latter. In it, a police department is setup to investigate “precrime” based on foreknowledge provided by psychic humans called “precogs”. The dilemma of penalizing people who have not actually done anything is an interesting philosophical conundrum that resonates in contemporary topics. One example is the potential for insurance companies to not cover people who show genetic disposition to certain illnesses, even while not being ill.

In the modern world rather than the future shown in the movie, computer crime and, more broadly, data breaches are now so common that we barely notice them, despite the fact they often have material impacts on us as individuals (see: Equifax). Fortunately, we actually do have something close to precogs in the software world which, while not allowing us to arrest criminals, do allow us to know when something is really likely to happen and do something about it.

Many vendors and government agencies produce long lists of known software vulnerabilities that have a good chance of being exploited. Yet, the reality is that most organizations don’t do anything with them because they don’t even know they are running the affected software or because they do know what is running but don’t have the time to fix it. 

I recently joined Anchore as VP of Products motivated by the opportunity to fix this problem. Like many, I’ve been amazed at the huge uptake in containers across the industry and, as a long time open source advocate, excited about the way it has allowed companies to take advantage of the huge ecosystem of open source software. However, I’ve also been cognizant that this new wave of adoption has increased the attack surface for companies and made the challenge of securing dynamic and heterogeneous environments even harder.

In meeting with the team at Anchore, it was clear that they really understood containers and had gone a long way to solving the problem. The solution that Anchore has built not only tells you what software you are running (by scanning your repos) but enables teams to prevent bad software being deployed in the first place, using customizable policies which react to defects found in operating system and software library packages, as well as poorly implemented best practices. By enabling so-called DevOpSec processes, Anchore can help development teams become more efficient and spread the load of security responsibility – the only way we can tackle the mountain of vulnerabilities that come out every day. It may not quite be precogs, but it’s pretty close.

I’ve been creating and deploying infrastructure software for over 20 years so have probably contributed a fair degree of security flaws to the world. I’m looking forward to joining the other side and working with our customers to making the new cloud native world a more secure one.

Answers to your Top 3 Compliance Questions

Policy first is a distinguishing tenet for Anchore as a product in today’s container security marketplace. When it comes to policy, we at Anchore receive a lot of questions from customers regarding different compliance standards, guidelines, and how the Anchore platform can help meet their requirements which remain a priority. Today, we will review our top three (in no particular order) policy and compliance questions we receive to demonstrate how Anchore can alleviate some of policy/compliance woes when choosing a container security tool to bring into your tech stack.

How can Anchore Help me Satisfy NIST 800-53 controls?

We receive a lot of questions regarding how Anchore can help different organizations meet compliance baselines that deal heavily with the implementation of NIST 800-53 controls. As a result, we talk about a lot of controls we satisfy in our federal white paper on container security. At a high level, Anchore helps organizations satisfy requirements for RA-5: Vulnerability Scanning, SI-2 Flaw Remediation, CA-7 Continuous Monitoring.

However, Anchore does more than just help organizations with vulnerability scanning and policy enforcement with containers. As a part of our process, Anchore provides an in-depth inspection of the image as they pass through Anchore analyzers that enforce whitelisted and blacklisted attributes such as ports/protocols, types of images, and types of OS as described in our previous blog post. Anchore Enterprise users can customize and enforce whitelisting/blacklisting within the Anchore Enterprise UI, navigating to the Whitelists tab will show the lists of whitelists that are present in the current DoD security policies bundle.

As a result, this allows organizations to comply with configuration management controls as well, specifically CM-7(5) Least Functionality: Whitelisting/Blacklisting in addition to CM-7(4) Unauthorized Software and Blacklisting. To prevent unauthorized software from entering your image, simply selecting “whitelist/blacklist” images tab as demonstrated below which allows you to blacklist OS, image, or packages :

How does Anchore Help Organizations Meet the Guidelines Specified in NIST 800-190: Application Container Security Guide?

Anchore provides a policy first approach to automated vulnerability scanning and compliance scanning for Docker images. By having customizable policies at the center of Anchore Engine itself, we provide the capability to react swiftly as new Federal security policies are published. NIST 800-190 was no different for the Anchore team. NIST 800-190 specifies, “Organizations should automate compliance with container runtime configuration standards. Documented technical implementation guidance, such as the Center for Internet Security Docker Benchmark.” 

Out of the box, Anchore provides a CIS Policy Bundle for open source and Enterprise users alike which allows you to check for Host Configuration, Docker daemon configuration, Docker daemon configuration files, Container Images and Build File, and Container Runtime. Below, we can see how the latest Postgres image stacks up against the CIS Benchmarks called out in NIST 800-190:

Anchore platform displaying image analysis.

From here, we would recommend hardening the image to comply with the CIS benchmarks before advancing this image into production.

Is Anchore FIPS 140-2 Validated?

Anchore is not a FIPS 140-2 validated product, nor is it a FIPS 140-2 Compliant product. However, it’s important to explain why Anchore has no plans on becoming FIPS 140-2 Validated. As NIST explains FIPS 140-2 applicability is listed here:

 “This standard is applicable to all Federal agencies that use cryptographic-based security systems to protect sensitive information in computer and telecommunication systems (including voice systems) as defined in Section 5131 of the Information Technology Management Reform Act of 1996, Public Law 104-106. This standard shall be used in designing and implementing cryptographic modules that Federal departments and agencies operate or are operated for them under contract…”

A majority of the products found on the list deal with validating encryption as a protection mechanism for products associated with networking hardware or hardware/software involved in the identification and authentication of users into an environment that is outside of the scope of the Anchore product. Anchore believes it is important to protect sensitive information generated from Anchore scanning. However, Anchore does not provide FIPS 140-2 validated protection of that information. Rather, Anchore believes it is the responsibility of the team managing Anchore deployments to protect the data generated from Anchore which can be done using FIPS 140-2 validated products. As of 2018, Docker became the first container relevant vendor to have a FIPS 140-2 validated product with the Docker Enterprise Edition Crypto Library. Furthermore, no other container security tools in the market are FIPS 140-2 validated. 

Conclusion

Although we simply covered NIST standards in this post due to its wide use and popularity amongst our customers, Anchore Enterprise exists as a policy first tool that provides teams with the flexibility to adapt their container vulnerability scanning in a timely fashion to comply with any compliance standard across various markets. Please contact our Anchore team if you are having trouble enforcing a compliance standard or if there is a custom Anchore policy bundle we can create in line with your current compliance needs.

Using Anchore to Identify Secrets in Container Images

Building containerized applications inherently bring up the question of how to best give these applications access to any sensitive information they may need. This sensitive information can often be in the form of secrets, passwords, or other credentials. This week I decided to explore a couple of bad practices / common shortcuts and some simple checks you can configure using both Anchore Engine and Enterprise to integrate into your testing to achieve a more polished security model for your container image workloads.

Historically, I’ve seen a couple “don’ts” for giving containers access to credentials:

  • Including directly in the contents of the image
  • Defining a secret in a Dockerfile with ENV instruction

The first should be an obvious no. Including sensitive information within a built image, is giving anyone who has access to the image, access to those passwords, keys, creds, etc. I’ve also seen this placement of secrets inside of the container image using the ENV instruction. Dockerfiles are likely managed somewhere, and exposing them in clear text is a practice that should be avoided. A recommended best practice is not only to check for keys and passwords as your images are being built, but implement the proper set of tools for true secrets management (not the above “don’ts”). There is an excellent article written by Hashicorp on Why We Need Dynamic Secrets which is a good place to start.

Using the ENV instruction

Below is a quick example of using the ENV instruction to define a variable called AWS_SECRET_KEY. Both AWS Access Keys consist of two parts: an access key ID and a secret access key. These credentials can be used with AWS CLI or API operations and should be kept private.

FROM node:6

RUN mkdir -p /home/node/ && apt-get update && apt-get -y install curl
COPY ./app/ /home/node/app/

ENV AWS_SECRET_KEY="1234q38rujfkasdfgws"

For argument’s sake, let’s pretend I built this image and ran the container with the following command:

docker run --name bad_container -d jvalance/node_critical_fail
$ docker ps | grep bad_container
3bd970d05f16        jvalance/node_critical_fail     "/bin/sh -c 'node /h…"   13 seconds ago      Up 12 seconds         22/tcp, 8081/tcp         bad_container

And now exec into it with the following: docker exec -ti 3bd970d05f16 /bin/bash to bring up a shell. Then run the env command:

# env 
YARN_VERSION=1.12.3
HOSTNAME=3bd970d05f16
PWD=/
HOME=/root
AWS_SECRET_KEY=1234q38rujfkasdfgws
NODE_VERSION=6.16.0
TERM=xterm
SHLVL=1
PATH=/usr/local/sbin:/usr/local/bin:/usr/sbin:/usr/bin:/sbin:/bin
_=/usr/bin/env

Now you can see that I’ve just given anyone with access to this container the ability to grab any environment variable I’ve defined with the ENV instruction.

Similarly with the docker inspect command:

$ docker inspect 3bd970d05f16 -f "{{json .Config.Env}}"
["PATH=/usr/local/sbin:/usr/local/bin:/usr/sbin:/usr/bin:/sbin:/bin","NODE_VERSION=6.16.0","YARN_VERSION=1.12.3","AWS_SECRET_KEY=1234q38rujfkasdfgws"]

Storing Credentials in Files Inside the Image

Back to our example of a bad Dockerfile:

FROM node:6

RUN mkdir -p /home/node/ && apt-get update && apt-get -y install curl
COPY ./app/ /home/node/app/

ENV AWS_SECRET_KEY="1234q38rujfkasdfgws"

Here we are copying the contents of the app directory into home/node/app inside the image. Why is this bad? Here’s an image of the directory structure:

AWS directory structure image.

and specifically the contents of the credentials file:

# credentials

[default]
aws_access_key_id = 12345678901234567890
aws_secret_access_key = 1a2b3c4d5e6f1a2b3c4d5e6f1a2b3c4d5e6f1a2b
[kuber]
aws_access_key_id = 12345678901234567890
aws_secret_access_key = 1a2b3c4d5e6f1a2b3c4d5e6f1a2b3c4d5e6f1a2b

Same as I did before, I’ll try to find the creds in the container.

/home/node/app# cat .aws/credentials 
[default]
aws_access_key_id = 12345678901234567890
aws_secret_access_key = 1a2b3c4d5e6f1a2b3c4d5e6f1a2b3c4d5e6f1a2b
api_key = 0349r5ufjdkl45
[kuber]
aws_access_key_id = 12345678901234567890
aws_secret_access_key = 1a2b3c4d5e6f1a2b3c4d5e6f1a2b3c4d5e6f1a2b

Checking for the Above with Anchore

At Anchore, a core focus of ours is centered around conducting a deep image inspection to give users comprehensive insight into the contents of their container images, and to provide users the ability to define flexible policy rules to enforce security and best-practices. By understanding that container images are composed are far more than just lists of packages, Anchore takes a comprehensive approach but providing users the ability to check for the above examples.

Using the policy mechanisms of Anchore, users can define a collection of checks, whitelists, and mappings (encapsulated as a self-contained Anchore policy bundle document). Anchore policy bundles can then be authored to encode a variety of rules, including checks within (but not limited to) Dockerfile line checks for the presence of credentials. Although I will never recommend the bad practices used in the above examples for secrets, we should be checking for them nonetheless.

Policy Bundle

A policy bundle is a single JSON document, which is composed of:

  • Policies
  • Whitelists
  • Mappings
  • Whitelisted Images
  • Blacklisted Images

The policies component of a bundle defines the checks to make against an image and the actions to recommend if the checks to find a match.

Example policy component of a policy bundle:

"name": "Critical Security Policy",
  "policies": [
    {
      "comment": "Critical vulnerability,  secrets, and best practice violations",
      "id": "48e6f7d6-1765-11e8-b5f9-8b6f228548b6",
      "name": "default",
      "rules": [
        {
          "action": "STOP",
          "gate": "dockerfile",
          "id": "38428d50-9440-42aa-92bb-e0d9a03b662d",
          "params": [
            {
              "name": "instruction",
              "value": "ENV"
            },
            {
              "name": "check",
              "value": "like"
            },
            {
              "name": "value",
              "value": "AWS_.*KEY"
            }
          ],
          "trigger": "instruction"
        },
        {
          "action": "STOP",
          "gate": "secret_scans",
          "id": "509d5438-f0e3-41df-bb1a-33013f23e31c",
          "params": [],
          "trigger": "content_regex_checks"
        },...

The first policy rule uses the dockerfile gate and instruction trigger to look for AWS environment variables that may be defined in the Dockerfile.

The second policy rule uses the secret scans gate and content regex checks trigger to look for AWS_SECRET_KEY and AWS_ACCESS_KEY within the container image.

It is worth noting that there is an analyzer_config.yaml file which is taking care of the regex definitions.

For the purposes of this post, I’ve analyzed an image that includes the two bad practices discussed earlier and evaluated the analyzed image against a policy bundle that contains the rule definitions above. It should catch the poor practices!

Here is a screenshot of the Anchore Enterprise UI Policy Evaluation table:

Anchore Enterprise UI policy evaluation table overview.

The check output column clearly informs us what Anchore found for each particular trigger ID line item and importantly, the STOP action which helps to determine the final result of the policy evaluation.

We can see very clearly that these policy rule definitions have caught both the ENV variable and credentials file. If this were plugged into a continuous integration pipeline, we could fail the build on this particular container image and put the responsibility on the developer to fix, rebuild, and never ship this image to a production registry.

Putting this in Practice

In summary, it is extremely important to put checks in-place with a tool like Anchore to align with your container image build frequency. For secrets management, an overall best practice I recommend is using a secret store like Vault to handle the storage of sensitive data. Depending on the orchestrator you are using for your containers, there are some options. For Kubernetes, there is Kubernetes Vault. Staying with the Hashicorp suite, there are some options here as well for dynamic secrets: Vault Integration and Retrieving Dynamic Secrets.

The above is an excellent system to have in place. I will continue to advocate for including image scanning and policy enforcement as a mandatory step in continuous integration pipelines because it directly aligns with the practice of bringing security as far left in the development lifecycle as possible to catch issues early. Taking a step back to plan and put in place solutions for managing secrets for your containers, and securing your images, will drastically improve your container security stance from end to end and allow you to deploy with confidence.

Securing Multi-Cloud Environments with Anchore

Many organizations today are currently leveraging multiple cloud providers for their cloud-native workloads. An example of such could be, a mix of several public cloud providers such as AWS, GCP, or Azure. Or perhaps a combination of a private cloud such as OpenStack, along with any public cloud provider. By definition, multi-cloud is a cloud approach that is made up of more than one cloud service, from more than one cloud vendor (public or private). At Anchore, we work with many users and customers who are faced with the challenge of adopting an effective container security strategy across the multiple cloud environments that they manage.

Anchore is a leading provider of container security and compliance enforcement solutions designed for open-source users and enterprises. Anchore provides vulnerability and policy management tools built to surface comprehensive container image package and data content, protect against security threats, and check for best-practices. All of this is wrapped in an actionable policy enforcement engine and language capable of evolving over time as compliance needs change. Flexible and robust enough for the security and policy controls regulated industry verticals need to effectively adopt cloud-native technologies at scale.

Deployment

Both Anchore Engine and Enterprise are shipped and delivered as Docker containers, providing tremendous deployment flexibility across every major public cloud providers managed Kubernetes service (Amazon EKS, Azure Kubernetes Service, Google Kubernetes Engine), container platform (Red Hat OpenShift), or on-premise.

Container Registry Support

Anchore natively integrates with any public or private Docker V2 compatible container registry including the major cloud providers (Amazon ECR, Google Container Registry, Azure Container Registry), or on-premise installations (JFrog Artifactory, Sonatype Nexus, Docker, etc.).

Continuous Integration

Anchore seamlessly plugs into any CI system, providing users with pre-production security, compliance, and best-practice enforcement checks directly in their CI pipelines. Users and customers can use Anchore’s native plugins for Jenkins and CircleCI, or integrate into the CI platform of their choice (Amazon CodeBuild, Azure DevOps, TravisCI, etc.).

Kubernetes Admission Control

Anchore provides an admission controller for Kubernetes to gate pod execution based on Anchore analysis and policy evaluation of image content. It supports three different modes of operation allowing users to tune the tradeoff between control and intrusiveness for their environments. Anchore Kubernetes Admission Controller supports integrations with the major cloud providers managed Kubernetes services as well as on-premise.

Multi-Tenancy Support

Anchore Enterprise provides full Role-Based Access Control functionality, allowing organizations to manage multiple teams, users, and permissions, all from a central Anchore installation. Security, Operations, and Development teams can operate separately. Maintaining full isolation of image scan results, policy rule configurations, and custom reports.

At Anchore, we understand the benefits of an effective multi-cloud strategy. However, we are also aware of the challenges, and risks development, security, and operations teams face when securing workloads across clouds. By utilizing a CI and container registry agnostic platform, Anchore users can easily adopt a refined container security and compliance practice across all of their public and private cloud environments.

Bridging the Gap Between Speed and Security: A Deep Dive into Anchore Federal’s Container Image Inspection and Vulnerability Management

In today’s DevOps environment, developers and security teams are more intertwined than ever with increased speed to production. Enterprises are using hundreds to thousands of Docker images making it more difficult to maintain an accurate list of software inventory, and track software packages and vulnerabilities across their container workloads. This becomes a recurring headache for Federal DevSecOps teams who are trying to maintain control over the environment by monitoring for unauthorized software on the information system. Per National Security Agency (NSA) guidance, security teams should actively monitor and remove unauthorized, outdated, and potentially malicious software from the information system while simultaneously making timely updates to their software stack.

Fortunately, Anchore Federal can simplify this process for DevSecOps teams and development teams alike by inspecting Docker images in all container registries, analyzing the specific software components within a given image, and then visualizing every software package for the developer in the Anchore Federal UI. For this blog post, we will explore how we can positively impact our security posture by maintaining strong configuration control over the software in our environment using Anchore Federal to analyze, inspect, and visualize the contents of each image.

Looking to learn more about how to achieve container hardening at DoD levels of security? One of the most popular technology shortcuts is to utilize a DoD software factory. Anchore has been helping organizations and agencies put the Sec in DevSecOps by securing traditional software factories, transforming them into DoD software factories.

Anchore’s Image Inspection to Support Configuration Management Best Practices

For this demo, I’ve selected Logstash version 7.2.0 from DockerHub and analyzed this image against Anchore’s DoD security policies bundle found in Anchore’s policy hub. You can also navigate to the “Policy Bundles” tab in Anchore Federal UI by navigating to the “Policy Bundles” tab where we can see that we are using the “anchore_dod_security_policies” bundle as our default policy.

After validating the DoD policies are set, we then initiate the vulnerability scan against the Logstash image. Anchore automatically analyzes the image for not only CVEs, but evaluates the entire image contents against a comprehensive list of DoD security and compliance standards using our DoD security policies bundle. Anchore Federal automatically displays the results of the image scan in our “Image Analysis” tab as depicted below:

screenshot of anchore image analysis

From the overview page, the user can easily see the compliance and vulnerability results generated against our DoD security policies. Taking this a step deeper, we then can begin inspecting the content of the image itself by navigating to the “Contents” tab. This extends beyond just a list of CVE’s, vulnerabilities and compliance checks. Anchore Federal provides the user with a total list of all of the different types of software packages, OS packages, and files that are found in the selected image:

screenshot of anchore software content view

This provides an integral point of analysis that allows the user to inventory and identify the different types of software and software packages that are within your environment. This is greatly needed across Federal organizations aiming to comply with DoD RMF and FedRAMP configuration management security controls.

Keeping the importance of configuration management in mind, Anchore Federal seamlessly integrates configuration management with security to magnify specific packages tied to vulnerabilities.

Unifying Configuration Management with Container Security

Anchore Federal allows the user to focus on adversely impacted packages by placing them front and center to the user. Navigating to the “Vulnerabilities” tab from the overview page allows you to see the adversely impacted packages. Anchore clearly displays that there is a CVE tied to the impacted Python package in the screenshot below:

screenshot of anchore vulnerabilities view

From here, the security analyst would immediately want to be alerted to the other images in their environment that are impacted by the vulnerability. Anchore Federal automatically does this for you and links that affected package across all of the images in your repository. Anchore Federal also automatically generates reports of affected packages by selecting “Other Images Sharing Package.” In this example, we can see that our Elasticsearch image is also impacted by the vulnerability tied to this Python package:

screenshot of linked packages in anchore

You can tailor the reports accordingly by using the parameters to filter on any specific package and package version. Anchore takes care of the rest and automatically informs DevSecOps teams about all of the images tied to every package containing a vulnerability. This provides teams with the vulnerability information necessary to carry out vulnerability remediation across the impacted images for their organization.

Anchore Federal takes the burden off of the DevSecOps teams by integrating configuration management with Anchore’s deep image inspection vulnerability scanning and “policy first” compliance approach. As a result, Federal organizations don’t have to worry about sacrificing configuration management. Instead, using Anchore Federal, organizations can enhance configuration control of their environment, gain the valuable insight of software packages within each container, and remediate vulnerable software packages to closure in a timely manner.

Federal Container Security Best Practices, Whitelist/Blacklist

Last week, Anchore went public with our federal white paper ​Container Security for U.S. Government Information Systems​ which contained key guidance for US government personnel responsible for securing container deployments on US government information systems. One of the key components of the whitepaper focused on utilizing a container-native security tool with the ability to whitelist and blacklist different packages, ports/protocols, and services within container images in order to maintain security in depth across environments.

Today we will focus on how Anchore integrates whitelisting and blacklisting into our custom DoD Security Policies bundle to provide in-depth security enforcement for our customers.

Whitelisting with Anchore Enterprise

Anchore provides pre-configured out of the box DoD and CIS policy bundles that serve as the unit of policy definition and evaluation for enforcing container security and compliance. Within these policies, Anchore engineers have worked to develop comprehensive whitelists of authorized software packages, users, and user permissions.

Additionally, users can whitelist specific ports that apply to each service running within their container image in order to validate that only authorized ports are open for their containers when they are pushed into production.

This is a critical part of maintaining any kind of acceptable cybersecurity posture for a federal information system since assessment teams are constantly inspecting for unauthorized ports, protocols, and services running on US government information systems. Additionally, whitelisting is critical to SecOps teams that need to tailor whitelists for CVE’s to account for false positives that continuously appear in their scans. When done correctly, whitelists are an effective strategy for validating only authorized images and software packages are installed on your system. Through whitelisting, the security team can minimize the false positive rate and simultaneously maximize their security posture by using Anchore’s scanning policies that will only allow authorized images, ports/protocols, and packages in container images that end up handling production workloads.

Anchore Enterprise makes whitelisting extremely simple. Within the Anchore Enterprise UI, navigating to the Whitelists tab will show the lists of whitelists that are present in the current DoD security policies bundle.


From here, the user can tailor the whitelist specific to their environment. For example, you can edit the existing DoD security policies bundle to fit the needs of your environment by entering the CVE/Vulnerability identifier and package name:


The policy bundle is then automatically updated to reflect the updated whitelist and you are now ready to begin scanning using your tailored policy. Anchore Enterprise provides this flexibility specifically for security teams and development teams that need to comply with various policy requirements while not adversely impacting deployment velocity.

Blacklisting with Anchore Enterprise

Conversely, the infosec best practice of blacklisting can also be done using Anchore Enterprise. Again, with Anchore’s out-of-the-box DoD security policy bundle, customers have SSH-22 and Telnet-23 blacklisted by default. Blacklisting of Telnet and SSH as evident in the screenshot of the DoD security policy bundle:

SecOps teams can take this a step further and tailor the policy bundle to blacklist additional ports if needed by navigating to edit the exposed ports check:

Upon each scan, Anchore can then take inspection a step further to blacklist certain types of effective users found in an image. One of these checks that Anchore incorporated into the DoD security policy is validating the effective user is ​not​ set to root. By looking at the DoD Security

Policy Bundle below through our Anchore Enterprise console, we can see that the Anchore DoD Security Policies is automatically validating the effective user that we have blacklisted:


If SecOps teams have data indicating known malicious software packages, then they should be utilizing a tool to block known packages from being incorporated into Docker images that will eventually end up deployed on a Federal information system. Again, you could do this by navigating to the DoD security policies bundle and selecting “whitelisting/blacklisting” as seen below:


From here, you are just seconds away from improving your security posture and blacklisting images from being pushed into production. By simply selecting “let’s add one” the user can then specify an image to blacklist based on Image Name, Image ID, or by Image Digest :

With Anchore’s policy first approach, enforcing whitelisting/blacklisting for Docker images has never been easier as it serves to meet the various security baselines and requirements that span across the US Government space. Anchore provides the flexibility to meet your security requirements for your federal workloads at scale ranging from classified and unclassified information systems.

A Policy Based Approach to Container Security & Compliance

At Anchore, we take a preventative, policy-based compliance approach, specific to organizational needs. Our philosophy of scanning and evaluating Docker images against user-defined policies as early as possible in the development lifecycle, greatly reduce vulnerable, non-compliant images from making their way into trusted container registries and production environments.

But what do we mean by ‘policy-based compliance’? And what are some of the best practices organizations can adopt to help achieve their own compliance needs? In this post, we will first define compliance and then cover a few steps development teams can take to help to bolster their container security.

An Example of Compliance

Before we define ‘policy-based compliance’, it helps to gain a solid understanding of what compliance means in the world of software development. Generally speaking, compliance is a set of standards for recommended security controls laid out by a particular agency or industry that an application must adhere to. An example of such an agency is the National Institute of Standards and Technology or NIST. NIST is a non-regulatory government agency that develops technology, metrics, and standards to drive innovation and economic competitiveness at U.S. based organizations in the science and technology industry. Companies that are providing products and services to the federal government oftentimes are required to meet the security mandates set by NIST. An example of one of these documents is NIST SP 800-218, the Secure Software Development Framework (SSDF) which specifics the security controls necessary to ensure a software development environment is secure and produces secure code.

What do we mean by ‘Policy-based’?

Now that we have a definition and example, we can begin to discuss the aspect role play in achieving compliance. In short, policy-based compliance means adhering to a set compliance requirements via customizable rules defined by a user. In some cases, security software tools will contain a policy engine that allows for development teams to create rules that correspond to a particular security concern addressed in a compliance publication.

Looking to learn more about how to utilizing a policy-based security posture to meet DoD compliance standards like cATO or CMMC? One of the most popular technology shortcuts is to utilize a DoD software factory. Anchore has been helping organizations and agencies put the Sec in DevSecOps by securing traditional software factories, transforming them into DoD software factories. Get caught up with the content below:

How can Organizations Achieve Compliance in Containerized Environments?

Here at Anchore, our focus is helping organizations secure their container environments by scanning and analyzing container images. Oftentimes, our customers come to us to help them achieve certain compliance requirements they have, and we can often point them to our policy engine. Anchore policies are user-defined checks that are evaluated against an analyzed image. A best practice for implementing these checks is through a step in CI/CD. By adding an Anchore image scanning step in a CI tool like Jenkins or Gitlab, development teams can create an added layer of governance to their build pipeline.

Complete Approach to Image Scanning

Vulnerability scanning

Adding image scanning against a list of CVEs to a build pipeline allows developers to be proactive about security as they will get a near-immediate feedback loop on potentially vulnerable images. Anchore image scanning will identify any known vulnerabilities in the container images, enforcing a shift-left paradigm in the development lifecycle. Once vulnerabilities have been identified, reports can be generated listing information about the CVEs and vulnerable packages within the images. In addition, Anchore can be configured to send webhooks to specified endpoints if new CVEs have published that impact an image that has been previously scanned. At Anchore, we’ve seen integrations with Slack or JIRA to alert teams or file tickets automatically when vulnerabilities are discovered.

Adding governance

Once an image has been analyzed and its content has been discovered, categorized, and processed, the resulting data can be evaluated against a user-defined set of rules to give a final pass or fail recommendation for the image. It is typically at this stage that security and DevOps teams want to add a layer of control to the images being scanned in order to make decisions on which images should be promoted into production environments.

Anchore policy bundles (structured as JSON documents) are the unit of policy definition and evaluation. A user may create multiple policy bundles, however, for evaluation, only one can be marked as ‘active’. The policy is expressed as a policy bundle, which is made up of a set of rules to perform an evaluation of an image. These rules can define a check against an image for things such as:

  • Security vulnerabilities
  • Package whitelists and blacklists
  • Configuration file contents
  • Presence of credentials in an image
  • Image manifest changes
  • Exposed ports

Anchore policies return a pass or fail decision result.

Putting it Together with Compliance

Given the variance of compliance needs across different enterprises, having a flexible and robust policy engine becomes a necessity for organizations needing to adhere to one or many sets of standards. In addition, managing and securing container images in CI/CD environments can be challenging without the proper workflow. However, with Anchore, development and security teams can harden their container security posture by adding an image scanning step to their CI, reporting back on CVEs, and fine-tuning policies meet compliance requirements. With compliance checks in place, only container images that meet the standards laid out a particular agency or industry will be allowed to make their way into production-ready environments.

Conclusion

Taking a policy-based compliance approach is a multi-team effort. Developers, testers, and security engineers should be in constant collaboration on policy creation, CI workflow, and notification/alert. With all of these aspects in-check, compliance can simply become part of application testing and overall quality and product development. Most importantly, it allows organizations to create and ship products with a much higher level of confidence knowing that the appropriate methods and tooling are in place to meet industry-specific compliance requirements.

Interested to see how the preeminent DoD Software Factory Platform used a policy-based approach to software supply chain security in order to achieve a cATO and allow any DoD programs that built on their platform to do the same? Read our case study or watch our on-demand webinar with Major Camdon Cady.

Install Anchore Enterprise on Amazon EKS with Helm

In this post I will walkthrough the installation of Anchore Enterprise 2.0 on Amazon EKS with Helm. Anchore currently maintains a Helm Chart which I will use to install the necessary Anchore components.

Prerequisites

  • A running Amazon EKS cluster with worker nodes launched. See EKS Documentation for more information.
  • Helm client and server installed and configured to your EKS cluster.

Note: We’ve written a blog post titled Introduction to Amazon EKS which details how to get started on the above prerequisites.

The prerequisites for getting up and running are the most difficult part of the installation in my opinion, the Anchore Helm chart makes the installation process straightforward.

Once you have a EKS cluster up and running and worker nodes launched, you can verify via the following command:

$ kubectl get nodes NAME STATUS ROLES AGE VERSION ip-10-0-1-66.us-east-2.compute.internal Ready <none> 1d v1.12.7 ip-10-0-3-15.us-east-2.compute.internal Ready <none> 1d v1.12.7 ip-10-0-3-157.us-east-2.compute.internal Ready <none> 1d v1.12.7

Anchore Helm Chart Configuration

To make proper configurations to the Helm chart, create a custom anchore_values.yaml file and utilize it when installing. There are many options for configuration with Anchore, for the purposes of this document, I will only change the minimum to get Anchore Enterprise installed. For reference, there is an anchore_values.yaml` file in this repository, that you may include in your installation.

Note – For this installation, I will be configuring ingress and using an ALB ingress controller. You can read more about Kubernetes Ingress with AWS ALB Ingress Controller.

Configurations

Ingress

I’ve added the following to my anchore_values.yaml file under the ingress section:

ingress: enabled: true # Use the following paths for GCE/ALB ingress controller apiPath: /v1/* uiPath: /* # apiPath: /v1/ # uiPath: / # Uncomment the following lines to bind on specific hostnames # apiHosts: # - anchore-api.example.com # uiHosts: # - anchore-ui.example.com annotations: kubernetes.io/ingress.class: alb alb.ingress.kubernetes.io/scheme: internet-facing

Anchore Engine API service

I’ve added the following to my anchore_values.yaml file under the Anchore API section:

# Pod configuration for the anchore engine api service. anchoreApi: replicaCount: 1 # Set extra environment variables. These will be set on all api containers. extraEnv: [] # - name: foo # value: bar # kubernetes service configuration for anchore external API service: type: NodePort port: 8228 annotations: {}

Note – Changed service type to NodePort.

Anchore Enterprise Global

I’ve added the following to my anchore_values.yaml file under the Anchore Enterprise global section:

anchoreEnterpriseGlobal: enabled: true

Note – Enabled enterprise components.

Anchore Enterprise UI

I’ve added the following to my anchore_values.yaml file under the Anchore Enterprise UI section:

anchoreEnterpriseUi: # kubernetes service configuration for anchore UI service: type: NodePort port: 80 annotations: {} sessionAffinity: ClientIP

Note – Changed service type to NodePort.

This should be all you need to change in the chart.

AWS EKS Configurations

Download the ALB Ingress manifest update cluster-name with EKS cluster name in alb-ingress-controller.yaml

wget https://raw.githubusercontent.com/kubernetes-sigs/aws-alb-ingress-controller/v1.0.1/docs/examples/alb-ingress-controller.yaml

Update cluster-name with the EKS cluster name in alb-ingress-controller.yaml

wget https://raw.githubusercontent.com/kubernetes-sigs/aws-alb-ingress-controller/v1.0.1/docs/examples/rbac-role.yaml

From the AWS console, create an IAM policy and manually update the EKS subnets for auto-discovery.

In the IAM console, create a policy using the contents of the template iam-policy.json. Attach the IAM policy to the EKS worker nodes role.

Add the following to tags to your clusters public subnets:

kubernetes.io/cluster/demo-eks-cluster : shared kubernetes.io/role/elb : '' kubernetes.io/role/internal-elb : ''

Deploy the rbac-role and alb ingress controller.

kubectl apply -f rbac-role.yaml

kubectl apply -f alb-ingress-controller.yaml

Deploy Anchore Enterprise

Enterprise services require an Anchore Enterprise license, as well as credentials with permission to the private docker repositories that contain the enterprise images.

Create a Kubernetes secret containing your license file.

kubectl create secret generic anchore-enterprise-license --from-file=license.yaml=<PATH/TO/LICENSE.YAML>

Create a Kubernetes secret containing Docker Hub credentials with access to the private anchore enterprise repositories.

kubectl create secret docker-registry anchore-enterprise-pullcreds --docker-server=docker.io --docker-username=<DOCKERHUB_USER> --docker-password=<DOCKERHUB_PASSWORD> --docker-email=<EMAIL_ADDRESS>

Run the following command to deploy Anchore Enterprise:

helm install --name anchore-enterprise stable/anchore-engine -f anchore_values.yaml

It will take the system several minutes to bootstrap. You can checks on the status of the pods by running kubectl get pods

MacBook-Pro-109:anchoreEks jvalance$ kubectl get pods NAME READY STATUS RESTARTS AGE anchore-cli-5f4d697985-hhw5b 1/1 Unknown 0 4h anchore-cli-5f4d697985-rdm9f 1/1 Running 0 14m anchore-enterprise-anchore-engine-analyzer-55f6dd766f-qxp9m 1/1 Running 0 9m anchore-enterprise-anchore-engine-api-bcd54c574-bx8sq 4/4 Running 0 9m anchore-enterprise-anchore-engine-catalog-ddd45985b-l5nfn 1/1 Running 0 9m anchore-enterprise-anchore-engine-enterprise-feeds-786b6cd9mw9l 1/1 Running 0 9m anchore-enterprise-anchore-engine-enterprise-ui-758f85c859t2kqt 1/1 Running 0 9m anchore-enterprise-anchore-engine-policy-846647f56b-5qk7f 1/1 Running 0 9m anchore-enterprise-anchore-engine-simplequeue-85fbd57559-c6lqq 1/1 Running 0 9m anchore-enterprise-anchore-feeds-db-668969c784-6f556 1/1 Running 0 9m anchore-enterprise-anchore-ui-redis-master-0 1/1 Running 0 9m anchore-enterprise-postgresql-86d56f7bf8-nx6mw 1/1 Running 0 9m

Run the following command for details on the deployed ingress resource:

MacBook-Pro-109:anchoreEks jvalance$ kubectl describe ingress Name: anchore-enterprise-anchore-engine Namespace: default Address: 6f5c87d8-default-anchoreen-d4c9-575215040.us-east-2.elb.amazonaws.com Default backend: default-http-backend:80 (<none>) Rules: Host Path Backends ---- ---- -------- * /v1/* anchore-enterprise-anchore-engine-api:8228 (<none>) /* anchore-enterprise-anchore-engine-enterprise-ui:80 (<none>) Annotations: alb.ingress.kubernetes.io/scheme: internet-facing kubernetes.io/ingress.class: alb Events: Type Reason Age From Message ---- ------ ---- ---- ------- Normal CREATE 18m alb-ingress-controller LoadBalancer 6f5c87d8-default-anchoreen-d4c9 created, ARN: arn:aws:elasticloadbalancing:us-east-2:472757763459:loadbalancer/app/6f5c87d8-default-anchoreen-d4c9/42defe8939465e2c Normal CREATE 18m alb-ingress-controller rule 2 created with conditions [{ Field: "path-pattern", Values: ["/*"] }] Normal CREATE 18m alb-ingress-controller rule 1 created with conditions [{ Field: "path-pattern", Values: ["/v1/*"] }]

I can see above that an ELB has been created and I can navigate to the specified address:

Anchore Enterprise login screen.

Once I login to the UI and begin to analyze images, I can see the following vulnerability and policy evaluation metrics displaying on the dashboard.

Anchore Enterprise platform dashboard.

Conclusion

You now have an installation of Anchore Enterprise up and running on Amazon EKS. The complete contents for the walkthrough are available by navigating to the GitHub repo here. For more info on Anchore Engine or Enterprise, you can join our community Slack channel, or request a technical demo.

Vulnerability Remediation Requirements for Internet-Accessible Systems

The Department of Homeland Security recently issued the Binding Operational Directive 19-02, “Vulnerability Remediation Requirements for Internet-Accessible Systems.” A binding operational directive is a compulsory direction to the federal, executive branch, and departments and agencies for purposes of safeguarding federal information and information systems. Federal agencies are required to comply with DHS-developed directives.

As the development and deployment of internet-accessible systems increases across federal agencies, it is imperative for these agencies to identify and remediate any known vulnerabilities currently impacting the systems they manage. The purpose of BOD 19-02 is to highlight the importance of security vulnerability identification and remediation requirements for internet-facing systems. Additionally, layout required actions for agencies when vulnerabilities are identified through Cyber Hygiene scanning. The Cybersecurity and Infrastructure Security Agency (CISA) leverages Cyber Hygiene scanning results to identify cross-government trends and persistent constraints, to help impacted agencies overcome technical and resource challenges that prevent the rapid remediation of security vulnerabilities. These Cyber Hygiene scans are in accordance with Office of Management and Budget (OMB) Memorandum 15-01: Fiscal Year 2014-2015 Guidance on Improving Federal Information Security and Privacy Management Practices, from which the NCCIC conducts vulnerability scans of agencies’ internet-accessible systems to identify vulnerabilities and configuration errors. The output from these scans can be known as Cyber Hygiene reports, which score any identified vulnerabilities with the Common Vulnerability scoring system or CVSS.

“To ensure effective and timely remediation of critical and high vulnerabilities identified through Cyber Hygiene scanning, federal agencies shall complete the following actions:”

Review and Remediate Critical and High Vulnerabilities

Review Cyber Hygiene reports issues by CISA and remediates any critical and high vulnerabilities detected on Internet-facing systems:

  • Critical vulnerabilities must be remediated within 15 calendar days of initial detection.
  • High vulnerabilities must be remediated within 30 calendar days of initial detection.

How Anchore Fits In

As federal agencies continue to transform their software development, it is necessary for them to incorporate proper security solutions purpose-built to identify and prevent vulnerabilities that are native to their evolving technology stack.

Anchore is a leading provider of container security and compliance enforcement solutions designed for open-source users and enterprises. Anchore provides vulnerability and policy management tools built to surface comprehensive container image package and data content, protect against security threats, and incorporate an actionable policy enforcement language capable of evolving as compliance needs change. Flexible and robust enough for the security and policy controls regulated industry verticals need to adopt cloud-native technologies in a DevSecOps environment.

One of the critical points of focus here is leveraging Anchore to identify known vulnerabilities in container images. Anchore accomplishes this by first performing a detailed analysis of the container image, identifying all known operating system packages and third-party libraries. Following this, Anchore will map any known vulnerabilities to the identified packages within the analyzed image.

Viewing Vulnerabilities in the UI

Anchore Enterprise customers can view identified vulnerabilities for analyzed images, by logging into the UI, and navigating to the image in question.

View identified vulnerabilities for analyzed images in Anchore platform.

In the above image, we can see that CVE-2019-3462 is of severity high, linked to the OS package apt-1.0.9.8.4, and there is a fix available in version 1.0.9.8.5. Also presented in the UI, is a link to where the CVE information comes from. Based on the requirements of BOD 19-02, this high-severity vulnerability will need to be remediated within 15 days of identification.

Note – A list of vulnerabilities can also be viewed using the Anchore CLI which can be configured to communicate with a running Anchore service.

Also, the dashboard view provides a higher-level presentation of the vulnerabilities impacting all images scanned with Anchore.

Anchore dashboard provides higher-level presentation of the vulnerabilities.

Viewing Vulnerabilities in the Build Phase

Anchore scanning can be integrated directly into the build phase of the software development lifecycle to identify security vulnerabilities, and potentially fail builds, to prevent vulnerable container images from making their way into production registries and environments. This point of integration is typically the fastest path to vulnerability identification and remediation for development teams.

Anchore provides a Jenkins plugin that will need to be configured to communicate with an existing Anchore installation. The Anchore Jenkins plugin surfaces security and policy evaluation reports directly in the Jenkins UI and as JSON artifacts.

Common vulnerabilities and exposures list in Jenkins.

Note – For more information on how custom Anchore policies can be created to fulfill specific compliance requirements, contact us, or navigate to our open-source policy hub for examples.

Registry Integration

For organizations not scanning images during the build phase, Anchore can be configured to integrate directly with any docker_v2 container registry to continuously scan the repositories or tags.

Ongoing Vulnerability Identification

It is not uncommon for vulnerabilities to be published days or weeks after an image has been scanned. To address this, Anchore can be configured to subscribe to vulnerability updates. For example, if a user is subscribed to the library/nginx:latest image tag and a new vulnerability is added which matches a package in the subscribed nginx image, Anchore can send out a Slack notification. This alerting functionality is especially critical for the BOD 19-02 directive as the remediation requirements are time-sensitive, and agencies should be alerted of new threats ASAP.

Conclusion

Anchore continues to provide solutions for the government, enterprises, and open-source users, built to support the adoption of container technologies. By understanding that containers are more than just CVEs and lists of packages, Anchore takes a container-native approach to image scanning and provides end-users with a complete suite of policy and compliance checks designed to support a variety of industry verticals from the U.S. Government and F100 enterprises to start-ups.

Create an Open Source Secure Container Based CI/CD Pipeline

Docker gives developers the ability to streamline packaging, storage, and deployment of applications at great scale. With increased use of container technologies across software development teams, securing these images become challenging. Due to the increased flexibility and agility, security checks for these images need to be woven into an automated pipeline and become part of the development lifecycle.

Common Tooling

Prior to any implementation, it is important to standardize on a common set of tools that will be critical components for addressing the above requirement. The four tools that will be discussed today are as follows:

Jenkins

Continuous integration tools like Jenkins will be driving the workload for any automated pipeline to run successfully. The three tools below will be used throughout an example development lifecycle.

Docker Registry

Docker images are stored and delivered through registries. Typically, only trusted and secure images should be accessible through Docker registries that developers can pull from.

Anchore

Anchore will scan images and create a list of packages, files, and artifacts. From this, Anchore has the ability to define and enforce custom policies and send the results of these back in the form of a pass or fail.

Notary

Notary is Docker’s platform to provide trusted delivery of images. It does this by signing images, distributing them to a registry, and ensuring that only trusted images can be distributed and utilized. Example CI build steps:

  1. Developer commits code to repository.
  2. Jenkins job begins to build a new Docker image bring in any code changes just made.
  3. Once the image completes it is scanned by Anchore and checked against user-defined policies.
  4. If the Anchore checks do not fail, the image gets signed by Notary and pushed to a Docker registry.

Anchore Policies

As mentioned above, Anchore is the key component to enforcing only secure images progress through the next stages in the build pipeline. In greater detail, Anchore will scan images and create a manifest of packages. From this manifest, there is the ability to run checks for image vulnerabilities. Additionally, the ability to periodically check if new vulnerabilities have been published that directly impact a package contained within a relevant image manifest. Anchore has the ability to be integrated with common CI tools (Jenkins), or in an ad hoc manner from a command line. From these integrations, policy checks can be enforced to potentially fail builds. Anchore checks will provide the most value through a proper CI model. Having the ability to split up acceptable base images and application layers is critical for appropriate policy check abstraction. Multiple Anchore gates specific to each of these image layers is fundamental to the overall success of Anchore policies. As an example, prior to trusted base image promotion and push into a registry, it will need to pass Anchore checks for Dockerfile best practices (USER, non ssh open), and operating system package vulnerability checks.

Secondary to the above, once a set of base images have been signed (Notary) and pushed into a trusted registry, it is now a requirement for all ‘application specific’ images to be created. It is the responsibility of whoever is building these images to make sure the appropriate base images are being used. Inheritance of a base layer will apply here, and only signed images from the trusted registry will be able to pass the next set of Anchore policy checks. These checks will not only focus on the signed and approved base layer images but depending on the application layer dependencies, will check for any NPM or Python packages that contain published vulnerabilities. Policies can be created that enforce Dockerfile and image best practices. As an example, Anchore allows the ability to look for a base image to be in existence via a regex check. These regular expressions can be used to enforce policies specific to image layers, files, etc.

While the above is just an example of how to implement, secure, and enforce images throughout its lifecycle, it is important to understand the differences between tools, and the separate functions each play. Without tools similar to Anchore, it is easy to see how insecure or untrusted images can make their way into registries and production environments. By leveraging gated checks with Anchore, not only do you have control around which images can be used, but teams can begin to adopt core functionality of the other tools outlined above in a more secure fashion.

Anchore & Slack, Container Security Notifications

With Anchore you can subscribe to TAGs and Images to receive notifications when images are updated, when CVEs are added or removed and when the policy status of an image changes so you can take a proactive approach to ensure security and compliance. Having the ability to stay on top the notifications above allows for the appropriate methods for remediation and triage to take place. One of the most common alerting tools Anchore users leverage is Slack.

How to Configure Slack Webhooks to Receive Anchore Notifications via Azure Functions

In this example, we will walk through how to configure Slack webhooks to receive Anchore notifications. We will consume the webhook with an Azure Function and pass the notification data into a Slack channel.

You will need the following:

Slack Configuration

Configure incoming webhooks to work with the Slack application you would like to send Anchore notifications to. The Slack documentation gives a very detailed walkthrough on how to set this up.

Should look similar to the configuration below (I am just posting to the #general channel):

Slack webhook setup for workspace.

Azure Initial Configuration

Once you have an Azure account, begin by creating a Function App. In this example I will use the following configuration:

Create function app for webhook test.

Choose In-Portal development environment and then Webhook + API:

Azure configuration for Javascript.

Once the function has been setup, navigate to the integrate tab and edit the configuration:

Azure integrate tab to edit configuration.

Finally, we will to select ‘Get function URL’ to retrieve the URL for the function we’ve just created. It should look similar to this format:

https://jv-test-anchore-webhook.azurewebsites.net/api/general/policy_eval/admin

Anchore Engine Configuration

If you have not setup Anchore Engine there are a couple of choices:

Once you have a running Anchore Engine, we need to configure engine to send out webhook notifications to the URL of our Function App in Azure.

Once the configuration is complete, you will need to activate a subscription, you can follow the documentation link above for more info on that.

In this example, I have subscribed to a particular tag and am listening for ‘policy_eval’ changes. From the documentation:

“This class of notification is triggered if a Tag to which a user has subscribed has a change in its policy evaluation status. The policy evaluation status of an image can be one of two states: Pass or Fail. If an image that was previously marked as Pass changes status to Fail or vice-versa then the policy update notification will be triggered.”

Azure Function Code

I kept this as minimal as possible in order to keep it open-ended. In short, Anchore will be sending out the notification data to the webhook endpoint we’ve specified, we just need to write some code to consume it, and then send it to Slack.

You can view the code here.

Quick note: In the example, the alert to Slack is very basic. However, feel free to experiment with the notification data that Anchore sends to Azure and configure the POST data to Slack.

Testing

In my example, I’m going to swap between two policy bundles and evaluate them against an image and tag I’ve subscribed to. The easiest way to accomplish this is via the CLI or the API.

The CLI command to activate a policy: anchore-cli policy activate <PolicyID> The CLI command to evaluate an image:tag against the newly activated policy: anchore-cli evaluate check docker.io/jvalance/sampledockerfiles:latest

This should trigger a notification give I’ve modified the policy bundles to create two different final actions. In my example, I’m toggling the exposed port 22 in the default bundle between ‘WARN’ and ‘STOP’

Once Anchore has finished evaluating the image against the newly activated policy, a notification should be created and sent out to our Azure Function App. Based on the logic we’ve written, we will handle the request, and send out a Slack notification to our Slack app that has been set up to receive incoming webhooks.

You should be able to view the notification in the Slack workspace and channel:

Slack notification tested successfully.

Anchore & Enforcing Alpine Linux Docker Images Vulnerability

A security vulnerability affecting the Official Alpine Docker Linux images (>=3.3) contain a NULL password for the root user. This particular vulnerability has been tracked as CVE-2019-5021. With over 10 million downloads, Alpine Linux is one of the most popular Linux distributions on Docker Hub. In this post, I will demonstrate an understanding of the issue by taking a closer look at two Alpine Docker images, configure Anchore Engine to identify the risk within the vulnerable image, and give a final output based on Anchore policy evaluation.

Finding the Issue

In the build of the Alpine Docker image (>=3.3) the /etc/shadow file show the root user password field entry without a password or lock specifier set. We can see this by running an older Alpine Docker image:

# docker run docker.io/alpine:3.4 cat /etc/shadow | head -n1 root:::0:::::

With no ! or password set, this will now be the condition we wish to check with Anchore.

To see this condition addressed with the latest version of Alpine, run the following command:

# docker run docker.io/alpine:latest cat /etc/shadow | head -n1 root:!::0:::::

Configuring Anchore Secret Search Analyzer

We will now set up Anchore to search for this particular pattern during image analysis, in order to properly identify the known issue.

Anchore comes with a number of patterns pre-installed that search for some types of secrets and keys, each with a named pattern that can be matched later in anchore policy definition. We can add a new pattern to the analyzer_config.yaml anchore engine configuration file, and start-up anchore with this configuration. The new analyzer_config.yaml, for example, should have a new pattern added, which we’ve named ‘ALPINE_NULL_ROOT’:

# Section in analyzer_config.yaml # Options for any analyzer module(s) that takes customizable input ... ... secret_search: match_params: - MAXFILESIZE=10000 - STOREONMATCH=n regexp_match: ... ... - "ALPINE_NULL_ROOT=^root:::0:::::$"

Note – By default, an installation of Anchore comes bundled with a default analzyer_config.yaml file. In order to address this particular issue, modifications will need to be made to the analzyer_config.yaml file as shown above. In order to make sure the configuration changes make their way into your installation of Anchore Engine, create an analyzer_config.yaml file and properly mount it into the Anchore Engine Analyzer Service.

Create an Anchore Policy Specific to this Issue

Next, I will create a policy bundle containing a policy rule which explicitly look for any matches found of the above ALPINE_NULL_ROOT regex create above. If any matches are found, the Anchore policy evaluation will fail.

# Anchore ALPINE_NULL ROOT Policy Bundle { "blacklisted_images": [], "comment": "Default bundle", "id": "alpinenull", "mappings": } ], "name": "Default bundle", "policies": , "trigger": "content_regex_checks" } ], "version": "1_0" } ], "version": "1_0", "whitelisted_images": [], "whitelists": , "name": "Global Whitelist", "version": "1_0" } ] }

Note: The above is an entire policy bundle component which will be needed to effectively evaluate against any analyzed images. The key section within this is the policies section, where we are using the secret_scans gate with content_regex_name and ALPINE_NULL_ROOT parameters.

Conduct Policy Evaluation

Once this policy has been added and activated to an existing Anchore Engine deployment, we can conduct an analysis and policy evaluation of the vulnerable Alpine Docker image (v3.4) via the following command:

# anchore-cli evaluate check docker.io/library/alpine:3.4 --detail Image Digest: sha256:0325f4ff0aa8c89a27d1dbe10b29a71a8d4c1a42719a4170e0552a312e22fe88 Full Tag: docker.io/library/alpine:3.4 Image ID: b7c5ffe56db790f91296bcebc5158280933712ee2fc8e6dc7d6c96dbb1632431 Status: fail Last Eval: 2019-05-09T05:02:32Z Policy ID: alpinenull Final Action: stop Final Action Reason: policy_evaluation Gate Trigger Detail Status secret_scans content_regex_checks Secret search analyzer found regexp match in container: file=/etc/shadow regexp=ALPINE_NULL_ROOT=^root:::0:::::$ stop

In the above output, we can explicitly see that the secret search analyzer found a regular expression match in the Alpine 3.4 Docker image we’ve analyzed and we’ve associated a stop action with this policy rule definition, and the overall result of the policy evaluation has failed.

Given that Alpine is one of the most widely used Docker images, and the impacted versions of it are particularly recent, it is recommended to update to a new version of the image that is not impacted or modify the image to disable the root account.

How Tremolo Security Deploys Anchore on Openshift

When you see a breach in the headlines, it usually reads something like “Known vulnerability exploited to…”Whatever was stolen or broken was compromised because of a bug that had been discovered and fixed by the developers, but not patched in production. Patching is hard.

It’s much harder than most security professionals are willing to admit. It’s not hard because running an upgrade script is hard, patching is hard because without a comprehensive testing suite you never know if an update is going to break your application or systems.

At Tremolo Security, we have already blogged about how we approach patching our dependencies in Unison and OpenUnison. With our release of Orchestra to automate security and compliance in Kubernetes in the past few weeks, we wanted to apply the same approach to our containers. We turned to Anchore’s open source Anchore Engine to scan the containers we publish and make sure they’re kept up to date. In this post we’re going to talk about our use case, why we chose to use Anchore and how we deployed Anchore to scan and update our containers.

Publishing Patched Containers

Our use case for container scanning is a bit different then most. In a typical enterprise you want to have a secure registry with containers that are continuously scanned for known vulnerabilities and compliance with policies. For Tremolo Security, we wanted to make sure that the containers we publish are already patched and kept updated continuously. We work very hard to create an easily patched solution and we want to make sure our customers can feel confident that the containers they obtain from us have been kept up to date.

When we first started publishing containers, we relied on Dockerhub’s automatic builds to publish our containers whenever one of the base images (CentOS or Ubuntu) were updated. This wasn’t good enough for us. The base containers were usually patched once per month, but that was too slow for us. We’d have customers come to us and say “we scanned your containers and there are patches available.” We wanted to make sure that as patches became available they were immediately integrated into our containers.

Why We Chose Anchore

We were first introduced to Anchore a few years ago when they were guests on TWIT.tv’s FLOSS Weekly, a podcast about free and open source software. We had submitted our container for a scan by both Anchore’s service and a well-known provider’s service and received very different results. We tweeted our question to Anchore and they responded with a great blog post explaining how they take into account Red Hat’s updates to CVEs in CentOS for far better and more accurate scan results. That deep level of understanding made it clear to us this was a partner we wanted to work with.

Deploying Anchore

Now for the fun part, we wanted to deploy Anchore’s open source engine on our own infrastructure. We use OKD for various functions at Tremolo Security, including our CI/CD pipeline and publishing. OKD out of the box is far more restrictive than most Kubernetes distributions. It doesn’t allow for privileged containers by default and its use of selinux is very powerful but can be very limiting on containers that are not built to run unrestricted. Finally, OKD doesn’t rely on Helm or Tiller but Anchore does.

Helm and Tiller

I don’t like to deploy anything in my cluster that has cluster-admin access unless I know and am in control of how and when its used. Helm and Tiller have never given me these warm-and-fuzzies and so we don’t use it. That said we needed it for deploying Anchore so we decided to deploy it into Anchore’s project (namespace). When we deployed tiller, we give it a service account that only had administrator access in the Anchore project. As soon as we had Anchore working, we immediately destroyed the Helm and Tiller deployments.

Writing Ephemeral Data

The first issue we ran into was that the containers that makeup Anchore’s engine write ephemeral data into their containers. Most k8s distros will let you do this based on file system permissions, but not OKD. When you need to write ephemeral data you need to update your pods to use empty volumes. We went through each of the deployments in the Helm charts to add them:

- name: service-config-volume mountPath: /anchore_service_config - name: logs mountPath: /var/log/anchore - name: run mountPath: /var/run - name: scratch mountPath: /scratch

and

- name: service-config-volume emptyDir: {} - name: logs emptyDir: {} - name: run emptyDir: {} - name: scratch emptyDir: {}

Unprivileged Containers

Next issue we ran into was that the analyzer needed root access. The other containers thankfully do not. We created a service account and added it to the privileged scc in OKD. SCCs serve the same role in OKD that pod security policies are now serving upstream Kubernetes clusters.

Deleting Helm

Once Anchore was running, did I mention we deleted Helm?

Scanning and Updating Containers

Once Anchore was running, we needed to add our containers and then make sure they were updated appropriately. While the anchore-cli works great for one-off commands, it wasn’t going to scale for us. We publish variants for nearly a dozen containers for Ubuntu, CentOS and RHEL so the cli just wasn’t going to work. The great thing is though that Anchore is cloud-native and the cli just uses an API!

We decided to create a poor man’s operator. An operator is a pattern in the cloud-native world that says “Take all the repetitive stuff admins do and automate it.” For instance, the operators we’re building for OpenUnison and MyVirtualDirectroy will automate certificate management and trusts. Typically operators revolve around a custom resource definition (CRD) and when an instance of a CRD is updated the operator makes sure the environment is brought into line with the configuration of the custom resource. We call this a poor man’s operator because instead of watching a custom resource, we decided to create a CronJob that would run through the containers listed in a CR and if updates are available to call a webhook to being rebuilding.

The great thing about this approach was we could just add new containers to our CR and it would just add them to Anchore’s scans! No fuss, no muss! We’re all open source friends here so we published our code – https://github.com/TremoloSecurity/anchore-os-image-scan.

Closing The Loop

Anchore’s given Tremolo Security a great platform for keeping our containers patched. Knowing when we walk into a customer that they’re scans will give the best possible results is a competitive differentiator for us. We have enjoyed working with Anchore for the last few years and look forward to working with them for many more to come!

Anchore 2.0 is Now Built on the Red Hat Universal Base Image

Earlier this week Red Hat announced an exciting new offering for developers, technology partners, and users: the Red Hat Universal Base Image (UBI). Anchore is excited to announce that as of Anchore Enterprise 2.0 (including the OSS Anchore Engine), core Anchore container images will now be based on the Red Hat UBI.

As an organization that develops software that is primarily distributed to end-users as a collection of container images, we have derived great value and agility through the isolation and encapsulation that comes with developing on, building, testing, and distributing software using containers.

The Anchore services themselves are applications that utilize underlying libraries, dependencies and utilities that are typically provided by most Linux OS distributions, and as such our container images have historically been based on either CentOS or Ubuntu base images.

It is a testament to the effectiveness of container isolation that even though Anchore has changed which OS base image we’ve used, the user experience of running/upgrading Anchore across these changes has remained largely unchanged. However, there have been users who have asked for more from the underlying OS that Anchore services are built upon – specifically the ability to match the supported container and underlying OS infrastructure, and access to support options from the OS vendor for container-based service deployments. Up until now, we have not been able to provide crystal clear recommendations around these topics to our users.

“Red Hat is pleased to welcome Anchore as one of the first partners to adopt the Universal Base Image” said Lars Herrmann, senior director, Ecosystem Program, Red Hat. “We believe the availability of more freely redistributable, well-curated base images can simplify the development process for our partners and enhance the support experience of our mutual customers.”

The Red Hat Universal Base Image is derived directly from Red Hat Enterprise Linux, and is freely available and redistributable, enabling technology partners and application developers such as ourselves to build and distribute our container-based applications, all based on a familiar and trusted Red Hat based OS.

As an application developer, the availability of the UBI short-circuits complications that can arise from users and customers of ours, who are asking for OS-level support for our application, and many other use cases where a supported container OS environment is required (in particular, within large enterprises and regulated industries). In addition, UBI has made the Red Hat OSS software ecosystem fully accessible, when it comes to delivering end-to-end (from development, through build, to distribution) container-based software. Anchore users can now utilize familiarity with Red Hat software for system diagnosis/deep inspection within the Anchore containers (based on UBI), and most importantly can now “turn on” official Red Hat support for any base OS concerns when running on Red Hat Enterprise Linux or Red Hat OpenShift, in addition to the specialized support available from Anchore for our own services.

We’re excited to be an early adopter of the UBI offering from Red Hat, and believe that moving to UBI as our base container image clearly and immediately improves the options available to ourselves (as application developers) and to all users of Anchore, across the board.

For more information on the Anchore Enterprise 2.0 launch, as well as the Red Hat Universal Base Image announcements and material, please refer to the following links.

Learn More About the Red Hat Universal Base Image

Learn More About Anchore Enterprise 2.0

Announcing Anchore Enterprise Version 2.0

We’re truly excited today to announce the immediate availability of Anchore Enterprise version 2.0, the latest OSS and Enterprise software from Anchore that provides users with the tools and techniques needed to enforce container security, compliance and best-practices requirements with usable, flexible, cross-organization, and above all time-saving technology from Anchore. This release is based on the all-new (and also available today) OSS Anchore Engine version 0.4.0).

New Features of Enterprise 2.0

Building on top of the existing Anchore Enterprise 1,2 release, Anchore Enterprise version 2.0 adds major new features and architectural updates that collectively represent the technical expression of discussions, experiences, and feedback from customers and users of Anchore over the last several years. As we continue to gain in-depth insight into the challenges that Dev/Ops and Sec/Ops groups face, we’re observing container-based deployments becoming more of the norm rather than the exception (for production workloads).

As a consequence, the size, responsiveness, information retrieval and reporting breadth, and operational needs demanded of Anchore in its role as an essential piece of policy-based security and compliance infrastructure have grown in kind.

The overarching purpose of the new features and design of the 2.0 version of Anchore Enterprise is to directly address the challenges of continued growth and scale by extending the enterprise integration capabilities of Anchore, establishing an architecture that grows alongside our users’ demanding throughput and scale requirements, and offering even more insight into users’ container image environments through rich new APIs and reporting capabilities, all in addition to the rich set of enforcement capabilities included with Anchore Enterprise’s flexible policy engine.

The major new features and resources launched as part of Anchore Enterprise 2.0 include:

  • GUI Dashboard: new configurable landing page for users of the Enterprise UI, presenting complex information summaries and metrics time series for deep insight into the collective status of your container image environment.
  • Enterprise Reporting Service: entirely new service that runs alongside existing Anchore Enterprise services that exposes the full corpus of container image information available to Anchore Engine via a flexible GraphQL interface
  • LDAP Integration: Anchore Enterprise can now be configured to integrate with your organization’s LDAP/AD identity management system, with flexible mappings of LDAP information to Anchore Enterprise’s RBAC account and user subsystem.
  • Red Hat Universal Base Image: all Anchore Enterprise container images have been re-platformed atop the recently announced Red Hat Universal Base Image, bringing more enterprise-grade software and support options to users deploying Anchore Enterprise in Red Hat environments.
  • Anchore Engine 0.4.0: Anchore Enterprise is built on top of the OSS Anchore Engine, which has received many new features and updates as well (see below for details).
  • New Documentation and Resources: Alongside the release of Anchore Engine 0.4.0, we’ve launched a brand new documentation site that provides a more flexible structure, versioned documentation sets, and greatly enhanced feedback and contribution capabilities.
  • New Support Portal: customers of Anchore Enterprise 2.0 are now provided with full access to a new support portal for better ticket tracking and feature request submissions.

Anchore Engine OSS

Anchore Enterprise 2.0 is built on top of Anchore Engine version 0.4.0 – a new version of the fully functional core services that drive all Anchore deployments. Anchore Engine has received a number of new features and other new project updates:

  • Automated Data Management: new automation capabilities and rules allow simplified management of the volume of analysis data while still supporting audit capabilities. New data tiers support flexible management of Anchore data resources as your deployment grows and scales over time.
  • Policy Hub: centralized repository of Anchore policies, accessible by all Anchore users, where pre-canned policies are available either to be used directly or as a starting point for your own policy definitions.
  • Rootless Analyzers: new implementation of the core image analysis capabilities of Anchore which no longer require any special access to handle the high variability found within container images, while still providing the deep inspection needed for powerful security and compliance enforcement.
  • Red Hat Universal Base Image: all Anchore Engine container images have been re-platformed atop the recently announced and freely available Red Hat Universal Base Image, bringing more enterprise-grade software and support options to users deploying Anchore Engine in Red Hat environments.

For a full description of new features, improvements and fixes available in Anchore Engine OSS, click here.

Once again, we would like to sincerely thank all of our open-source users, customers and contributors for all of the spirited discussion, feedback, and code contributions that are all part of this latest release of Anchore Engine OSS! If you’re new to Anchore, we would like nothing more than to have you join our community!

Anchore Enterprise 2.0 Available Now

With Anchore Enterprise 2.0, available immediately, our goal has been to include a brand new set of large scale and enterprise-focused updates for all Anchore users that can be utilized immediately by upgrading existing deployments of Anchore Enterprise or Anchore Engine OSS.

For users looking for comprehensive solutions to the unique challenges of securing and enforcing best-practices and compliance to existing CI/CD, container monitoring and control frameworks, and other container-native pipelines, we sincerely hope you enjoy our latest release of Anchore software and other resources – we look forward to working with you!

For more information on requesting a trial, or getting started with Anchore Enterprise 2.0, please direct your browser to the Anchore Enterprise.

Use Anchore Policies to Reach CIS Docker Benchmark

As Docker usage has greatly increased, it has become increasingly important to gain a better understanding of how to securely configure and deploy Dockerized applications. The Center for Internet Security published 1.13 Docker Benchmark, which provides consensus-based guidance by subject matter experts for users and organizations to achieve secure Docker usage and configuration.

We previously published a blog on how Anchore can help achieve NIST 800-190 compliance. This post will detail how Anchore can help with certain sections of CIS Docker Benchmarks 1.13. The publication focuses on five areas that are specific to Docker:

  • Host Configuration
  • Docker daemon configuration
  • Docker daemon configuration files
  • Container Images and Build File
  • Container Runtime

Anchore is a service that analyzes Docker images pre-runtime and applies user-defined acceptance policies to allow automated container image validation and certification. Anchore is more commonly used with a CI tool similar to Jenkins in order to streamline container image builds in a more automated fashion. The critical component in helping achieve any sort of compliance are Anchore Policy Bundles. With these, users have full control over what specific policy rules they would like their Docker images to adhere to, and potentially fail or warn users based on the outcome of these evaluations.

Scoring Information

A scoring status indicated whether compliance with the given recommendations impacts the assessed target’s benchmark score.

Scored

Failure to comply with “Scored” recommendations will decrease the final benchmark score. Compliance with “Scored” recommendations will increase the final benchmark score.

Not Scored

Failure to comply with “Not Scored: recommendations will not decrease the final benchmark score. Compliance with “Not Scored” will not increase the final benchmark score.

Profile Definitions

The following configuration profiles are defined by this Benchmark:

Level 1 – Docker

Items in this profile intend to:

  • Be practical and prudent
  • Provide a clear security benefit
  • Not inhibit the utility of the technology beyond acceptable means

Level 2 – Docker

Items in this profile exhibit one or more of the following characteristics:

  • Are intended for environments or use cases where security is paramount
  • Acts as defense in depth measure
  • May negatively inhibit the utility or performance of the technology

1. Host Configuration

Security tools specific to the Host Configuration are not achievable with Anchore.

2. Docker Daemon Configuration

Security tools specific to the Docker daemon are not achievable with Anchore.

3. Docker Daemon Configuration Files

Security tools specific to the Docker daemon configuration are not achievable with Anchore.

4. Container Images and Build files

Docker container images and their corresponding Dockerfiles govern how a container will behave when running. It is important to use the appropriate base images, and best practices when creating Dockerfiles to secure your containerized applications and infrastructure.

4.1 Create a user for the container (Scored)

Create a non-root user for the container in the Dockerfile for the container image. It generally good practice to run a Docker container as a non-root user.

When creating Dockerfiles make sure the USER instruction exists. This can be achieved with an Anchore policy by checking for the USER instruction, as well as checking to make sure the effective user is not the root.

4.2 Use trusted base images for containers (Not Scored)

Ensure that container images come from trusted sources. Official repositories are Docker images curated and optimized by the Docker community or vendor. As an organizational best practice, setting up a trusted Docker registry where your developers are allowed to push and pull images from is seen as secure. Configuration and use of Docker Content trust with Notary is helpful when achieving this.

Anchore helps with this when built-in with a secure CI pipeline. As an example, once an image has been built, it is then scanned and analyzed by Anchore, if it passes Anchore policies it is now safe to be pushed to a designated trusted Docker registry. If the image does not pass Anchore checks, it does not get pushed to a registry. Anchore policies can be set up to make sure base images are coming from trusted registries as well.

4.3 Do not install unnecessary packages in the container (Not Scored)

It is generally a best practice to not install anything outside of the usage scope of the container. By bringing additional software packages that are not utilized, the attack surface of the container is increased.

Anchore policies get be set to look for only a setlist of software packages, or look for a slimmed-down version of the base image by checking the FROM instruction. By using minimal base images or alpine, not only is the size of the image greatly decreased, the threat surface area of the container is decreased.

4.4 Scan and rebuild the images to include security patches (Not Scored)

Images should be scanned frequently. If vulnerabilities are discovered within images, they should be patched/fixed, rebuilt, and pushed to the registry for instantiation.

Anchore scans can be conducted as part of a normal CI pipeline, doing this ensures the frequency of scans is in-line with image builds. Anchore vulnerability feeds are consistently being updated with newer vulnerabilities as they are made available to the public. By watching image repositories and tags within Anchore, webhook notifications can be configured to alert the appropriate teams when new vulnerabilities are impactful to a watched image or tag.

Anchore policy checks during the CI pipeline can be set up to stop container images with vulnerable software packages from ever reaching a trusted registry.

4.5 Enable Content trust for Docker (Scored)

Enable content trust for Docker and use digital signatures with a tool like Notary to ensure that only trusted Docker images can be pushed to a registry.

While this is not directly enforceable by Anchore, setting up Anchore policy checks within a CI pipeline to only sign images that have passed an evaluation is part of a secure CI best practice.

4.6 Add HEALTHCHECK instruction to the container image (Scored)

Add the HEALTHCHECK instruction within your Dockerfiles. This ensures the engine will periodically check the running container against that instruction. Based on the output of the healthcheck, Docker could exit a non-working container and instantiate a new one.

Anchore policy checks can be configured to ensure the HEALTHCHECK instruction is present within a Dockerfile.

4.7 Do not use update instructions alone in the Dockerfile (Not Scored)

Make sure to not use update instruction alone or in a single line within a Dockerfile. Doing this will cache the update layer, and potentially could deny a fresh update when the Docker image is built again.

Anchore policy checks can be configured to look for regular expressions specific to an update instruction alone or in a single line. Following this, a warning notification could be sent out.

4.8 Remove setuid and setgid permissions in the images (Not Scored)

Remove setuid and setgid permission in the images to prevent escalation attacks in the containers.

Anchore policy checks can be set to only allow setuid and setgid permission on executables that need them. These permissions could be removed during build time by explicitly stating the following in the Dockerfile:

RUN find / -perm +6000 -type f -exec chmod a-s {} ; || true

4.9 Use COPY instead of ADD in Dockerfile (Not Scored)

Use the COPY instruction instead of the ADD instruction in Dockerfiles.

Anchore policy checks can be setup to warn when ADD instruction in the present in a Dockerfile.

4.10 Do not store secrets in Dockerfiles (Not Scored)

Do not store secrets in Dockerfiles.

Anchore policy checks can be configured to look for secrets (AWS keys, API keys, or other regular expressions) that may be present within an image.

4.11 Install verified packages only (Not Scored)

Verify the authenticity of packages before installing them in the image.

Since Anchore can inspect the Dockerfile, policy checks can be configured to only allow allowed packages to be installed during a Docker build.

5. Container Runtime

Although Anchore focuses on mainly pre-runtime, there are countermeasures that can be taken during the build stage prior to instantiation to help mitigate container runtime threats.

5.6 Do not run ssh within containers (Scored)

SSH server should not be running within the container.

Anchore policies can be configured to check for exposed port 22.

5.7 Do not map privileged ports within containers (Scored)

The TCP/IP port number below 1024 are considered privileged ports. Normal users and processes are not allowed to use them for various security reasons.

Anchore policies can be configured to check for these exposed ports.

5.8 Only open needed ports on container (Scored)

Dockerfile for container images should only define needed ports for container usage.

Anchore policies can be configured to check that the needed exposed ports are open.

Conclusion

The above findings outline which sections of the CIS Docker Benchmark can achieve with Anchore and Anchore policies. It is highly recommended that other tools be used in combination to achieve and secure CI image pipeline in order to accomplish a more complete CIS Docker Benchmark score.

One of the easiest ways to get started with achieving the Docker CIS Benchmark is to use the Anchore Policy Bundle below:

Anchore Policy for Docker CIS

Get started with the Anchore Policy for Docker CIS Benchmark on the Anchore Policy Hub.

Testing Anchore with Ansible, K3s and Vagrant

When I began here at Anchore, I realized I would need to create a quick and offline way to be able to test installation in a way that would better approximate the most common way it is deployed—on Kubernetes.

We have guides to stand up anchore with docker-compose, and how to launch into Amazon EKS, but we didn’t have a quick way to test our helm chart, and other aspects of our application, locally on a laptop in a way that used K3s instead of minikube.

I also wanted to stand up a quick approximation not just on my local laptop, but against various other projects I have. So I created a K3s project base that automatically deploys K3s in vagrant and VirtualBox locally on my laptop. Also, if I need to stand up a Kubernetes cluster on external hosts to my laptop, I can run the playbook against those hosts to stand up a K3s cluster and deploy the anchore engine helm chart.

To get started, you can check out my project page on Github. It’s not a feature-complete project yet, but pull requests are always welcome.

Scenario 1: Standing this Up on your Local Laptop

Step 1: Install dependencies

To use this, just make sure you’ve met the requirements for your laptop, which is to say: make sure you have Ansible, Vagrant and VirtualBox installed. Clone the repo, change directories into that repo and issue the command “vagrant up”. There are more details on the readme file to help get you started.

First, you’ll need to be running a Linux or macOS laptop and have the following things installed:

First, install Virtualbox per the link instructions above. Once that is in place, install Ansible and Vagrant per the links above also. To install the Vagrant VirtualBox Guest Additions Plugin, you issue the following command:vagrant plugin install vagrant-vbguest

We are now ready to clone the repository and get this running. The following three commands will pull the repository and stand up the K3s cluster: git clone https://github.com/dfederlein/k3s_project_base.git cd k3s_project_base vagrant up

Scenario 2: Run this Playbook Against Hosts External to your Laptop 

In this scenario, you have ansible installed on a control host, and you will be building a k3s cluster of hosts you already control. I will assume this scenario is utilized by people already familiar with Ansible and give some shortcut notes.

First, clone the repository with the following command: git clone https://github.com/dfederlein/k3s_project_base.git

Next, we’ll modify the hosts.ini file to reflect the hosts you want to create this cluster on. Once you’ve added those, the following command should get you what you need: ansible-playbook -i hosts.ini site.yml -u (user)

Add the become password and connection password or private key flags to that command as needed. More information on how to do that in the Ansible documentation.

The end of the processes detailed above should have a working K3s cluster running on your laptop, or on the external hosts you’ve pointed the playbook at, and a helm chart of anchore deployed to that cluster. Please note that the Vagrant/local deploy scenario may need some patience after being created, as it will operate with limited ram and resources.

What is the Difference Between Anchore and Clair?

As a customer-facing Solutions Architect at Anchore, I have daily conversations with prospects and existing customers about the challenges they face with their container image workloads. During this discovery stage, I often hear a mix of security and DevOps tools used to automate, orchestrate, secure, and release through the lifecycle of containers. One of the tools I hear of quite frequently is CoreOS Clair. Since Anchore and Clair share some of the same characteristics and use cases, I wanted to write up a quick summary of the two tools and point out the similarities and differences.

Clair

Clair is an open source project for static analysis of vulnerabilities in container images. Clair collects vulnerability data at intervals and stores them in the database, scrubs container images and indexes the installed software packages. If any vulnerabilities are matched to identified software packages in the images, Clair can send out alerts, reports, or block deployments to production environments. For users looking for this specific functionality, Clair is a perfect solution. Additionally, for Quay.io users, Clair security scanning comes baked in.

At Anchore, we love Clair and it’s capabilities, and certainly agree that security, particularly static analysis of container images, is a critical component to a more mature security posture. Container images are a new artifact, and it is not always known what is inside of them. In addition, developers rather than operations teams are often responsible for creating these container images. Due to the variety in containers the problem of vetting artifacts on the way to production environments is more critical than ever.

How Anchore Can Help

Many of our new users and customers come from Clair, and most often it is due to a key principle we center on at Anchore: A heavily customizable policy enforcement engine that can evolve over time as needs change.

Our most successful open source users and enterprise customers have highlighted the above as a hard requirement for their continued success with a container security tool. Often our customers have specific compliance requirements they need to fulfill. These requirements could be detailed in documents like CIS Docker Benchmark or NIST 800-190. Or they could have internal security and policy requirements they need to adhere to. Whatever the case is, the top two responses we get when asking for an ideal solution is typically:

  • I’m looking for more than just a list of CVEs
  • I’m looking to build customizable policy rules to meet specific compliance needs.

Anchore addresses these issues by providing comprehensive coverage of container image contents that extend beyond vulnerability scanning. This includes secrets scanning, misconfigurations, and compliance best practices. In addition to the identification of operating systems and language packages, such as Node, Ruby, Java, and Python, Anchore provides the user with actionable results from a policy engine that can be used to block CI builds, generate reports, or alert via webhook notifications. When it comes to particular industries such as Government, Healthcare, and Financial services, compliance is high on the priority list. Typically, these verticals will have strict policy checks they need enforced and critical software solutions that need certification. To accomplish this, leveraging container-native security tools that provide a complete suite of checks out of the box, becomes a requirement.

While Anchore Engine provides key functionality for many users, we wanted to extend its core functionality to address prospects asking for more enterprise features. Anchore’s Enterprise offering fulfills the specific needs of these users by providing a GUI client, RBAC, on-premise data feed aggregation service, high-quality vulnerability data from proprietary sources, enhanced reporting, and full enterprise-grade support.

Conclusion

It is clear that the importance of static analysis of container images, in particular identifying known vulnerabilities in software packages, is well known at both Anchore and CoreOS Clair. As a potential user or customer deciding on a container security tool, I recommend uncovering some key bullet points you’d like to see in an ideal solution and aligning those points with core principles and problems certain vendors solve.

Get started with the open source Anchore Engine.

Envoy Vulnerabilities and their Impact on Istio

In this post, I wanted to take a closer look at two recent vulnerabilities impacting Envoy Proxy versions 1.9.0 and older (CVE 2019-9900 and CVE 2019-9901). Since these two particular CVEs have been identified, they have also been patched in Envoy version 1.9.1. Before diving into the specifics of the vulnerabilities and their impact, I wanted to give some general background on Envoy and Istio.

What is Envoy?

Envoy Proxy is a modern, high-performance, small-footprint edge and service proxy. Envoy is most comparable to software load balancers such as NGINX and HAProxy. Originally written and deployed at Lyft, Envoy is now an official graduated project of the Cloud Native Computing Foundation.

For more information on Envoy and a real-world example of its usage in practice, I recommend watching this video: The Mechanics of Deploying Envoy at Lyft.

What is Istio?

Istio is an open source service mesh that layers transparently onto existing distributed applications. It is also a platform, including APIs that let it integrate into any logging platform, or telemetry or policy system. Istio lets you successfully, and efficiently, run a distributed microservice architecture, and provides a uniform way to secure, connect, and monitor microservices.

For a clear example on Istio, I recommend watching this video: What is Istio?

What is a Service Mesh?

The term service mesh is used to describe the network of microservices that make up such applications and the interactions between them. As a service mesh grows in size and complexity, it can become harder to understand and manage. Its requirements can include discovery, load balancing, failure recovery, metrics, and monitoring. A service mesh also often has more complex operational requirements, like A/B testing, canary rollouts, rate limiting, access control, and end-to-end authentication.

If you are interested in further learning on the concepts of a service mesh and the challenges it is intended to solve, I recommend reading the following post by Hashicorp: What is a Service Mesh?

Istio provides behavioral insights and operational control over the service mesh as a whole, offering a complete solution to satisfy the diverse requirements of microservice applications.

An Istio service mesh is logically split into a data plane and a control plane.

  • The data plane is composed of a set of intelligent proxies Envoy deployed as sidecars. These proxies mediate and control all network communication between microservices along with Mixer, a general-purpose policy and telemetry hub.
  • The control plane manages and configures the proxies to route traffic. Additionally, the control plane configures Mixers to enforce policies and collect telemetry.

alt text

Istio and Envoy

Istio uses an extended version of the Envoy proxy. Envoy is deployed as a sidecar to the relevant service in the same Kubernetes pod. This deployment allows Istio to extract a wealth of signals about traffic behavior as attributes. Istio can, in turn, use these attributes in Mixer to enforce policy decisions, and send them to monitoring systems to provide information about the behavior of the entire mesh.

CVE-2019-9900

Envoy expects that its HTTP codecs enforce RFC constraints on valid header values. In particular, it is expected that there are no embedded NUL characters in paths, header values or keys.

When parsing HTTP/1.x header values, Envoy 1.9.0 and before does not reject embedded zero characters (NUL, ASCII 0x0). This allows remote attackers crafting header values containing embedded NUL characters to potentially bypass header matching rules, gaining access to unauthorized resources.

Based on current information, this only affects HTTP/1.1 traffic. If this is not structurally possible in your network or configuration, then it is unlikely that this vulnerability applies.

View the CVE GitHub Issue.

CVE-2019-9901

Envoy does not normalize HTTP URL paths in Envoy 1.9 and before. A remote attacker may craft a path with a relative path, e.g. something/../admin, to bypass access control, e.g. a block on /admin. A backend server could then interpret the unnormalized path and provide an attacker access beyond the scope provided for by the access control policy.

View the CVE GitHub Issue.

An attacker could bypass access control and could also circumvent DoS prevention system such as rate limiting and authorization for a given backend server.

Remediation

As mentioned in the introduction, these two vulnerabilities have been patched in Envoy version 1.9.1, and correspondingly in the Envoy builds embedded in Istio 1.1.2 and Istio 1.0.7. they recommend steps for remediation are as follows:

  • For Istio 1.1.x deployments: update to a minimum of Istio 1.1.2
  • For Istio 1.0.x deployments: update to a minimum of Istio 1.0.7

Getting Started with Helm, Kubernetes and Anchore

We see a lot of people asking about standing up Anchore for local testing on their laptop and in the past, we’ve detailed how to use Docker to do so. Lately, I have been frequently asked if there’s a way to test and learn with Anchore on a laptop using the same or similar deployment methods as what would be used in a larger deployment.

Anchore installation is preferably done via a Helm chart. We can mirror this on a laptop using MiniKube, as opposed to the instructions to use docker-compose to install Anchore. MiniKube is a small testing instance of Kubernetes you can install on your laptop, whether you use Windows, Linux or macOS. Instructions on installing the initial MiniKube virtual machine are here.

Prerequisites are different for your platform so read closely. On macOS You need only install VirtualBox, Homebrew, and issue the following command:

brew cask install minikube kubernetes-cli

Once the installation is complete, you can start your minikube instance with the following command:

minikube start

Once minikube has started, we can grab helm from the Kubernetes GitHub repository:

curl https://raw.githubusercontent.com/kubernetes/helm/master/scripts/get > get_helm.sh
chmod 700 get_helm.sh
./get_helm.sh

Or on macOS:

brew install kubernetes-helm

That will install the latest version of Helm for us to use. Let’s now create a role for helm/tiller to use. Place the following in a file called clusterrole.yaml:

apiVersion: rbac.authorization.k8s.io/v1
kind: ClusterRole
metadata:
annotations:
rbac.authorization.kubernetes.io/autoupdate: "true"
labels:
kubernetes.io/bootstrapping: rbac-defaults
name: cluster-admin
rules:
- apiGroups:
- '*'
resources:
- '*'
verbs:
- '*'
- nonResourceURLs:
- '*'
verbs:
- '*'

To create the cluster role, let’s run this command:

kubectl create -f clusterrole.yaml

Now we’ll create a service account to utilize this role with these commands:

kubectl create serviceaccount -n kube-system tiller
kubectl create clusterrolebinding tiller-cluster-rule --clusterrole=cluster-admin --serviceaccount=kube-system:tiller

Let’s now initialize helm:

helm init --service-account tiller

We can verify if that worked with the following command:

kubectl --namespace kube-system get pods

In that output, you should see a line showing a namespace item of “tiller-deploy” with a status of “running.”

Once we have that installed, let’s install Anchore via the helm chart:

helm install --name anchore-demo stable/anchore-engine

This will install a demo instance of Anchore engine that allows anonymous access. You may want to consult our documentation on helm installs here for more detailed or specific types of configurations to install.

Hopefully, you now have a local copy of Anchore to use on your local development processes using MiniKube and Helm.